1. Introduction
When coffee drops, soup splatter, salted snowmelt or other suspension dries out, the suspended solid remains as a residual stain or pattern. This is the result of a singular evaporative flux at the contact line which is pinned at the substrate (Deegan et al. Reference Deegan, Bakajin, Dupont, Huber, Nagel and Witten1997). The resulting fluid flow advects particles to the edge, where they aggregate, while the fluid itself evaporates. Consequently, single rings (Deegan et al. Reference Deegan, Bakajin, Dupont, Huber, Nagel and Witten1997, Reference Deegan, Bakajin, Dupont, Huber, Nagel and Witten2000; Deegan Reference Deegan2000; Popov Reference Popov2005; Snoeijer et al. Reference Marín, Gelderblom, Lohse and Snoeijer2011) or multiple rings (Adachi, Dimitrov & Nagayama Reference Adachi, Dimitrov and Nagayama1995; Shmuylovich, Shen & Stone Reference Shmuylovich, Shen and Stone2002; Abkarian, Nunes & Stone Reference Abkarian, Nunes and Stone2004; Maheshwari et al. Reference Maheshwari, Zhang, Zhu and Chang2008; Zhang et al. Reference Zhang, Maheshwari, Chang and Zhu2008; Kaya, Belyi & Muthukumar Reference Kaya, Belyi and Muthukumar2010; Tarasevich, Vodolazskaya & Bondarenko Reference Tarasevich, Vodolazskaya and Bondarenko2013; Lebovka et al. Reference Lebovka, Gigiberiya, Lytvyn, Tarasevich, Vodolazskaya and Bondarenko2014; Yang, Li & Sun Reference Yang, Li and Sun2014; Kaplan et al. Reference Kaplan, Wu, Mandre, Aizenberg and Mahadevan2015), and a variety of different patterns (Frastia, Archer & Thiele Reference Frastia, Archer and Thiele2011, Reference Frastia, Archer and Thiele2012; Thiele Reference Thiele2014; Yang et al. Reference Yang, Li and Sun2014) form in the vicinity of the contact line. In contrast, eliminating the surface roughness of the substrate (Marín et al. Reference Marín, Gelderblom, Susarrey-Arce, van Houselt, Lefferts, Gardeniers, Lohse and Snoeijer2012) or drying a suspension of anisotropic colloidal particles (Yunker et al. Reference Yunker, Still, Lohr and Yodh2011) leads to the uniform deposition of particles over the droplet area. Furthermore, the transition from narrow single rings to uniform films can be engineered when the evaporation happens relatively fast (Lin et al. Reference Lin, Jaeger, Sorensen and Klabunde2001; Narayanan, Wang & Lin Reference Narayanan, Wang and Lin2004; Bigioni et al. Reference Bigioni, Lin, Nguyen, Corwin, Witten and Jaeger2006).
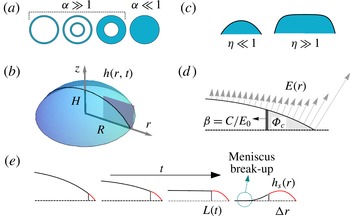
Schematics of a drying suspension on a horizontal substrate. (a) Single rings, multiple concentric rings, broad bands and uniform films are displayed. (b) The fluid height
 $h(r,t)$
and the polar coordinate system. The initial aspect ratio is
 ${\it\epsilon}\equiv H/R$
. (c) As a function of
 ${\it\eta}\equiv R^{2}/\ell _{cap}^{2}$
(
 $l_{cap}\equiv \sqrt{{\it\gamma}/{\it\rho}g}$
: capillary length), the initial height profile
 $h(r,0)$
of a small droplet (
 ${\it\eta}\ll 1$
) when the Laplace pressure
 $-2{\it\gamma}{\it\kappa}$
dominates the pressure
 $p$
(
 ${\it\kappa}$
: mean curvature) and a puddle (
 ${\it\eta}\gg 1$
) when the hydrostatic pressure
 ${\it\rho}gh$
is dominant. (d) The droplet cross-section (dark plane in (b)) and definitions of variables. (e) The evolution of the deposit width
 ${\rm\Delta}r$
, the solid height
 $h_{s}(r)$
(red) and the interface position
 $L(t)$
with time
 $t$
.

The transition from single rings, multiple concentric rings or broad bands to uniform deposits (figure 1
a) can be understood by simple scaling relations. When the contact line of the drying drop (solvent viscosity
 ${\it\mu}$
, interfacial tension
 ${\it\gamma}$
) is pinned to the substrate, we note that the initial droplet aspect ratio is much smaller than unity (
 ${\it\epsilon}\equiv H/R\ll 1$
, see figure 1(b) for definitions). In this limit, the Navier–Stokes equations for fluid flow simplify via the lubrication approximation (Oron, Davis & Bankoff Reference Oron, Davis and Bankoff1997). This yields a balance between the radial gradient of the pressure
 $p$
and viscous forces, given by
 $\partial p/\partial r={\it\mu}\partial ^{2}v_{f}/\partial z^{2}$
(Stokes flow) where
 $v_{f}$
is fluid velocity. When the droplet radius
 $R$
is smaller than the capillary length
 $\ell _{cap}\equiv \sqrt{{\it\gamma}/{\it\rho}g}$
(
 ${\it\rho}$
: the density of the fluid,
 $g$
: gravity), the droplet–air interface forms a highly curved shape (figure 1
c). Then the pressure is determined by Laplace’s law (
 $p\approx {\it\gamma}\partial ^{2}h/\partial r^{2}$
), i.e.
 $p\sim {\it\gamma}H/R^{2}$
at a scaling level. Mass conservation requires that the evaporation rate
 $E_{0}$
induces a divergence of the liquid flux
 ${\it\epsilon}v_{f}$
such that
 ${\it\alpha}E_{0}\sim {\it\epsilon}v_{f}$
, where
 ${\it\alpha}$
is a dimensionless constant. So, a balance between the radial pressure gradient
 $p/R$
and transverse viscous shear
 ${\it\mu}v_{f}/H^{2}$
in the Stokes flow equation gives
 ${\it\gamma}H/R^{3}={\it\mu}{\it\alpha}E_{0}/{\it\epsilon}H^{2}$
yielding
 ${\it\alpha}={\it\epsilon}^{4}/Ca$
. Here
 ${\it\alpha}$
is the scaled inverse capillary number, where
 $Ca\equiv {\it\mu}E_{0}/{\it\gamma}$
characterizes the relative magnitude of viscous to capillary forces. When
 ${\it\alpha}\gg 1$
,
 ${\it\epsilon}v_{f}$
is much bigger than
 $E_{0}$
. In this limit, the colloids are carried towards the contact line before the drying is complete, so that a single ring, concentric rings, or a broad band forms, depending on the initial colloidal volume fraction
 ${\it\Phi}_{0}$
. When
 ${\it\alpha}\ll 1$
,
 ${\it\epsilon}v_{f}\ll E_{0}$
, and uniform films form as the solvent dries before most colloids can reach the droplet edge (Bigioni et al.
Reference Bigioni, Lin, Nguyen, Corwin, Witten and Jaeger2006). When the droplet radius
 $R$
is bigger than the capillary length
 $\ell _{cap}$
, the droplet–air interface becomes mostly flat since the hydrostatic pressure
 $p={\it\rho}gh$
dominates over capillarity (figure 1
c). Defining a new parameter
 $\tilde{{\it\alpha}}\equiv {\it\eta}{\it\alpha}$
where
 ${\it\eta}\equiv R^{2}/\ell _{cap}^{2}$
, the deposition regimes remain the same for the limits
 $\tilde{{\it\alpha}}\gg 1$
and
 $\tilde{{\it\alpha}}\ll 1$
. Although our analysis ignores surface tension gradients, a small modification of our scaling approach also allows us to explain Marangoni flow driven patterning (Hu & Larson Reference Hu and Larson2005, Reference Hu and Larson2006) (See supplementary data for details at http://dx.doi.org/10.1017/jfm.2015.496).
During deposition, colloidal particles arriving at the deposition front slow down and stop, assembling into a close-packed configuration with a critical volume fraction
 ${\it\Phi}_{c}$
. When
 ${\it\Phi}_{c}<1$
, as in the case of hexagonal packing of spheres in three dimensions (
 ${\it\Phi}_{c}\approx 0.74$
), the fluid continues to flow through the porous region in order to compensate for the loss due to the evaporation over the deposit. When the particle concentration is low in the interior of the droplet, pressure gradients are balanced by viscous stresses in Stokes flow (Landau & Lifshitz Reference Landau and Lifshitz2004). By contrast, the flow through the porous deposit is governed by Darcy’s law, where the fluid concentration becomes low. Thus, we must account for a ‘Stokes–Darcy transition’ to characterize flow in the slender drying droplet as particles are carried by the fluid, before being eventually arrested, while the fluid evaporates away. The form of the residual patterns requires that we also consider the speed of the deposition front
 $C=C({\it\Phi}_{0},t)$
relative to the evaporation rate
 $E_{0}$
. Indeed, the type of patterning is governed by the dimensionless speed
 ${\it\beta}={\it\beta}(t)\equiv C/E_{0}$
at the interface separating the liquid and forming deposit (figure 1
d). A uniform film forms when
 ${\it\beta}$
is sufficiently large to prevent the liquid meniscus, pinned to the elevated deposit edge, from touching down the substrate at later times during drying. Conversely, lower
 ${\it\beta}$
results in single rings, multiple rings or broad bands following meniscus breakup (figure 1
e). The coupling of evaporation-driven flow with a transition from a dilute suspension to porous plug requires a multiphase description of the process where the solute and solvent velocities are allowed to be different unlike in previous models (Deegan et al.
Reference Deegan, Bakajin, Dupont, Huber, Nagel and Witten2000; Popov Reference Popov2005; Craster, Matar & Sefiane Reference Craster, Matar and Sefiane2009; Okuzono, Kobayashi & Doi Reference Okuzono, Kobayashi and Doi2009; Witten Reference Witten2009; Kobayashi et al.
Reference Kobayashi, Makino, Okuzono and Doi2010; Snoeijer et al.
Reference Marín, Gelderblom, Lohse and Snoeijer2011).
2. Multiphase model
2.1. Stokes–Darcy transition
In the lubrication approximation, the depth-averaged solute and solvent velocities are given by
 $V_{s}\equiv h^{-1}\int _{0}^{h}v_{s}(r,z,t)\,\text{d}z$
and
 $V_{f}\equiv h^{-1}\int _{0}^{h}v_{f}(r,z,t)\,\text{d}z$
, where
 $v_{s}(r,z,t)$
and
 $v_{f}(r,z,t)$
are the local solute and solvent velocities, respectively. The depth-averaged solute volume fraction is
 ${\it\Phi}(r,t)=h^{-1}\int _{0}^{h}{\it\phi}(r,z,t)\,\text{d}z$
, where
 ${\it\phi}(r,z,t)$
is the local particle volume fraction,
 $1-{\it\Phi}(r,t)$
is the depth-averaged solvent volume fraction and
 $h(r,t)$
is the droplet height (figure 1
b). The growing deposit near the contact line due to the particle accumulation forms a porous plug with a volume fraction of the particle close packing
 ${\it\Phi}_{c}$
. To characterize the transition from the Stokes regime for dilute suspensions (
 ${\it\Phi}\ll 1$
) to the Darcy regime in the porous medium (
 ${\it\Phi}\simeq {\it\Phi}_{c}$
) we need a model that transitions from one regime to another. A natural candidate is an interpolation between these two linear flow regimes via the Darcy–Brinkman equation (Brinkman Reference Brinkman1949), which in the lubrication limit reads as
 $$\begin{eqnarray}\frac{\partial p}{\partial r}={\it\mu}\frac{\partial ^{2}v_{f}}{\partial z^{2}}-\frac{1}{k}(v_{f}-v_{s}),\end{eqnarray}$$
where
 $k$
is the permeability of the porous plug, and the pressure is given by
 $p=-2{\it\gamma}{\it\kappa}+{\it\rho}gh$
(figure 1
c), with
 ${\it\rho}$
the suspension density and
 $g$
being gravity. By defining
 $\tan {\it\theta}\equiv -\partial _{r}h$
, the mean curvature
 ${\it\kappa}$
of the liquid–air interface is given by
 ${\it\kappa}=-\partial _{r}(r\sin {\it\theta})/2r$
. When
 ${\it\Phi}\ll 1$
, we would like to ensure that the solute and solvent velocities coincide, i.e.
 $v_{s}\approx v_{f}$
as the particles are advected by the fluid in the Stokes regime. Beyond the deposition front, the Darcy regime should be recovered where the particles are arrested in the porous plug, namely
 $v_{s}\rightarrow 0$
as
 ${\it\Phi}\rightarrow {\it\Phi}_{c}$
. Since the deposit is experimentally incompressible (Parisse & Allain Reference Parisse and Allain1996, Reference Parisse and Allain1997), the fluid flow inside is solely determined by the evaporation (see e.g. (4.1) below). A simple closure of (2.1) consistent with these limits is
 $$\begin{eqnarray}v_{s}=\left[1-\left(\frac{{\it\Phi}}{{\it\Phi}_{c}}\right)^{{\it\Gamma}}\right]v_{f},\end{eqnarray}$$
where the exponent
 ${\it\Gamma}$
determines the rapidity of the cross-over between the two regimes (Cohen & Mahadevan Reference Cohen and Mahadevan2013). Equations (2.1) and (2.2), combined with the stress-free and no-slip boundary conditions
 $\partial v/\partial z|_{z=h}=0$
and
 $v(z=0,t)=0$
, yield the depth-averaged velocities
 $$\begin{eqnarray}V_{f}=\frac{1}{a^{3}{\it\mu}h}\frac{\partial p}{\partial r}(\tanh ah-ah),\quad V_{s}=(1-a^{2}{\it\mu}k)V_{f},\end{eqnarray}$$
where
 $a^{2}\equiv ({\it\mu}k)^{-1}({\it\Phi}/{\it\Phi}_{c})^{{\it\Gamma}}$
, with
 $1/a$
being the effective dynamic pore size. Defining
 ${\it\Phi}_{\ast }\equiv {\it\Phi}_{c}/{\it\nu}^{2/{\it\Gamma}}$
and
 ${\it\nu}\equiv H/\sqrt{k{\it\mu}}$
(the scaled inverse pore size) allows us to see that the Stokes–Darcy transition occurs when
 ${\it\Phi}_{\ast }\leqslant {\it\Phi}_{c}$
, so that the suspension transitions to a porous plug even before it gets jammed (Cohen & Mahadevan Reference Cohen and Mahadevan2013; Kaplan et al.
Reference Kaplan, Wu, Mandre, Aizenberg and Mahadevan2015).
When the suspension becomes slurry-like at
 ${\it\Phi}_{0}\simeq {\it\Phi}_{\ast }$
, and
 ${\it\nu}\gg 1$
corresponding to a small permeability
 $k$
, the second term of
 $V_{f}$
in (2.3) becomes dominant, leading to
 $$\begin{eqnarray}V_{f}=-{\it\nu}\left(\frac{{\it\Phi}_{c}}{{\it\Phi}}\right)^{{\it\Gamma}}\frac{\partial p}{\partial r}\end{eqnarray}$$
in dimensionless form, and the prefactor of
 $V_{s,f}$
in the solid and liquid fluxes
 $Q_{s,f}$
reduces to
 ${\it\alpha}/{\it\nu}^{2}$
. Then, for a slurry-like mixture with a small permeability,
 ${\it\alpha}\gg {\it\nu}^{2}$
leads to single or concentric rings, as well as broad bands, whereas
 ${\it\alpha}\ll {\it\nu}^{2}$
results in uniform deposition. When
 ${\it\eta}\gg 1$
(namely
 $R^{2}\gg \ell _{cap}^{2}$
),
 ${\it\alpha}\gg {\it\nu}^{2}/{\it\eta}$
induces ring formation, whereas uniform films form for
 ${\it\alpha}\ll {\it\nu}^{2}/{\it\eta}$
.
2.2. Effective viscosity of the suspension
Our theory differs from other phenomenological approaches to dense suspension hydrodynamics (Stickel & Powell Reference Stickel and Powell2005; Cook, Bertozzi & Hosoi Reference Cook, Bertozzi and Hosoi2008; Kobayashi et al.
Reference Kobayashi, Makino, Okuzono and Doi2010; Frastia et al.
Reference Frastia, Archer and Thiele2011, Reference Frastia, Archer and Thiele2012; Tarasevich, Vodolazskaya & Isakova Reference Tarasevich, Vodolazskaya and Isakova2011) in a fundamental way: it correctly accounts for the multiphase nature of the flow that allows for a porous plug to form even as the fluid flows through it. This is an essential feature of drying suspensions, which, to our knowledge, has not theoretically been addressed before. When combined with (2.2), the Darcy–Brinkman equation (2.1) takes into account the change in the suspension viscosity as a function of the volume fraction
 ${\it\Phi}$
. To understand how this effective viscosity relation
 ${\it\mu}({\it\Phi})$
for the Stokes–Darcy transition behaves in analogy with the Stokes velocity, we denote the depth-averaged flow velocity of the suspension as
 $$\begin{eqnarray}U=-\frac{h^{2}}{3{\it\mu}({\it\Phi})}\frac{\partial p}{\partial r}.\end{eqnarray}$$
Next we define an average velocity for the suspension
 $V_{av}$
in terms of
 $V_{f}$
,
 $V_{s}$
and
 ${\it\Phi}$
, which is given by
 $V_{av}={\it\Phi}V_{s}+(1-{\it\Phi})V_{f}$
(Cook et al.
Reference Cook, Bertozzi and Hosoi2008). Setting
 $V_{av}$
equal to
 $U$
yields the effective viscosity as
 $$\begin{eqnarray}{\it\mu}_{eff}({\it\Phi})=\frac{{\it\mu}a^{3}h^{3}{\it\Phi}_{c}^{{\it\Gamma}}}{3(ah-\tanh ah)({\it\Phi}_{c}^{{\it\Gamma}}-{\it\Phi}^{{\it\Gamma}+1})}.\end{eqnarray}$$
For
 ${\it\Gamma}=4$
, we compare (2.6) with the empirical Krieger–Doherty relation (Stickel & Powell Reference Stickel and Powell2005; Cook et al.
Reference Cook, Bertozzi and Hosoi2008; Okuzono et al.
Reference Okuzono, Kobayashi and Doi2009), which is given by
 ${\it\mu}_{KD}({\it\Phi})\equiv {\it\mu}/(1-{\it\Phi}/{\it\Phi}_{c})^{2}$
(see figure S1 in the supplementary data). Whereas the two expressions agree very well at low and intermediate concentrations, (2.6) yields a finite effective viscosity when
 ${\it\Phi}\sim {\it\Phi}_{c}$
. However,
 ${\it\mu}_{KD}({\it\Phi})$
diverges as
 ${\it\Phi}\rightarrow {\it\Phi}_{c}$
, so the fluid flow from the droplet interior into the deposit vanishes upon drying. This scenario contradicts the fact that there is a net liquid flux into the forming deposit as observed in drying colloidal suspensions and clogged microcapillaries (Cohen & Mahadevan Reference Cohen and Mahadevan2013; Kaplan et al.
Reference Kaplan, Wu, Mandre, Aizenberg and Mahadevan2015). Thus, (2.6) yields a behaviour consistent with observations and correctly describes the Stokes–Darcy transition by (i) yielding a finite viscosity everywhere so that fluid flow into the deposit is maintained, and (ii) introducing a dynamic length scale (the effective dynamic pore size
 $1/a$
) essential for porous flow. Neither (i) nor (ii) is satisfied by
 ${\it\mu}_{KD}({\it\phi})$
or similar empirical relations from dense suspension rheology.
2.3. Conservation laws
We define a set of dimensionless variables as follows: horizontal coordinate
 $r\equiv R\tilde{r}$
, vertical height
 $h\equiv H\tilde{h}$
, time
 $t\equiv H/E_{0}\tilde{t}$
, velocities
 $V_{s,f}\equiv ({\it\epsilon}^{3}{\it\gamma}/{\it\mu}{\it\nu}^{3})\tilde{V}_{s,f}$
, dimensionless pressure
 $p\equiv ({\it\gamma}{\it\epsilon}/R)\tilde{p}$
where
 $\tilde{p}\equiv -2{\it\kappa}+{\it\eta}h$
,
 ${\it\eta}\equiv R/\ell _{cap}$
where
 $\ell _{cap}\equiv \sqrt{{\it\gamma}/{\it\rho}g}$
is the capillary length, and the dimensionless evaporation rate
 $\tilde{E}(r)\equiv E(r)/E_{0}$
. Furthermore, we let
 ${\it\nu}\equiv H/\sqrt{k{\it\mu}}$
be the scaled inverse pore size and the Péclet number
 $Pe\equiv E_{0}R/D_{s}$
, with
 $D_{s}$
being the solute diffusivity. Dropping the tildes from the dimensionless quantities, and using an axisymmetric polar coordinate system in the rest frame (figure 1
b), the depth-averaged scaled equations of local fluid and solute mass conservation are given by
 $$\begin{eqnarray}\displaystyle & \displaystyle \frac{\partial }{\partial t}[(1-{\it\Phi})h]+\frac{1}{r}\frac{\partial (rQ_{f})}{\partial r}=-E(r)\sqrt{1+({\it\epsilon}\partial _{r}h)^{2}}, & \displaystyle\end{eqnarray}$$
 $$\begin{eqnarray}\displaystyle & \displaystyle \frac{\partial }{\partial t}[{\it\Phi}h]+\frac{1}{r}\frac{\partial (rQ_{s})}{\partial r}=0. & \displaystyle\end{eqnarray}$$
Here the scaled liquid flux is given by
 $Q_{f}(r,t)=({\it\alpha}/{\it\nu}^{3})(1-{\it\Phi})hV_{f}$
(
 $Q_{f}(r,t)=(1-{\it\Phi})hV_{f}$
in dimensional units), the particle flux
 $Q_{s}(r,t)=({\it\alpha}/{\it\nu}^{3}){\it\Phi}hV_{s}-Pe^{-1}{\it\epsilon}h(\partial {\it\Phi}/\partial r)$
(
 $Q_{s}(r,t)={\it\Phi}hV_{s}-D_{s}h(\partial {\it\Phi}/\partial r)$
in dimensional units), and
 $E(r)\equiv 1/\sqrt{1-r}$
is the scaled singular form of the local evaporation rate (figure 1
d) along the droplet surface (Deegan et al.
Reference Deegan, Bakajin, Dupont, Huber, Nagel and Witten1997; Deegan Reference Deegan2000). The coupled sixth-order system of (2.3)–(2.8) becomes a boundary value problem for
 $h(r,t)$
and
 ${\it\Phi}(r,t)$
, once appropriate boundary and initial conditions are given.
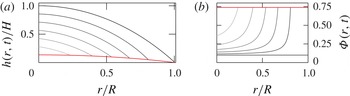
Uniform film deposition (
 ${\it\alpha}\ll 1\,,$
 $Pe\gg 1$
). (a) Evolution of the fluid interface
 $h(r,t)$
(greyscale) and the solid height
 $h_{s}(r)$
(red). (b) The change of the depth-averaged colloidal concentration
 ${\it\Phi}(r,t)$
(greyscale) corresponding to (a). The red line is at
 ${\it\Phi}_{c}=0.74$
. In (a) and (b),
 ${\it\Phi}_{0}=0.1$
,
 ${\it\eta}\equiv R^{2}/\ell _{cap}^{2}=1$
, and the greyscale changes from dark to light with increasing time. The results shown in (a) and (b) correspond to (3.1) and (3.2).

3. Deposition of uniform films
The initial droplet aspect ratio
 ${\it\epsilon}$
can be decreased either because of a small initial contact angle or by starting with a bigger droplet (i.e. by increasing
 ${\it\eta}$
, see figure 1
c). Either of these implies that
 ${\it\alpha}\ll 1$
, even if the capillary number
 $Ca$
is invariant. Furthermore, if the particle diffusion is negligible, i.e.
 $Pe\gg 1$
, we see a sharp deposition front. Under these conditions, the liquid and solid fluxes
 $Q_{f,s}$
in (2.7) and (2.8) vanish.
 $Q_{f}$
vanishes at the droplet edge as well, even though the fluid velocity
 $V_{f}$
diverges near the contact line, since
 $hV_{f}$
stays constant there (Deegan et al.
Reference Deegan, Bakajin, Dupont, Huber, Nagel and Witten1997, Reference Deegan, Bakajin, Dupont, Huber, Nagel and Witten2000; Deegan Reference Deegan2000). Then, (2.7) and (2.8) reduce to the initial value problem
 $\partial h/\partial t=-E(r)$
and
 $\partial [{\it\Phi}h]/\partial t=0$
, which yield
 $$\begin{eqnarray}h(r,t)=h(r,0)-E(r)t,\quad {\it\Phi}(r,t)={\it\Phi}_{0}\frac{h(r,0)}{h(r,t)},\end{eqnarray}$$
where the initial condition
 $h(r,0)$
is the hydrostatic height profile given the contact angle
 ${\it\theta}_{e,0}$
at the droplet edge. Locally,
 $h(r,t)$
evolves only until the critical time
 $t_{c}=t_{c}(r),$
when the colloids get jammed at the deposition front
 $r=L(t_{c})$
with
 ${\it\Phi}(r,t_{c})={\it\Phi}_{c}=0.74$
(figure 2
b). The deposit height is then fixed at
 $h_{s}(r)=h(r,0)-E(r)t_{c}(r)$
for
 $t\geqslant t_{c}$
(figure 2
a). In figure 2(a), it is evident that the liquid–air interface always preserves a convex profile, so that meniscus touch-down is avoided, and the deposition front propagates to the droplet centre, leaving behind a uniform film. The critical time for jamming
 $t_{c}$
is determined from (3.1) when
 ${\it\Phi}(r,t_{c})={\it\Phi}_{c}$
. Then
 $h_{s}(r)$
and
 $t_{c}$
are given by
 $$\begin{eqnarray}h_{s}(r)=\frac{{\it\Phi}_{0}}{{\it\Phi}_{c}}h(r,0),\quad t_{c}(r)=\frac{Th(r,0)}{E(r)},\end{eqnarray}$$
where
 $T\equiv ({\it\Phi}_{c}-{\it\Phi}_{0})/{\it\Phi}_{c}$
is the final dimensionless time of deposition at the centre of the droplet (
 $r=0$
). When
 ${\it\eta}\ll 1$
(figure 1
c), the hydrostatic profile becomes a spherical cap and is given by
 $h(r,0)=1-r^{2}$
for very low contact angle (Witten Reference Witten2009) (figure S2(a) in the supplementary data).
To calculate how the volume fraction
 ${\it\Phi}={\it\Phi}(r^{\prime },t_{c})$
scales near the deposition front
 $L(t=t_{c})$
at the end drying (
 $r^{\prime }<L(t)\ll 1$
), we determine
 $t_{c}$
using (3.2),
 $$\begin{eqnarray}t_{c}(L)=T(1-L^{2})\sqrt{1-L},\end{eqnarray}$$
where we have used the analytical expressions for
 $h(r,0)$
and
 $E(r)$
at
 $r=L$
. In terms of the deposit width
 ${\rm\Delta}r\equiv 1-L$
, the critical time is
 $t_{c}=(T{\rm\Delta}r+1)/2$
. Finally, in these limits, the volume fraction
 ${\it\Phi}={\it\Phi}(r^{\prime },t_{c})$
becomes
 $$\begin{eqnarray}{\it\Phi}(r,t_{c})={\it\Phi}_{0}\left[\frac{2}{1-T{\rm\Delta}r}+\frac{(1+T{\rm\Delta}r)r^{\prime }}{(1-T{\rm\Delta}r)^{2}}\right]\end{eqnarray}$$
by virtue of (3.1) and (3.2). According to (3.4) the volume fraction scales as
 ${\it\Phi}(r^{\prime })\sim r^{\prime }$
close to the front as it arrives near the droplet centre. This linear behaviour is different from the scaling laws for ring formation found by Witten (Reference Witten2009) and Zheng (Reference Zheng2009), since the rings are deposited by the particulate flow.
Having calculated the scaled droplet height
 $h(r,t)$
, the solid volume fraction
 ${\it\Phi}(r,t)$
and the deposit height
 $h_{s}(r)$
, we turn to the dynamics of the deposition front location
 $L(t)$
given by the condition
 $\text{d}r/\text{d}t|_{r=L(t)}=C$
. Since all lengths are scaled by the thickness of the droplet
 $H$
, and velocities are scaled by the evaporation rate
 $E_{0}$
, in scaled form, the deposition front follows the relation
 $$\begin{eqnarray}\left.\frac{\text{d}r}{\text{d}t}\right|_{r=L(t)}={\it\epsilon}{\it\beta}.\end{eqnarray}$$
At
 $t=t_{c}(r),$
taking the reciprocal of both sides of (3.5) yields
 ${\it\beta}(t)=1/{\it\epsilon}\partial _{r}t(r)|_{r=L}$
, showing that
 ${\it\beta}$
diverges both initially when
 $h(r,t)\ll 1$
close to
 $r=R$
and at the end of drying when
 ${\it\Phi}(r,t)\sim {\it\Phi}_{0}$
close to
 $r=0$
(figure S2(b) in the supplementary data). Using (3.3) when
 ${\it\eta}\ll 1$
, the deposition speed is found as
 $$\begin{eqnarray}{\it\beta}=-\frac{2}{{\it\epsilon}T}\frac{1}{(1+5L)\sqrt{1-L}}.\end{eqnarray}$$
Equations (3.3) and (3.6) yield scaling relations at the beginning (
 ${\rm\Delta}r\ll 1$
) and end of the deposition (
 $L\ll 1$
). When the deposition front is very close to the droplet centre (
 $L\ll 1$
), the series expansions of (3.3) and (3.6) at the lowest order of
 $L$
give
 ${\it\beta}\approx -2(1-9L/2)/{\it\epsilon}T$
and
 $t_{c}\approx T(1-L/2)$
. So, in terms of
 $t=t_{c}$
the deposition speed and width become
 $$\begin{eqnarray}{\it\beta}\approx -\frac{2}{{\it\epsilon}T}+\frac{18}{{\it\epsilon}T}\left(1-\frac{t}{T}\right),\quad {\rm\Delta}r=\frac{2t}{T}-1.\end{eqnarray}$$
When the particles are initially depositing near the contact line (
 ${\rm\Delta}r\ll 1$
), rewriting (3.3) and (3.6) in terms of
 ${\rm\Delta}r$
followed by a series expansion yields
 ${\it\beta}=-({\rm\Delta}r)^{-1/2}/3{\it\epsilon}T$
and
 $t_{c}=2T({\rm\Delta}r)^{3/2}$
at the lowest order. These imply that at the beginning the width and speed of the deposition become
 $$\begin{eqnarray}{\rm\Delta}r=\left(\frac{t}{2T}\right)^{2/3},\quad {\it\beta}=-\frac{1}{3{\it\epsilon}T}\left(\frac{t}{2T}\right)^{-1/3}.\end{eqnarray}$$
Thus far we have assumed that solute diffusion is not important, i.e.
 $Pe\gg 1$
, but when this is not the case, we have to take into account the diffusion term in (2.8).
4. Deposition of rings
The aspect ratio
 ${\it\epsilon}$
of small droplets is in general bigger than that of puddles (figure 1
c), so that even for constant
 $Ca$
, a sufficiently big
 ${\it\epsilon}$
can imply
 ${\it\alpha}\gg 1$
. In this limit we need to complement the coupled sixth-order system of (2.3)–(2.8) with seven boundary conditions over the interval
 $r\in [0,L(t)]$
to determine
 $h(r,t),{\it\Phi}(r,t)$
and the deposition front velocity
 ${\it\beta}(t)$
. Three boundary conditions at
 $r=0$
are given by symmetry: the vanishing particle flux
 $Q_{s}(0,t)=0$
, the vanishing liquid flux
 $Q_{f}(0,t)=0$
and the flat meniscus height profile
 $\partial h/\partial r|_{r=0}=0$
. At the deposition front
 $r=L(t)$
, the liquid flux into the deposit at the interface must compensate for the loss of solvent via the evaporation over the deposit height
 $h_{s}(r)$
. The differential form of this condition in the frame co-moving with the wall at a speed
 ${\it\beta}$
becomes
 $$\begin{eqnarray}\frac{1}{{\it\epsilon}{\it\beta}}\frac{\partial }{\partial t}[(1-{\it\Phi})h{\it\alpha}V_{f}]=-E(r)\sqrt{1+({\it\epsilon}\partial _{r}h)^{2}},\end{eqnarray}$$
where (3.5) is used to express the spatial derivative in terms of the time derivative. As the colloids are arrested, the particle flux inside the solid vanishes. Therefore, in the moving frame, the particle flux continuity at
 $r=L(t)$
is given by
 $Q_{s}-{\it\epsilon}{\it\Phi}h{\it\beta}=-{\it\epsilon}{\it\Phi}_{c}h{\it\beta}$
, which yields
 $$\begin{eqnarray}{\it\beta}(t)=\frac{1}{{\it\epsilon}({\it\Phi}-{\it\Phi}_{c})}\left(\frac{{\it\alpha}}{{\it\nu}^{3}}{\it\Phi}V_{s}-Pe^{-1}{\it\epsilon}\frac{\partial {\it\Phi}}{\partial r}\right).\end{eqnarray}$$
The height
 $h_{i}$
at the wall between the liquid and the incompressible deposit satisfies
 $\partial h_{i}/\partial t=0$
in the rest frame. In the moving frame, this condition translates to
 $$\begin{eqnarray}\frac{\partial h_{i}(t)}{\partial t}=\frac{{\it\epsilon}{\it\beta}}{r}\frac{\partial (rh)}{\partial r}\bigg|_{r=L(t)}.\end{eqnarray}$$
To extract
 ${\it\beta}(t)$
asymptotically from (4.2), we fix the particle volume fraction
 ${\it\Phi}_{i}$
at the interface as
 $$\begin{eqnarray}{\it\Phi}_{i}\equiv {\it\Phi}_{c}-10^{-3}.\end{eqnarray}$$
We solve (2.3), (2.7) and (2.8) numerically for the droplet–air interface height
 $h(r,t)$
, the depth-averaged particle volume fraction
 ${\it\Phi}(r,t)$
and the deposition front velocity
 ${\it\beta}(t)$
via the COMSOL Multiphysics 4.3a finite element package (2012). The initial aspect ratio is specified by the hydrostatic height
 $h(r,0)$
and
 ${\it\eta}$
, which yield
 ${\it\epsilon}\approx 0.12$
when
 ${\it\eta}=1$
. The capillary number and Péclet number are given by
 $Ca=10^{-8}$
and
 $Pe=20$
, so that
 ${\it\alpha}\gg 1$
. The physical parameters and initial conditions used in the simulations are given in § B of the supplementary data. The movies in § A of the supplementary data demonstrate the evolution of the height and volume fraction profiles for different
 ${\it\Phi}_{0}$
and
 ${\it\eta}$
.
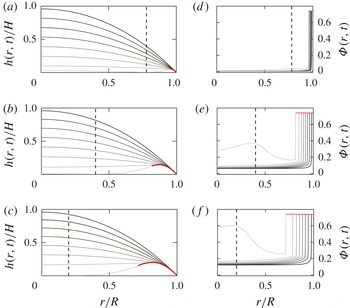
Meniscus touch-down and deposition of rings or broad bands (
 ${\it\alpha}\gg 1$
,
 ${\it\eta}=1$
). (a–c) The evolution of the interface height
 $h(r,t)$
(greyscale) and the solid height
 $h_{s}(r)$
(red) for the given initial particle volume fraction
 ${\it\Phi}_{0}$
; (a,d)
 ${\it\Phi}_{0}=0.005$
, (b,e)
 ${\it\Phi}_{0}=0.06$
, (c,f)
 ${\it\Phi}_{0}=0.12$
. (d–f) The evolution of the local colloidal volume fraction
 ${\it\Phi}(r,t)$
corresponding to (a–c), respectively. The red lines in (d–f) are at
 ${\it\Phi}_{c}=0.74$
. The dashed lines denote the touch-down location
 $r_{0}$
of the meniscus. The greyscale changes from dark to light with increasing time. These results are solutions to (2.3), (2.7), and (2.8), subject to the boundary conditions given in (4.1)–(4.4) at
 $r=L(t)$
, and
 $Q_{s}=Q_{f}=\partial h/\partial r=0$
at
 $r=0$
with parameter values as indicated in § B of the supplementary data.

In figure 3(a–c), we show the time evolution of
 $h(r,t)$
and
 $h_{s}(r)$
in the lab frame. Towards the end of the droplet lifetime, the meniscus reverses curvature and touches the substrate at a location
 $r_{0}$
(dashed vertical lines in figure 3, and grey dots as a function of
 ${\it\Phi}_{0}$
in figure 4
a), at a time
 $t_{f}\sim 0.2H/E_{0}$
. The meniscus touch-down (see figure 1
e), assumed to be axisymmetric, is followed by a breakup into two contact lines (Kaplan et al.
Reference Kaplan, Wu, Mandre, Aizenberg and Mahadevan2015). The assumption of axisymmetry involves ignoring local touch-down and breakup due to the irregularities of the substrate or particle adhesion on the surface. To regain the equilibrium contact angle
 ${\it\theta}_{e,0}$
(de Gennes Reference de Gennes1985; de Gennes, Brochard-Wyart & Quéré Reference de Gennes, Brochard-Wyart and Quéré2004), the contact line closer to
 $r=0$
moves to the droplet centre, whereas the other one will move towards the deposition front and the fluid will be wicked by the jammed colloids.
When
 ${\it\Phi}_{0}\ll 1$
, narrow rings form with a width
 ${\rm\Delta}r(t)\ll 1$
(figure 3
a,d). The magnitude of the front speed
 ${\it\beta}(t)$
determines the ring width. The variables
 ${\it\beta}$
and
 ${\rm\Delta}r$
are shown, respectively, in figures S3 and S4(a) in the supplementary data. For single rings,
 ${\it\beta}(t)$
reaches a steady state at early times for
 ${\it\Phi}_{0}\ll 1$
, consistent with earlier observations at low volume fractions (Yang et al.
Reference Yang, Li and Sun2014). For intermediate
 ${\it\Phi}_{0}$
, the particle concentration builds up below the meniscus touch-down location
 $r_{0}$
, as evidenced by the maxima in
 ${\it\Phi}(r,t)$
on the liquid side of the wall in figures 3(e), and 4(b). To quantify the width and speed of deposition at early and late times, we have extracted numerical scaling laws in the limit
 ${\it\eta}\ll 1$
(§ D and table S1 in the supplementary data). Close to the time of meniscus touch-down
 $t_{f}$
, the deposition width and speed diverge as
 ${\rm\Delta}r\sim (t_{f}-t)^{-0.03}$
and
 ${\it\beta}\sim (t_{f}-t)^{-0.1}$
at low volume fractions (
 ${\it\Phi}_{0}\ll 1$
), which are slower than the scaling laws of Witten (Reference Witten2009) and Zheng (Reference Zheng2009). The analyses in those works were based on a hydrostatic circular profile at all times, compressible deposits and the effect of flow close to the droplet centre. In our case, however, the incompressible deposit deforms the meniscus at later stages of drying such that it becomes concave, eventually touching the substrate. Hence, the effect of far-field flow on the deposition dynamics diminishes, leading to different scaling laws. Furthermore, since the droplet becomes very thin at the point of touch-down, the volume fraction exhibits a maximum as opposed to the previously estimated monotonic concentration profiles (Witten Reference Witten2009; Zheng Reference Zheng2009).
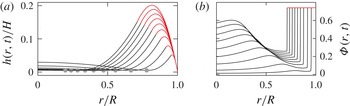
Phase space of possibilities for the case of ring formation showing the location of meniscus touch-down and deposition of rings (
 ${\it\alpha}\gg 1$
,
 ${\it\eta}=1$
). (a) Drop height
 $h(r,t)$
(black), deposit height
 $h_{s}(r)$
(red), and (b) deposit concentration
 ${\it\Phi}(r,t)$
at meniscus touch-down are shown as a function of increasing
 ${\it\Phi}_{0}$
from bottom to top. In (a), from right to left,
 $r_{0}$
(grey dots) decreases when
 ${\it\Phi}_{0}$
increases. The data in (a) and (b) correspond to
 ${\it\Phi}_{0}\in \{5\times 10^{-3}\cup [1.5\times 10^{-2},0.12]\}$
in
 $1.5\times 10^{-2}$
increments. These results are solutions to (2.3), (2.7) and (2.8), subject to the boundary conditions given in (4.1)–(4.4) at
 $r=L(t)$
, and
 $Q_{s}=Q_{f}=\partial h/\partial r=0$
at
 $r=0$
. The physical parameters are given in § B of the supplementary data.

The accumulation of colloids in the vicinity of
 $r_{0}$
facilitates the formation of an adjacent inner ring. Following meniscus breakup, the inner contact line moves until it reaches an equilibrium state or is pinned by the substrate and the colloids (Kaplan et al.
Reference Kaplan, Wu, Mandre, Aizenberg and Mahadevan2015). The particle aggregate close to the inner contact line in motion may either adhere to the substrate or be dragged by the contact line until it becomes jammed (Yang et al.
Reference Yang, Li and Sun2014). Figure 4(a) depicts the profiles shortly before the concentric inner ring formation, noting that
 ${\it\beta}$
changes rapidly over the course of drying for bigger
 ${\it\Phi}_{0}$
. While the contact line closer to the deposition front at
 $L(t_{f})$
recedes, the colloids between
 $r_{0}$
and
 $L(t_{f})$
are laid down and thus contribute to the deposit width, leading to an effective ring width
 ${\rm\Delta}r_{eff}>{\rm\Delta}r$
(see § E and figure S4(b) in the supplementary data). Our calculations show that
 ${\rm\Delta}r_{eff}\sim {\it\Phi}_{0}^{0.67}$
(table S1 in the supplementary data), in agreement with experiments (Deegan Reference Deegan2000). When
 ${\it\Phi}_{0}$
increases,
 $r_{0}$
shifts towards the droplet centre, as demonstrated in figure 4(b). At large
 ${\it\Phi}_{0}$
we see the formation of a broad band in figures 3(c,f) and 4(a,b), with
 ${\rm\Delta}r\simeq R/3$
near the contact line, and the touch-down location approaches the droplet centre (
 $r_{0}\rightarrow 0$
). The scaling behaviour of
 $r_{0}$
as a function of
 ${\it\Phi}_{0}$
is given in figure S4(c) and table S2 in the supplementary data.
The shape of the incompressible band
 $h_{s}(r)$
for all
 ${\it\Phi}_{0}$
is governed by (4.3): if the meniscus contact angle at the wall
 ${\it\theta}_{e}(L(t),t)>0$
, then
 $h_{s}(r)$
increases as the band expands (early stages), and
 ${\it\theta}_{e}(L(t),t)<0$
would lead to a decreasing height profile (late stages). The combination of the early- and late-stage behaviours results in the curved
 $h_{s}(r)$
profiles shown in figure 4(a), which qualitatively agree with the experimental deposit shapes (Parisse & Allain Reference Parisse and Allain1996, Reference Parisse and Allain1997; Berteloot et al.
Reference Berteloot, Hoang, Daerr, Kavehpour, Lequeux and Limat2012). The maximum solid thickness
 $h_{max}$
is then achieved at the transition between the two stages (the maxima of the red curves in figure 4
a). The dependence of
 $h_{max}$
on
 ${\it\Phi}_{0}$
is quantified in figure S4(d) and table S1 in the supplementary data. We conclude that the incompressibility assumption and the boundary condition given by (4.3) are accurate in modelling the porous deposit.
5. Conclusions
Our multiphase model of an evaporating colloidal droplet describes the different deposition patterns and the transitions between them by accounting for how the droplet evaporates inhomogeneously even as the dilute suspension transitions into a porous plug in the neighbourhood of the contact line. We are able to characterize these phenomena in terms of two parameters, the initial concentration
 ${\it\Phi}_{0}$
and the scaled inverse capillary number
 ${\it\alpha}$
. When
 ${\it\alpha}\gg 1$
, we obtain single rings, the precursor state to multiple ring formation following meniscus breakup, and broad bands as
 ${\it\Phi}_{0}$
increases, while when
 ${\it\alpha}\ll 1$
uniform films assemble over the entire droplet area, consistent with observations.
The theory also yields the cross-sectional profiles of the deposits as a function of the particle concentration. Unlike in the case of drying vertical menisci, the dynamics of deposition and the cross-sectional profiles of patterns left behind drying droplets are not extensively studied since they are experimentally very hard to control and manipulate. Bands in drying droplets are not as uniform as in the case of vertical deposition, because the liquid–air interface never reaches a steady state. Therefore, although the deposit shapes qualitatively agree with those from Parisse & Allain (Reference Parisse and Allain1996, Reference Parisse and Allain1997) and Berteloot et al. (Reference Berteloot, Hoang, Daerr, Kavehpour, Lequeux and Limat2012), they should be quantitatively tested by measurements for a range of
 ${\it\Phi}_{0}$
and
 ${\it\eta}$
.
What remains is to understand the dynamics of particle ordering in the deposit, which will require coupling our multiphase macroscopic theory to a microscopic theory for particulate ordering in dense suspensions.
Acknowledgements
We thank A. Carlson and N. Wu for fruitful discussions and T. Salez for a critical reading of the manuscript. This research was supported by the Air Force Office of Scientific Research (AFOSR) under Award FA9550-09-1-0669-DOD35CAP and the Kavli Institute for Bionano Science and Technology at Harvard University.
Supplementary data
Supplementary data is available at http://dx.doi.org/10.1017/jfm.2015.496.