Comprehensibility, a major construct in second language (L2) pronunciation research, is broadly defined as listeners’ perceptions of how easily they understand L2 speech (Munro & Derwing, Reference Munro and Derwing1999). Comprehensibility is congruent with the instructional goal of helping learners achieve intelligible pronunciation and is central to interlocutors’ communicative success in real-world interactions (Derwing & Munro, Reference Derwing and Munro2009; Morley, Reference Morley and Morley1994). Although listener perceptions are central to the construct of comprehensibility, little is known about the dimensions that underlie listeners’ L2 comprehensibility judgments. This is because most empirical studies have focused on listeners’ numerical comprehensibility ratings without direct examination of the linguistic factors that listeners attend to when assigning comprehensibility scores. Additionally, only a few studies have examined linguistic correlates of L2 comprehensibility ratings that extend beyond segmental and temporal measures (e.g., Fayer & Krasinski, Reference Fayer and Krasinski1987).
The objectives of the present study were therefore twofold: (a) to unpack comprehensibility by examining the linguistic variables that most strongly influence raters’ scoring decisions at different assessed levels of comprehensibility and (b) to distill the criteria that most efficiently distinguish between different L2 comprehensibility levels into rating scale guidelines, using quantitative evidence from a large sample of novice raters along with qualitative reports from experienced teachers. The overall intent was to articulate a set of linguistic criteria for rating comprehensibility that could serve as a blueprint for the construction of an eventual formative assessment tool for L2 comprehensibility.
WHY A FOCUS ON COMPREHENSIBILITY?
Few L2 researchers and practitioners would disagree that intelligibility is the appropriate goal for L2 pronunciation instruction. This is because in most situations of L2 use, what really counts is L2 speakers’ ability to be understood, rather than the quality or nativelikeness of their accent (Derwing & Munro, Reference Derwing and Munro1997; Jenkins, Reference Jenkins2000; Munro & Derwing, Reference Munro and Derwing2011). This raises the question of why comprehensibility, rather than intelligibility, is the focus of this study. Levis’s (Reference Levis and Hughes2006) distinction between broad and narrow definitions of intelligibility is of relevance here. In its narrow sense, intelligibility is defined as listeners’ actual understanding of L2 speech (Munro & Derwing, Reference Munro and Derwing1999). It is most often measured by examining listeners’ accuracy of orthographic transcriptions of L2 speech, although other methods have also been used (e.g., comprehension questions, true-false statements). In its broad sense, intelligibility refers more generally to listeners’ ability to understand the speech and “is not usually distinguished from closely related terms such as comprehensibility” (Levis, Reference Levis and Hughes2006, p. 252). Comprehensibility is typically defined as listeners’ perceptions of understanding and is measured through listeners’ scalar ratings of how easily they understand speech (Munro & Derwing, Reference Munro and Derwing1999). In the context of L2 tests, several oral proficiency scales make use of the term intelligibility—for example, the Test of English as a Foreign Language (TOEFL) or the International English Language Testing System (IELTS). However, in all cases, intelligibility is measured in terms of listeners’ subjective scalar ratings, which suggests that it is, in fact, comprehensibility that is used as a criterion in these scales. The construct of comprehensibility in the present study falls under Levis’s broad sense of intelligibility and thus reflects a typical approach to assessing intelligibility in oral proficiency scales.
COMPREHENSIBILITY IN L2 ASSESSMENT INSTRUMENTS
There are several shortcomings in the way that pronunciation, and comprehensibility in particular, has been modeled in existing L2 speaking scales used in both high-stakes assessment contexts (e.g., for gatekeeping purposes) and low-stakes research settings. One shortcoming is that the treatment of pronunciation in L2 oral proficiency scales is often inconsistent, if it is included at all. Levis (Reference Levis and Hughes2006), for example, describes the pronunciation component of the American Council of the Teaching of Foreign Languages (ACTFL) Oral Proficiency Guidelines (Breiner-Sanders, Lowe, Miles, & Swender, Reference Breiner-Sanders, Lowe, Miles and Swender2000) as a “haphazard collection of descriptors” and “strikingly random in describing how pronunciation contributes to speaking proficiency” (p. 245). In other scales, such as the Common European Framework of Reference (CEFR), pronunciation is omitted altogether from benchmark-level descriptors (Council of Europe, 2001; North, Reference North2000).
Even when included, pronunciation descriptions are often too vague to delineate a coherent construct. Band 4, for example, in the publicly available IELTS Speaking Band Descriptors, reads: “Uses a limited range of pronunciation features; attempts to control features but lapses are frequent; mispronunciations are frequent and cause some difficulty for the listener” (British Council, IDP: IELTS Australia, & UCLES, n.d.). In a similar manner, the approach in the TOEFL Internet-based test (iBT) Integrated Speaking Rubrics is to link “intelligibility” with “pronunciation,” “intonation,” and “pacing” (Educational Testing Service, 2005). It is necessary to note that the descriptors in both scales are vague with respect to the errors that lead to listener difficulty because some errors could be more detrimental to comprehensibility than others (e.g., Munro & Derwing, Reference Munro and Derwing2006). The use of the term pronunciation is likewise not consistent across these scales. Whether the term refers solely to segmental features (i.e., errors that involve individual sounds) or also encompasses other aspects of speech, including suprasegmental features (e.g., word stress, rhythm, intonation), needs to be clearly spelled out to facilitate the interpretation of the scale descriptors for both raters and test users.
Relativistic wording in rating scales offers even less clarity about the construct being measured. The scale bands in Morley’s (Reference Morley and Morley1994) Speech Intelligibility/Communicability Index, for example, make reference to “fully,” “largely,” or “reasonably intelligible” and “basically” or “largely unintelligible” speech (pp. 76–77). Similarly, the 9-point numerical comprehensibility scales used in low-stakes research contexts range from extremely difficult to understand to extremely easy to understand at scalar endpoints, with no further definition provided to raters (Derwing, Munro, & Thomson, Reference Derwing, Munro and Thomson2008). Although interrater reliability (typically estimated through intraclass correlations) is high using this rating procedure (e.g., Derwing et al., Reference Derwing, Munro and Thomson2008), “reliability is a necessary but insufficient condition for validity” (Cohen, Manion, & Morrison, Reference Cohen, Manion and Morrison2000, p. 105). That is, raters may reach consensus on the relative rankings of the most and least comprehensible speakers but may be unlikely to assign a common meaning to the numerical values that designate different levels of the scale (Isaacs & Thomson, in press). Thus, raters in both low- and high-stakes settings would benefit from a clearer operationalization of comprehensibility in rating scales.
Another limitation of L2 speaking scales is that they often conflate comprehensibility and accentedness (Harding, in press). Morley’s (Reference Morley and Morley1994) Speech Intelligibility/Communicability Index, for example, equates incremental increases in comprehensibility with incremental decreases in accentedness until the highest level, where “near-native” speech is accompanied by a “virtually nonexistent” accent (p. 77). Another example is that the highest level of Cambridge’s ESOL (English for speakers of other languages) Common Scale for Speaking links “native-like” control of “many features” with easily understandable pronunciation (UCLES, 2008, p. 70). Comprehensibility and accentedness are also grouped together in band descriptors of the CEFR Scale of Phonological Control, one of several CEFR scales on distinct aspects of competence (Council of Europe, 2001). One reason for the juxtaposition of accentedness and comprehensibility in rating scales is that, apart from work on accent, little research has described the qualities of comprehensible speech in a way that can inform the operationalization of the construct in rating scales. The critical point here is that accentedness does not necessarily lead to poor comprehensibility or communication breakdowns but tends to be overemphasized due to its perceptual salience (Derwing & Munro, Reference Derwing and Munro2009).
EMPIRICAL DEVELOPMENT AND VALIDATION OF L2 SPEAKING SCALES
In light of these shortcomings, there is an urgent need for an empirically derived set of rating criteria that can describe the factors that influence listeners’ judgments of L2 speech at different levels of comprehensibility. Although comprehensibility is important for high-stakes, rater-mediated speaking assessments and informal judgments of L2 speech in real-world interactions, not enough is known about the factors that most greatly influence raters’ perceptions of L2 comprehensibility to adequately operationalize comprehensibility for assessment purposes.
A few studies in the L2 assessment literature on L2 fluency and oral proficiency have served as important precedents for development of rating scale guidelines in the present study. For example, Fulcher (Reference Fulcher1996) used grounded theory to generate a thick description of L2 fluency at different ability levels. This involved coding 21 English Language Testing System (ELTS) interview transcriptions (a precursor to the IELTS) to generate explanatory fluency categories (e.g., hesitations due to content planning, lexical access, etc.). Coded categories were then tallied and cross-validated using discriminant analysis. Results showed that the researcher-generated categories discriminated well among test takers and accurately predicted ELTS band score placement for all but one test taker. Finally, Fulcher elaborated detailed fluency descriptors by focusing on those fluency categories that had provided the strongest-level distinctions. The present study extends Fulcher’s work by consulting raters directly about influences on their L2 comprehensibility judgments in introspective reports.
In a more recent study on the validation of TOEFL iBT speaking scales, Brown, Iwashita, and McNamara (Reference Brown, Iwashita and McNamara2005) found a close correspondence between the aspects of speaking proficiency that raters attended to—without the guidance of a rating instrument—and several quantitative measures used to analyze test-taker discourse. In a follow-up study, Iwashita, Brown, McNamara, and O’Hagan (Reference Iwashita, Brown, McNamara and O’Hagan2008) examined which of these measures, grouped into the broad categories of linguistic resources, phonology, and fluency, distinguished between five levels of L2 speaking proficiency. Results showed that measures from each category were captured in raters’ scores, which implies that raters weigh multiple factors when assessing L2 oral proficiency. Iwashita and colleagues acknowledged the absence of discourse-level measures in their analyses as a limitation. The present study builds on Iwashita and colleagues’ research and examines performance in each of their overarching categories while also including discourse-level measures. Additionally, finer-grained measures of phonology are employed that do not make reference to listener categorizations of English-like or non-English-like productions.
THE CURRENT STUDY
It is clear that there is a need to better understand the construct of comprehensibility within the broader realm of L2 oral proficiency. The starting point in the current study was to unpack comprehensibility, a major construct in the L2 pronunciation literature. Examining the factors that influence listeners’ L2 comprehensibility judgments is ecologically valid because listeners’ impressions of the effort needed to understand L2 speech are likely to shape their real-world interactions with their L2 interlocutors. Identifying the linguistic variables that contribute to L2 comprehensibility at different ability levels could also inform rater training in both low-stakes research settings and high-stakes assessment contexts. Additionally, knowledge of the aspects of speech that contribute to comprehensibility could help L2 teachers set instructional targets, integrate pronunciation with the teaching of other linguistic skills (e.g., grammar, vocabulary), and inform formative assessment practices (Isaacs, Reference Isaacs2009; Kennedy & Trofimovich, Reference Kennedy and Trofimovich2010; Saito & Lyster, Reference Saito and Lyster2011).
To elaborate, although there is evidence of a recent increased interest in L2 pronunciation research and teaching, repercussions of the neglect of pronunciation over the past several decades is still being felt (Derwing & Munro, Reference Derwing and Munro2009; Foote, Holtby, & Derwing, Reference Foote, Holtby and Derwing2011; Gilbert, Reference Gilbert2010). One area in which classroom teachers—who may not have a background in either pronunciation or assessment—could benefit from further support is in the provision of a formative assessment tool to describe and benchmark learner performance as it relates to pronunciation. Although the development of such a tool with fully elaborated and validated scale descriptors is beyond the scope of the present study, the focus here was to uncover the aspects of L2 comprehensibility that are most salient to raters and to distill these criteria into comprehensibility scale guidelines. To this end, research questions (1–3) were examined:
1. Which linguistic measures most strongly correlate with novice raters’ L2 comprehensibility ratings?
2. Which linguistic aspects of speech do experienced teachers cite as most influencing their L2 comprehensibility ratings?
3. Which linguistic measures most efficiently distinguish between learners at low, intermediate, and high levels of L2 comprehensibility?
METHOD
Research Design
A sequential mixed-methods design was used to address the research questions (Creswell & Plano-Clark, 2011), in which earlier phases cumulatively informed subsequent phases. The first source of evidence was based on a quantitative analysis of speech measures associated with listeners’ comprehensibility judgments. For this analysis, the speech of 40 French learners of English was presented to 60 native English listeners for comprehensibility rating. The same speech samples were then analyzed for 19 linguistic measures—including aspects of phonological and grammatical accuracy, lexical richness, and story cohesion—to determine which measures were related to comprehensibility ratings. The second source of evidence was listeners’ qualitative reports on the aspects of speech that they attended to when assigning comprehensibility ratings. For this analysis, a coding scheme was developed based on three experienced ESL teachers’ detailed comments about the aspects of speech they focused on while rating. These descriptive comments were later quantitized (i.e., transformed into quantitative data) by tabulating frequency counts of coded categories (Teddlie & Tashakkori, Reference Teddlie and Tashakkori2009). By combining the analysis of learner discourse with the teachers’ introspective reports, it was possible to identify the measures that differentiated between L2 learners at different levels of comprehensibility. Finally, these features were mapped onto L2 comprehensibility scale guidelines.Footnote 1
L2 Speakers
The speakers comprised 40 Francophones (13 male, 27 female) from a predominantly French-speaking area of Quebec, Canada (M age = 35.6, range = 28–61) who had participated in an earlier study on L2 phonological learning (Trofimovich, Gatbonton, & Segalowitz, Reference Trofimovich, Gatbonton and Segalowitz2007). With the exception of two early French-English bilinguals, the speakers had been exposed to English in 45-min weekly ESL classes in primary school and had received up to 3 hr per week of subsequent ESL instruction. At the time of the study, the speakers estimated using English only 20% of the time on average, although to varying degrees (0–70%). Their self-reported English speaking and listening ability was also variable and spanned the range of the 9-point scale (1 = extremely poor, 9 = extremely proficient). Overall, the speakers represented different ability levels, from beginning to advanced (see Trofimovich et al., Reference Trofimovich, Gatbonton and Segalowitz2007).
All speakers were recorded telling a picture story in English in a quiet office using a Plantronics (DSP-300) microphone connected to a computer. The eight-frame picture story used to elicit the speech featured two strangers who bumped into each other on a busy street corner. They dropped the identical suitcases they were carrying, only to later discover that they had accidently retrieved the wrong suitcase (Derwing et al., Reference Derwing, Munro and Thomson2008). After normalizing the speech samples for peak amplitude and removing initial dysfluencies (e.g., false starts, hesitations), the beginning of each narrative (23–36 s duration) was excised from the recording and randomized. Speech samples were then transcribed and verified for accuracy by a second transcriber.
L2 Speech Measures
The construct of comprehensibility has primarily been associated with research on L2 pronunciation. However, it is unlikely that, given a scale with the endpoint descriptors “very easy/difficult to understand,” raters focus solely on phonological aspects of speech. In an attempt to include as many linguistic variables as raters possibly use to arrive at their comprehensibility judgments, four categories of measures were considered. Three categories were the same as those used in Iwashita and colleagues’ (2008) study on L2 oral proficiency: phonology, which included segmental and suprasegmental measures; fluency, which involved temporal measures and frequency counts of pauses; and linguistic resources, which comprised grammatical and lexical measures. The fourth category, called discourse, was added to capture speakers’ storytelling strategies and use of cohesive devices, given that these variables could influence raters’ judgments if they interpret comprehensibility to mean understanding the message or story rather than each individual word (Isaacs, in press).
Phonology.Six measures were included in this category: two at the level of individual segments (vowels and consonants) and syllables and four at the level of words and phrases.
1. Segmental error ratio: defined as the number of phonemic substitutions (e.g., fun spoken as fan) divided by the total number of segments articulated. Phonetic substitutions (e.g., [l] vs. [ɫ]) were not considered.
2. Syllable structure error ratio: defined as the total number of vowel and consonant epenthesis (insertion) and elision (deletion) errors (e.g., they with an epenthetic schwa added at the end, apologize with schwa deletion at the beginning) over the total number of syllables articulated.
3. Word stress error ratio: defined as the total number of instances of misplaced or missing primary stress in polysyllabic words (e.g., BUIL-ding spoken as buil-DING, SKY-scra-per spoken as sky-scra-PER) divided by the total number of polysyllabic words produced. The first three measures were drawn from a study by Anderson-Hsieh, Johnson, and Koehler (Reference Anderson-Hsieh, Johnson and Koehler1992), who found a relationship between these measures and ratings of intelligible speech and accent combined in a single scale.
4. Vowel reduction ratio: defined as the number of correctly reduced syllables over the total number of obligatory vowel reduction contexts in both polysyllabic words and function words (e.g., in a CI-ty there was TWO PEO-ple contains six obligatory contexts, all in lowercase letters; the speaker pronounced people as peo-PLE and, thus, produced five correct vowel reductions). This measure was designed to capture the stress-timed nature of English rhythm (Deterding, Reference Deterding2001).
5. Pitch contour: defined as the number of correct pitch patterns at the end of phrases (i.e., at syntactic boundaries) over the total number of instances in which pitch patterns are expected, as signaled by preboundary lengthening (e.g., the sentence it’s a nice sunny afternoon in Montreal [level tone] when Bob and Margaret are walking down the street about to turn a corner [falling tone] has two correct pitch patterns). This intonation measure was influenced by Wennerstrom’s (Reference Wennerstrom2001) boundary tone measure but was judged auditorily rather than through instrumental analysis (Pickering, Reference Pickering2001).
6. Pitch range: expressed as the difference between the highest and lowest fundamental frequency (F0) values measured in a pitch tracker using Praat speech analysis software (Boersma & Weenink, Reference Boersma and Weenink2010). This measure, expressed in absolute terms for each speech sample, was influenced by Wennerstrom’s (Reference Wennerstrom2001) notion of paratones, or pitch expansion to signal topic shift. The premise is that a narrower pitch range would involve fewer paratones to distinguish elements of the story, which could, in turn, lead to reduced comprehensibility (Kang, Rubin, & Pickering, Reference Kang, Rubin and Pickering2010). Examples of pitch range were 99.7 Hz (100.8–200.5) and 220.8 Hz (139.2–360.0) for male and female voices, respectively.
Fluency.Derwing, Rossiter, Munro, and Thomson’s (2004) finding that listeners’ scalar L2 comprehensibility judgments are statistically associated with fluency measures prompted the analysis of six fluency measures. For measures based on pause duration, the cutoff for measuring pauses was set at 400 ms, following Derwing and colleagues and Riggenbach (Reference Riggenbach1991).
1. Total number of filled pauses: defined as nonlexical pauses, such as uh and um (e.g., it’s a nice day in uh uh [two filled pauses] New York).
2. Total number of unfilled pauses: defined as silent pauses (e.g., One day [unfilled pause] I was appointed [unfilled pause] to attend a meeting in New York City). Filled and unfilled pauses were counted separately, following Lennon (Reference Lennon1990).
3. Pause error ratio: defined as the number of inappropriately produced filled and unfilled pauses (i.e., inside clauses and not at syntactic boundaries, where pauses would be expected), divided by the total number of pauses produced (e.g., They uh [filled pause] continue [unfilled pause] to walk to the [unfilled pause] work).
4. Repetition and self-correction ratio: defined as the sum of all immediately repeated and self-corrected words (e.g., I I [repeated] see uh buildings a a [repeated] lot of buildings with uh in [self-corrected] in [repeated] a big city) over the total number of words produced. Repetitions and self-corrections, examined here to estimate possible detrimental effects on listener comprehensibility (Derwing et al., Reference Derwing, Rossiter, Munro and Thomson2004), were pooled due to few instances of self-corrections in the speech samples. When embedded in longer phrases (e.g., buildings . . . a lot of buildings), repetitions and self-corrections were not counted.
5. Pruned syllables per second: defined as the total number of syllables produced excluding dysfluencies (e.g., filled pauses, repetitions, self-corrections, false starts), calculated over the total duration of the speech sample. Derwing and colleagues (2004) found this temporal measure to be the strongest predictor of raters’ global L2 fluency judgments, and fluency and comprehensibility were, in turn, strongly correlated.
6. Mean length of run (MLR): defined as the average number of syllables between two adjacent filled or unfilled pauses (Riggenbach, Reference Riggenbach1991).
Linguistic Resources.Because comprehensibility has mostly been studied in the context of L2 pronunciation research, investigations of other influences on comprehensibility, especially those that extend beyond phonological and temporal variables, have been limited. In an early study, Varonis and Gass (Reference Varonis and Gass1982) found that ungrammatical sentences negatively affect comprehensibility. They theorized that comprehensibility is equal to the sum of various linguistic and social factors (e.g., including pronunciation, grammar, fluency, and listener familiarity with the individual speaker), the speaker’s native language (L1), and the topic. Fayer and Krasinski (Reference Fayer and Krasinski1987) found that native and nonnative listeners were more frequently distracted by pronunciation and hesitations than by grammar, intonation, word choice, and voice quality. Finally, Munro and Derwing (Reference Munro and Derwing1999) found that intonation ratings and coded categories of grammatical errors were significantly correlated with L2 comprehensibility ratings in more than half of the listeners who provided ratings.Footnote 2 To examine possible detrimental effects of grammatical and lexical errors on listener comprehension, one grammatical accuracy measure and three lexical measures were included.
1. Grammatical accuracy: defined as the number of words with at least one morphosyntactic error divided by the total word count. Morphosyntactic errors were those in sentence structure, morphology, or syntax, including word order errors (e.g., they falled on the floor and exchanged your suitcase contained one inflectional error and one pronoun error). This measure is similar to Foster and Skehan’s (Reference Foster and Skehan1996) and Skehan and Foster’s (1999) global accuracy measure, which was sensitive to differences in L2 oral performance as a function of task characteristics (e.g., pretask planning time).Footnote 3 The measure of grammatical accuracy, as defined here, was conservative in the sense that no multiple morphosyntactic errors per word were counted (e.g., there’s a little house where live a woman contained both a verb tense error and a word order error associated with the word live, but only one error was counted). This was done to control for extreme cases of variability in individual speakers’ error counts.
2. Lexical error ratio: defined as the number of incorrectly used lexical expressions, including phonetically similar but semantically inappropriate words (e.g., above to arrive instead of about to arrive), false cognates (e.g., circulation instead of traffic), imprecise vocabulary choice (e.g., in a big country instead of in a big city), incorrectly used lexical expressions (e.g., walkside instead of sidewalk), and L1 intrusions (e.g., ah mon Dieu les temps [du verbe] en plus “Oh my God [I need to consider verb] tenses too”), over the total number of words produced (see Swan, Reference Swan, Schmitt and McCarthy1997, for a discussion of errors due to lexical transfer).
3. Token frequency: defined as the total number of words produced (Laufer & Nation, Reference Laufer and Nation1995).
4. Type frequency: defined as the total number of unique words produced. Types and tokens were calculated separately using the online Vocabprofile program (Cobb, Reference Cobb2000).Footnote 4 Because type and token frequencies are sensitive to sample length, both measures were normalized by dividing the frequencies by the total duration of the sample. The resulting measures thus represented the frequencies of word tokens and types per unit of time.
Discourse.Because listeners may also rely on speakers’ storytelling strategies and may attend to the discourse structure of speakers’ narratives in making comprehensibility judgments (Thomson & Isaacs, 2010), three discourse-level measures were examined.
1. Story cohesion: defined as the number of adverbials used as cohesive devices (Martin & Rose, Reference Martin and Rose2003). These devices (e.g., suddenly, but, hopefully) help situate the story by establishing links between storytelling elements, propelling the storyline forward, or revealing the storyteller’s attitude. As with lexical variables, discourse measures are sensitive to sample length. Therefore, story cohesion and all other discourse measures were normalized by dividing the frequency by the total duration of the sample. The resulting measures are, thus, expressed per unit of time.
2. Story breadth: defined as the number of distinct propositions or storytelling elements used by a speaker. Propositions, which consist of a predicate (e.g., verb) and one or more arguments that relate back to the predicate (e.g., subject), were identified using Stein and Glenn’s (Reference Stein, Glenn and Freedle1979) scheme. Examples of categories of propositions include setting (e.g., the story is beginning in Manhattan), initiating event (e.g., I rush at the office this morning with my briefcase), attempt (e.g., so they banged into each other), direct consequence (e.g., they went to took their luggage but they took the wrong one), and reaction (e.g., the two person are confuse).
3. Story depth: defined as the number of different proposition categories used by a speaker (e.g., setting, attempt, reaction). A L2 speaker whose story dealt exclusively with the setting, for example, would receive a lower score on this measure than a speaker who briefly set the scene, then described the events and consequences.
Following initial coding by a trained coder, another trained coder recoded 40% of the speech samples for each of the 19 measures. Intraclass correlations for each measure were .90 of higher, with the exception of lexical error ratio (.85), revealing high intercoder agreement.
PHASE ONE: QUANTITATIVE DATA
The goal of the first phase was to answer the first research question by examining which of the 19 speech measures were most strongly related to raters’ L2 comprehensibility judgments.
Method
Raters and Rating Procedure.Second language comprehensibility judgments were obtained from 60 raters. The raters were native English-speaking undergraduate students (26 male, 34 female) majoring in different nonlinguistic disciplines (e.g., physiology, music, sociology, biochemistry) at an English-medium university in Montreal, Canada. The raters (M age = 20.7, range = 19–25) reported growing up in monolingual homes in Canada (n = 29) and the United States (n = 31), estimated speaking and listening to English more than 90% of the time daily, and rated their French (L2) speaking and listening ability at a low-intermediate level (M = 3.4) on a 9-point scale (1 = extremely poor, 9 = extremely proficient). All raters reported having normal hearing. Because the raters lacked L2 teaching experience and specialized language training, they were considered novice raters.
Speech samples were presented to individual raters in a quiet room via a Koss R/80 headset connected to a computer. After familiarizing themselves with the picture prompt, raters listened to each picture story in randomized order and assigned comprehensibility scores on a 9-point numerical scale (1 = hard to understand, 9 = easy to understand).Footnote 5 Although raters were permitted multiple listenings, none showed evidence of lingering on a particular speech sample.
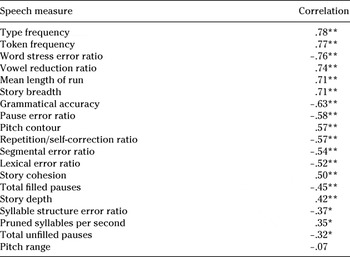
Results. Intraclass correlations were calculated first to examine whether the novice raters were internally consistent in their ratings. A coefficient of .99 suggested that this was indeed the case. Pearson correlations were then computed to examine the strength of the relationship between mean L2 comprehensibility ratings, averaged for each speaker across the 60 raters, and the 19 analyzed speech measures. Table 1 shows that strong correlations (r > .70) were found for several measures in each of the conceptual categories of phonology (e.g., word stress error ratio, vowel reduction ratio), fluency (MLR), linguistic resources (type frequency, token frequency), and discourse (story breadth). Moderate correlations (r > .40) were revealed for 9 of the 13 remaining measures, and only 1 measure showed no relationship with comprehensibility (pitch range).Footnote 6 This suggests that L2 comprehensibility ratings are related to a wide range of variables that clearly are not restricted to the domains of phonology and fluency.
Pearson correlation coefficients between L2 speech measures and 60 novice raters’ scalar judgments of L2 comprehensibility

* p < .05.
** p < .01, two-tailed.
PHASE TWO: QUALITATIVE DATA
The goal of the second phase of the study was to answer the second research question by generating listener input on the aspects of L2 speech that they consider when judging comprehensibility. Using rater perceptions was necessary to ensure that the eventual comprehensibility rating guidelines reflect not only the most statistically robust measures but also the most salient criteria that the intended users of the scale (i.e., raters and especially teachers) attend to when making comprehensibility-level distinctions. Data triangulation using different but complementary data sources was needed to shed light on the complex phenomenon of interest (i.e., the factors that feed into listener perceptions of comprehensibility), with qualitative data used to support quantitative findings.
Method
Teachers. Following previous research that has drawn on experienced teachers’ perspectives in the development and validation of rating scales (e.g., North, Reference North2000; Upshur & Turner, Reference Upshur and Turner1999), three native English-speaking ESL teachers (1 male, 2 female) with 10–12 years of classroom experience were consulted. Originally from Western Canada, the teachers had moved to Montreal as adults and had resided there for 8–24 years. All teachers were teaching Francophone learners of English at the time of the study but estimated speaking and listening to French less than 20% of the time. They had all taken graduate-level courses on teaching English as a second language (TESL); however, none had received training in L2 assessment or phonetics or phonology. Nonetheless, they were charged with classroom assessment responsibilities and came from a population that could benefit from an eventual formative assessment tool for L2 comprehensibility.
An additional reason for examining experienced teachers’ impressions of L2 comprehensibility is that a previous study (Isaacs & Thomson, 2009) suggested that teacher raters were better able to articulate linguistic influences on their judgments in the absence of rating guidelines than novice raters, who tended to describe only a small set of default features in learners’ speech (e.g., pausing, speech rate). Therefore, it was thought that experienced teachers would be more able to identify a fuller range of aspects of speech that they consider when scoring comprehensibility than novice raters, who may have less clearly developed internal criteria for L2 oral assessments or may lack the vocabulary for expressing their thoughts.
Ratings and Teacher Reports. The teachers were probed about their impressions of the speech and the influences on their ratings in individual sessions that did not exceed 2 hr. They first familiarized themselves with the picture sequence and completed two sample ratings. They then listened to the 40 speech samples in randomized order using a Koss R/80 headset. To provide initial standardization, comprehensibility was defined as “how easy the speaker is to understand.” When the teachers were ready to score each speech sample, following multiple listenings if necessary (although all proceeded at a steady pace), they paused the recording and typed their comprehensibility rating into a preformatted word processing document using the 9-point comprehensibility scale described previously. Below each scale, the teachers then related the aspects of the speech that they attended to when scoring. These written accounts are henceforth referred to as teacher reports. At the end of the session, the teachers summarized their listening and rating experience in a follow-up questionnaire. They were specifically asked whether they had interpreted comprehensibility to mean comprehensibility of the individual words or comprehensibility of the story or message, or whether they had adopted a different interpretation.
Results.The multiple sources of teacher data were initially analyzed separately and then combined to strengthen the interpretation of the findings. The rating data were first submitted to intraclass correlations to examine scoring consistency. Teacher reports for each speech sample were coded as a function of L2 comprehensibility level. Finally, teachers’ questionnaire comments about their interpretation of comprehensibility were used to clarify other sources of evidence.
Intraclass correlations. The intraclass correlations for comprehensibility scores assigned by the three ESL teachers (henceforth, T1, T2, and T3) showed relatively high agreement between T1 and T2 (.81). However, the agreement between each of these teachers and T3 was lower (.62 and .66, respectively); that is, a poorer scoring consensus was revealed when T3 was involved. At least some of this divergence may be reflected in differences in teachers’ understanding of the construct being measured. Whereas T1 and T2 interpreted comprehensibility as the listener’s ability to understand the L2 speaker’s story or message, T3’s interpretation centered on the listener’s ability to decipher the speaker’s individual words. These differing perspectives suggest that comprehensibility may need to be defined more precisely in L2 research and assessment contexts than simply ease of understanding to support a more unitary interpretation for construct validity reasons. This supports the premise of the study that comprehensibility, as defined here, is amenable to multiple listener interpretations in the absence of further clarification of what “speech that is easy or difficult to understand” means.
Intraclass correlations between T1, T2, and T3 and pooled L2 comprehensibility ratings of the 60 novice raters yielded coefficients of .90, .88, and .80, respectively, which suggested that ratings pooled over a large group tend to average out individual raters’ idiosyncrasies. Because the novice raters, compared to the teachers, showed a higher degree of concordance in their ratings, the 40 L2 speakers were rank ordered by the novice raters’ mean comprehensibility scores. The speakers were then classified into low (n = 13), intermediate (n = 13), and high (n = 14) comprehensibility groups on the basis of a three-way split, so that the aspects of the speech that the teachers considered in their ratings could be examined as a function of comprehensibility level.
Analysis of teacher reports. For the analysis of teacher reports (i.e., descriptions of the aspects of speech that most influenced teachers’ comprehensibility judgments), a 10-category coding scheme was developed, with the 19 measures from the previous phase serving as the starting point. The challenge was to develop categories that were narrow enough to meaningfully distinguish between different comprehensibility levels, but not so fine grained that it would be difficult for another coder to consistently apply the categories. For example, the overlapping categories of L1 intrusions, L1-influenced lexical items, and odd lexical choice, which were conceptually linked with the error types examined under the quantitative speech measure lexical error ratio, were initially coded separately but later merged under the broad category of vocabulary. Following initial coding, 40% of the data were recoded by a second coder blind to the purposes of the study. Exact agreement was obtained for 95% of the observations, which indicated high intercoder agreement. In instances in which the coding was inconsistent, consensus was achieved through discussion.
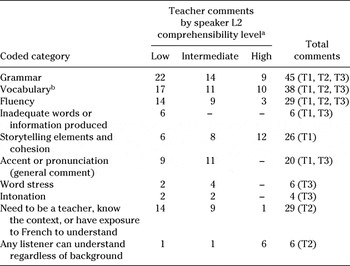
Frequencies of the coded categories by speaker comprehensibility level are shown in Table 2. Although each teacher emphasized different aspects of speech, taken together, coverage of the overarching conceptual categories used to group the quantitative speech measures (phonology, fluency, linguistic resources, discourse) was achieved. All three teachers commented on the coded categories of grammar, vocabulary, and fluency (see the first three rows in Table 2). The trend was that the number of comments for these categories was highest for the low-comprehensibility group and decreased at each subsequent level—although in the case of vocabulary there appeared to be a leveling off between intermediate- and high-level groups.
Frequency of coded categories from teacher reports grouped by L2 speaker comprehensibility level

a Comprehensibility-level categorizations are based on a three-way split according to novice raters’ mean scores.
b Errors in pronoun and preposition choice were coded as grammar rather than vocabulary.
Grammar was the category with the highest number of observations overall. Most comments tended to be generic, although T1 and T2 pinpointed verb tense errors and, less frequently, pronoun and preposition errors in low- and intermediate-level speakers. Of the nine coded grammar comments at the high-comprehensibility level, seven were either positive or, in T3’s words, revealed “no grammar errors to distract,” in contrast to the lower levels, in which T3 often explicitly identified grammar as contributing to comprehension difficulties, along with other aspects of speech. The vocabulary category, which had the second-highest number of net observations, encompassed instances of imprecise or L1-influenced vocabulary, odd lexical choice (e.g., holding instead of carrying a suitcase), the use of phonetically similar but semantically inappropriate words (e.g., crushed for crashed), and in the case of low-comprehensibility learners only, French L1 intrusions. In a similar manner, within the fluency category, teachers commented on pauses, hesitations, repeated words, self-corrections, and pacing (e.g., representative comments included “pace was slow,” “lack of fluidity,” “hesitations, corrections and repetition also delay understanding of message,” etc.). These comments appeared to have counterparts in the analyzed quantitative speech measures. Reference to segmental errors, on the contrary, was conspicuously absent from all teacher reports—although T3 referred to “accent” and “pronunciation” in broad terms for low- and intermediate-level speakers.
There was less consistency across the teachers in other coded categories. For example, only T1 referred to discourse measures. Comments about storytelling elements and cohesion were pooled together due to their co-occurrence in T1’s remarks (e.g., “no continuity to the story,” “random images with no glue”). For speakers in the low-comprehensibility group, T1 often reported having “no idea what the story was about.” Conversely, speakers at the high end of the spectrum evoked either positive comments (e.g., “good description of the weather and details of the first scene”) or comments about the lack of story details (e.g., “doesn’t give enough detail where needed like mentioning the people on the sidewalk”). Teacher 3 was also the only teacher to mention “syllable/word stress” and “intonation,” although no examples of this were provided. In fact, her strategy was to construct her own basic descriptor and then slightly modify it for the individual L2 speaker being rated. For 7 low- and 9 intermediate-level speakers, her description followed the formula “(relatively) easy to understand in terms of pronunciation,” with a list of criteria that “(slightly) contributed to difficulties in comprehensibility,” depending on which were applicable (grammar, hesitation, intonation, etc.). In contrast, all high-comprehensibility speakers were either “perfectly” or “completely comprehensible” in her view.
Teacher 2 was also distinct from the other teachers, specifically in her overall orientation to rating. Her interpretation of comprehensibility strongly revolved around her assumption that listeners’ knowledge of the context (i.e., picture story content), familiarity with the speakers’ L1 (French), and ESL teaching experience would likely facilitate their ability to understand the speech, whereas listeners without recourse to these factors may not be able to compensate for gaps in their understanding. The frequency counts of T2’s comments in the bottom two rows of Table 2 show that the listener’s knowledge of context, exposure to the speaker’s L1, and ESL teacher status are most important for understanding low-comprehensibility speakers. However, these factors steadily decrease in importance as comprehensibility level increases until the highest level, when any listener can understand the L2 speech regardless of their background or knowledge of context.
Taken together, these results suggest that experienced listeners draw on several factors when judging L2 comprehensibility. These factors include aspects of grammar, vocabulary, and fluency in L2 speech and, at least for some listeners, word stress, discourse structure of the speaker’s narratives, and the availability of context and familiarity with the speaker’s L1.
PHASE THREE: GENERATING L2 COMPREHENSIBILITY GUIDELINES
The goal of the final phase was to address the third research question by identifying the speech measures that distinguish between three levels of L2 comprehensibility and to articulate several L2 comprehensibility scale guidelines that could be useful for L2 teaching and learning.
Selecting Measures
Of the 19 speech measures analyzed here, 18 significantly correlated with mean L2 comprehensibility ratings (Table 1). However, it was not feasible to include all these criteria in the rating descriptors, as it would not be practical for raters (or classroom teachers) to consult a long list of features when assessing L2 comprehensibility. Thus, for the purposes of developing user-friendly rating scale guidelines, the selected measures only included those that were both most closely related to the scores listeners assigned and that were also most salient to them. Therefore, two criteria were applied to reduce the number of measures to be included in the scale guidelines. The first (quantitative) criterion was that the correlations between the novice raters’ L2 comprehensibility ratings and the speech measures from the quantitative phase needed to exceed .70, given that this value conventionally designates strong associations (Brace, Kemp, & Snelgar, Reference Brace, Kemp and Snelgar2006). The second (qualitative) criterion was that the selected measures needed to have some conceptual link with a coded category in the teacher reports. Again, because teachers are the target audience for the scale guidelines, it was necessary to build their perceptions of salience into scale development for reasons of ecological validity. In lieu of letting numbers drive the data, teacher input on the criteria that they heeded when making their judgments was used to support the quantitative findings.
On the basis of the first criterion, five measures were retained: (a) type frequency, (b) word stress error ratio, (c) vowel reduction ratio, (d) MLR, and (e) story breadth (Table 1). Token frequency was discarded due to its high correlation with type frequency (r = .96), which suggests that the two frequency counts were not independent. On the basis of the second criterion, vowel reduction ratio was excluded because the teachers did not comment on this variable. The remaining four measures were all featured in the teacher reports. There was some correspondence between type frequency and the coded categories of both vocabulary and inadequate words produced; between word stress error ratio and word stress; between MLR and fluency; and, finally, between story breadth and storytelling elements and cohesion (see Tables 1 and 2).
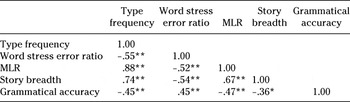
One intriguing finding was that grammatical accuracy, which was the first variable below the cutoff in the quantitative analysis (r = −.63), showed the clearest pattern in the teacher reports. All three teachers commented on grammar: It came up more frequently than any other coded category, and the overall pattern was clear in that the lower the comprehensibility level, the more grammar comments were made. Because grammar was important from the perspective of all three teachers, this measure was retained. Five measures were therefore finalized for inclusion in the comprehensibility scale guidelines: (a) type frequency, (b) word stress error ratio, (c) MLR, (d) story breadth, and (e) grammatical accuracy.Footnote 7 The intercorrelations between these measures are shown in Table 3.Footnote 8
Pearson correlation coefficients between the speech measures selected for inclusion in the rating scale

* p < .05.
** p < .01, two-tailed.
Distinguishing between L2 Comprehensibility Levels
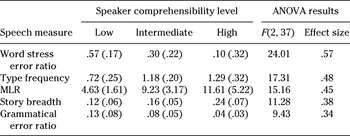
To examine whether the retained speech measures could distinguish between L2 speakers rated at low-, intermediate-, and high-comprehensibility levels, five separate ANOVAs were conducted, with comprehensibility level (low, intermediate, high) as the grouping factor and each of the retained speech measures as the dependent variable (Bonferroni corrected α = .01). Table 4 shows that the means for all variables increased as L2 comprehensibility level increased, with the exception of the word stress and grammatical error measures, in which error rates decreased as comprehensibility level increased (p < .0001). ANOVA statistics (also shown in Table 4) indicate that a medium-to-strong effect size was yielded for all measures (η2 = .34–.57). The MLR and grammatical error results should be interpreted with caution, however, due to a violation of the assumption of homogeneity of variance.
Mean scores (standard deviations) for the selected speech measures grouped by L2 speaker comprehensibility level and results of one-way ANOVAs

Note
Speaker comprehensibility levels are based on the 60 novice raters’ scalar judgments of L2 comprehensibility. Effect sizes are eta squared. All F values are significant at p < .0001.
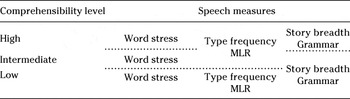
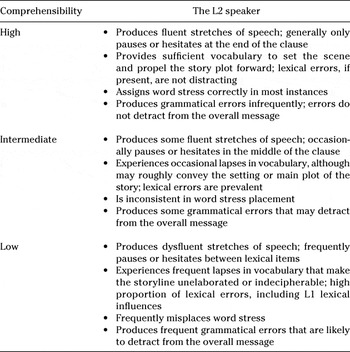
The data were then submitted to Tukey HSD post hoc tests to determine which of the three comprehensibility levels were different from one another for each L2 speech measure (α = .05). Word stress, the measure with the largest effect size, distinguished between all three groups of L2 speakers. Significant differences between two of the three groups were found for the remaining four measures. Type frequency and MLR significantly distinguished between low- and intermediate-level speakers, whereas grammatical accuracy and story breadth significantly distinguished between the high and intermediate groups. This suggests that a certain threshold of fluency and lexical diversity may be a useful criterion for distinguishing speakers at the low end of the comprehensibility continuum. Few grammatical errors and a large number of storytelling elements, on the contrary, may describe speakers at the high end of the continuum. The overall level distinctions based on these comparisons are summarized in Table 5. These significant level distinctions formed the basis for the L2 comprehensibility scale guidelines shown in Table 6.
Speech measures that distinguish between three levels of L2 comprehensibility

Note
The dotted lines separate the speech measures that significantly distinguish between the L2 speakers’ comprehensibility levels (according to Tukey HSD post hoc tests).
Suggested guidelines for L2 comprehensibility scale development

DISCUSSION
Comprehensibility-Level Distinctions
The goal of this study was to examine the linguistic factors that most greatly influence raters’ comprehensibility judgments at low, intermediate, and high levels of L2 comprehensibility and to feature these criteria in comprehensibility rating scale guidelines. Overall, comprehensibility, which to date has been mostly investigated in L2 pronunciation and fluency studies (e.g., Derwing et al., Reference Derwing, Rossiter, Munro and Thomson2004), appears to be broader in its scope than previously thought. Story breadth, for example, which was strongly correlated with L2 comprehensibility ratings, relates to both discourse organization (e.g., the use of cohesive devices) and pragmatic skills (e.g., identification of the story’s referent; see de Villiers, Reference de Villiers2004). This measure is likely specific to the particular picture-based narrative task used here and may not be relevant for word- or sentence-level tasks (Kennedy, Reference Kennedy and Benati2009). Nonetheless, the finding that story breadth is related to L2 comprehensibility suggests that a wide range of measures feeds into listeners’ comprehensibility ratings.
Five speech measures were represented in the comprehensibility guidelines, with coverage from all four conceptual categories of phonology, fluency, linguistic resources, and discourse. Two measures (type frequency and MLR) distinguished between learners at the low end of the comprehensibility continuum. It may be that a certain threshold of lexical richness and fluency is required for learners to receive mid- to upper-range comprehensibility scores. Learners confined to the lowest comprehensibility level may not be able to retrieve lexical items efficiently, which could impede their ability to produce fluent stretches of speech and to convey a story in a short timeframe (Segalowitz, Reference Segalowitz2010). At the opposite end of the spectrum, the higher-order skills of grammar and discourse organization (grammatical accuracy and story breadth) distinguished between only high-level learners. Evidence from the teacher reports showed that grammar errors tended to distract listeners less as comprehensibility level increased. Likewise, T1’s comments about the storyline were more frequent at the highest level, which indicated that discourse organization mattered most for high-comprehensibility learners.
The word stress measure distinguished most strongly between the three comprehensibility levels in this study. Word stress is not contrastive (nonphonemic) in French, and Francophone learners often have difficulty perceiving L2 stress contrasts (e.g., Peperkamp & Dupoux, Reference Peperkamp, Dupoux, Gussenhoven and Warner2002), which may also lead to production difficulties. First language effects, therefore, likely come into play with word stress—and possibly vowel reduction (i.e., rhythm)—as suggested by a significant association between these measures (r = −.62). Both capture the speaker’s ability to emphasize stressed syllables and reduce unstressed ones. It is possible that word stress, as a measure distinguishing most clearly between Francophone learners at different levels of L2 comprehensibility, is specific to these participants. However, judging from the sheer number of learners from other L1 backgrounds for whom English word stress (and rhythm) generally pose a problem (e.g., Spanish, Polish), English stress patterns could be a much more global feature in distinguishing between different L2 comprehensibility levels (see Swan & Smith, Reference Swan and Smith2001).
The robustness of the relationship between comprehensibility and word stress in this study throws into question the lack of emphasis on this and other suprasegmental aspects of L2 speech in Jenkins’s (Reference Jenkins2000, Reference Jenkins2002) lingua franca core. This pronunciation syllabus—based on observational research on communication breakdowns between nonnative dyads—comprises a list of instructional targets to be emphasized in a new, international variety of English. It is important to note that the L1 listeners in the present study are different from the nonnative interlocutors in Jenkins’s work, and the speaking task here is nonreciprocal. Previous research, however, suggests that displaced stress patterns do interfere with listener understanding (Field, Reference Field2005; Hahn, Reference Hahn2004; Zielinski, Reference Zielinski2008) and argues for the importance of word stress for L2 comprehensibility.
In the present study, there was a link between word stress and story breadth (see Table 3), such that more word stress errors were associated with fewer propositions produced. One possible explanation for this association is that word stress (and rhythm) issues create a bottleneck at the phonological encoding and articulation stage of speech production (Levelt, Reference Levelt1989; Segalowitz, Reference Segalowitz2010). The resulting slowdown is captured in temporal measures such as MLR and adversely affects comprehensibility. Learners may not have trouble with the message itself; they know what story elements need to be said (indeed, the images tell a clear story). Rather, learners struggle with packaging these story elements into appropriate words, and their inability to produce appropriate stress may be a contributing factor. It is clear that the relationship between these variables and comprehensibility would benefit from further empirical work.
Segmental error ratio, the tenth most strongly correlated variable with the mean L2 comprehensibility ratings, was not referred to in the teacher reports or included in the comprehensibility scale guidelines. The −.54 correlation, however, suggests that segmental errors do bear a statistical relationship with listeners’ L2 comprehensibility ratings and should not be discounted. One possibility is that segmental errors did not detract from comprehensibility for the Francophone speakers in this study. A segmental error effect would likely have been stronger had the examined speech samples been from a L1 group that tends to have greater segmental difficulties (e.g., L1 Vietnamese speakers). The measures examined in this study may not have been sensitive enough to capture segmental errors leading to comprehension difficulties. Munro and Derwing (Reference Munro and Derwing2006), for example, showed that errors involving consonants with a high functional load—that is, those that distinguish many lexical items such as /l/ versus /r/ in English—have a strong effect on comprehensibility, whereas low functional load errors (e.g., /θ/ vs. /ð/) have only a minimal effect. Thus, future research could take a more nuanced approach to examining the impact of segments on L2 comprehensibility. This could be achieved by focusing only on high functional load errors or by zooming in on listeners’ reports of communication breakdowns to probe whether segmental errors are involved (Zielinski, Reference Zielinski2008).
Teachers’ Interpretations of Comprehensibility: What Is the Construct?
The goal of this study was to probe the factors that feed into listeners’ perceptions of comprehensibility. The ESL teachers differed both in their interpretations of comprehensibility and in the criteria they found most salient while scoring. Teacher 1 commented on storytelling elements and cohesion, whereas T2 indicated that L1 familiarity, L2 teacher status, and contextual support were necessary for listener understanding of the message. Finally, T3 drafted a formulaic descriptor, which listed the aspects of speech that had compromised her understanding of words, and was alone in citing word stress and intonation as problematic. It is clear that defining comprehensibility as ease of understanding leaves much leeway for interpretation and gives raters considerable freedom in choosing the speech characteristics to consider. Therefore, raters in both research and assessment contexts would benefit from more direction on how ease of understanding is to be interpreted.
In the present study, it was not feasible to accommodate both a word-level and a story-based definition of comprehensibility in the rating scale guidelines because these entail different units of measurement (e.g., understanding words vs. longer texts), reflect different speaking tasks (e.g., reading out sentences vs. narrating a story), and likely involve a different set of measures contributing to comprehensibility. Ultimately, the inclusion of story breadth (which refers to the number of different propositions or story elements produced) as a criterion in the rating scale guidelines necessitated a story-based interpretation of comprehensibility. Some raters within the larger group of novice raters may have adopted a word-level definition of comprehensibility, like T3. A larger sample of introspective reports is needed to reveal whether T3’s word-based interpretation of comprehensibility is, in fact, prevalent in other raters. Regardless, when the novice raters’ judgments were pooled and the teachers’ comments were analyzed, the overall consensus was that the speaker’s ability to convey the events of the story was a factor to consider when assigning comprehensibility scores.Footnote 9
Implications and Future Research
Although it is widely agreed that the goal of L2 pronunciation instruction should be to help learners be understandable to their interlocutors, classroom teachers have received little guidance on the pronunciation features to prioritize in instruction (Derwing & Munro, Reference Derwing and Munro2009). Although not directly intended to inform instructional targets, the rating scale guidelines presented here do point to the aspects of speech that listeners attend to when judging L2 comprehensibility. For example, teaching Francophone learners to be more comprehensible involves not only specific pronunciation features (e.g., word stress) but also a wider array of language skills (e.g., vocabulary, discourse organization). Overall, the rating scale guidelines presented in this study are intended as a preliminary step toward the development of a formative assessment instrument. Such a tool could interweave classroom-based oral assessment, including the assessment of pronunciation, with L2 teaching, learning, and curricular objectives (Colby-Kelly & Turner, Reference Colby-Kelly and Turner2007). Most of all, teachers would clearly benefit from a greater understanding of what is meant by the umbrella term comprehensibility. An empirically substantiated instrument, which features the most salient criteria that influence listeners’ impressions of what they are able to understand, could help L2 teachers convey this information to their students and monitor their learning.
Because the teacher raters who participated in this study instruct students from essentially the same population of learners as the Francophone speakers who provided speech samples, factoring teachers’ decisions into the rating scale enhances its ecological validity. What is unclear is whether the linguistic aspects included in the scale are specific to Francophones or can be generalized to learners from other backgrounds. It is therefore important to validate the scale for different learner groups (e.g., different L1s and proficiency levels) and for different task types (e.g., monologic, dialogic). It is also important to seek additional input from various rater groups with whom L2 speakers are likely to interact (e.g., ESL teachers, prospective co-workers). Because comprehensibility is frequently invoked in high-stakes assessment instruments (e.g., TOEFL) and is important for successful communication, there is a great need to develop a better understanding of comprehensibility and how it relates to overall oral proficiency (Isaacs, in press). Investigations of the effects of systematic sources of variance on rating outcomes could reveal which of the criteria included in the comprehensibility scale guidelines are stable and generalize to other contexts, and which tend to be local and fluctuate across contexts (Chalhoub-Deville, Reference Chalhoub-Deville1995).
CONCLUSION
One shortcoming of existing L2 oral proficiency scales is that comprehensibility and accentedness are often conflated in descriptors, even though previous research has shown them to be partially independent dimensions (Derwing & Munro, Reference Derwing and Munro2009). Levis (Reference Levis2005) points out that the principle that L2 learners should simply strive to be understandable to their interlocutors is fundamentally incompatible with the idea that L2 learners should aim to acquire a nativelike accent and eradicate all traces of their L1. Rating scales need to reflect this reality. A research priority, therefore, should be to isolate the aspects of L2 speech that impede comprehensibility from those that—although noticeable or irritating—do not detract from listeners’ understanding of the message (Munro, Reference Munro, Hansen Edwards and Zampini2008). A recent study by Isaacs and Trofimovich (Reference Isaacs and Trofimovich2011), for example, suggests that university-trained musicians are more sensitive to certain aspects of L2 speech than nonmusicians, with the consequence that musicians tend to more clearly differentiate between accentedness and comprehensibility than listeners who are less musically sensitive. Enlisting the perspectives of musically sensitive raters could, therefore, help tease apart these overlapping constructs. Once this has been accomplished, comprehensibility can be described in rating scales with greater precision, and reference to accent or nativelikeness can be left aside.