Introduction
As children acquire language, they learn about different sources of linguistic information relevant for speech processing. The primary source for spoken language is the auditory signal, which is available even before the infant is born (Granier-Deferre, Bassereau, Ribeiro, Jacquet & DeCasper, Reference Granier-Deferre, Bassereau, Ribeiro, Jacquet and DeCasper2011), and most language development research focuses on how learners use acoustic cues for speech processing. However, listeners use more than just acoustics to process speech, such as using visual cues from speakers’ articulations. For example, visual cues can improve speech intelligibility with adults, especially in noisy contexts (Sumby & Pollack, Reference Sumby and Pollack1954). Previous landmark studies, such as McGurk and MacDonald (Reference McGurk and MacDonald1976), demonstrate that visual speech information is used concurrently with auditory information, or even used in the complete or partial absence of auditory speech (Buchwald, Winters & Pisoni, Reference Buchwald, Winters and Pisoni2009; Calvert, Bullmore, Brammer, Campbell, Williams, McGuire, Woodruff, Iversen & David, Reference Calvert, Bullmore, Brammer, Campbell, Williams, McGuire, Woodruff, Iversen and David1997).
Although visual speech processing begins in infancy and continues into childhood, much remains unknown about its development. Much of the research on visual speech integration uses stimuli consisting of incongruent auditory and visual syllables, often in adverse listening conditions, and shows that the integration of visual input increases with age (Hirst, Stacey, Cragg, Stacey & Allen, Reference Hirst, Stacey, Cragg, Stacey and Allen2018; Massaro, Reference Massaro1984; Massaro, Thompson, Barron & Laren, Reference Massaro, Thompson, Barron and Laren1986). However, the aim in using such methodologies is not to determine how visual and auditory cues are integrated during natural speech processing (Alsius, Paré & Munhall, Reference Alsius, Paré and Munhall2017); moreover, they do not provide evidence for whether visual speech contributes directly to lexical activation. We investigated how children (and adults) use auditory and visual cues to identify a lexical referent. Participants were first presented with a speaker producing target words (/b/-initial or /k/-initial) in audio-visual (AV), audio-only (A-only), or visual-only (V-only) modalities. This was followed by a preferential-looking task with target and distractor images and looking to the lexical referent was measured. Based on prior work, we predicted children and adults would be able to use the AV and A-only speech modalities to identify the target image. However, we expected that, while adults would be able to identify lexical referents in the V-only modality, children’s use of V-only cues to identify image targets would improve throughout development.
Visual speech in early development
Many studies document infants’ sensitivity to visual speech information, but variations in methodologies and stimuli make it challenging to synthesize how infants use visual speech cues for language processing (Shaw & Bortfeld, Reference Shaw and Bortfeld2015). For example, studies have examined how infants match vowel sounds to the corresponding visual articulation (Kuhl & Meltzoff, Reference Kuhl and Meltzoff1982; Patterson & Werker, Reference Patterson and Werker2003; Yeung & Werker, Reference Yeung and Werker2013); how infants integrate visual speech cues with other auditory processes (Kushnerenko, Teinonen, Volein & Csibra, Reference Kushnerenko, Teinonen, Volein and Csibra2008; Teinonen, Aslin, Alku & Csibra, Reference Teinonen, Aslin, Alku and Csibra2008); how infants develop language-specific knowledge of visual cues (e.g, Danielson, Bruderer, Kandhadai, Vatikiotis-Bateson & Werker, Reference Danielson, Bruderer, Kandhadai, Vatikiotis-Bateson and Werker2017; Pons, Lewkowicz, Soto-Faraco & Sebastián-Gallés, Reference Pons, Lewkowicz, Soto-Faraco and Sebastián-Gallés2009); and how infants attend to linguistic cues in the mouth of a talking face (Lewkowicz & Hansen-Tift, Reference Lewkowicz and Hansen-Tift2012; Morin-Lessard, Poulin-Dubois, Segalowitz & Byers-Heinlein, Reference Morin-Lessard, Poulin-Dubois, Segalowitz and Byers-Heinlein2019; Pons, Bosch & Lewkowicz, Reference Pons, Bosch and Lewkowicz2019; Tenenbaum, Shah, Sobel, Malle & Morgan, Reference Tenenbaum, Shah, Sobel, Malle and Morgan2013). Infants attend to temporal aspects of visual speech cues starting from the first year of life, but it is not until older ages that they use visual speech cues for higher linguistic processing (Lalonde & Werner, Reference Lalonde and Werner2021). Nevertheless, it is hard to synthesize the research findings from infants and children given differences in methodological approaches and stimuli (Lalonde & Holt, Reference Lalonde and Holt2015). For example, Weatherhead and White (Reference Weatherhead and White2017) found that visual information influenced word recognition in a looking task with 12-month-old infants. This finding seems discontinuous with work showing that above chance performance on a lip-reading task only emerges around 5 to 7 years of age (Knowland, Evans, Snell & Rosen, Reference Knowland, Evans, Snell and Rosen2016; Kyle, Campbell, Mohammed, Coleman & MacSweeney, Reference Kyle, Campbell, Mohammed, Coleman and MacSweeney2013).
Our current study deepens the examination of visual speech processing across development by asking when V-only speech cues can be used for word recognition in children 2 to 8 years of age. Below, we review prior work with children that examines the relationship between visual speech and word recognition. While many studies have compared AV and A-only conditions, we place an emphasis on studies that included V-only conditions, and our review shows that task differences dominate the literature on children’s use of visual speech.
Visual speech in later development
One of the initial studies investigating visual speech cues during lexical access used a primed picture-naming task (Jerger, Damian, Spence, Tye-Murray & Abdi, Reference Jerger, Damian, Spence, Tye-Murray and Abdi2009). Primes were presented in either AV or A-only modalities and simultaneously with targets (images to be named). Naming latencies for targets varied by a number of factors, including modality, with a U-shaped effect for congruent primes, e.g., when the auditory distractor (peach) shared the onset with the target image (pizza). This modality effect showed that 4-year-olds as well as 10- to 14-year-olds had shorter naming latencies in the AV congruent prime condition compared to the A-only congruent condition, suggesting that visual information improved lexical recognition. Yet, children 5- to 9-years-old showed no difference, possibly related to their learning of reading and writing, which may cause a reorganization of phonological representations, manifesting in difficulty with visual aspects of speech.
In subsequent work, Jerger and colleagues showed that task differences are also responsible for some of the observed developmental variation by using a different visual speech methodology: auditory onsets were removed (e.g., auditory /b/ removed from bag) and participants were measured on the restoration of onsets from visual information (a speaker producing intact bag) (Jerger, Damian, Tye-Murray & Abdi, Reference Jerger, Damian, Tye-Murray and Abdi2014, Reference Jerger, Damian, Tye-Murray and Abdi2017). In contrast to previous reports showing U-shaped development, children aged 4 to 14 years showed a uniform increase in sensitivity to visual speech effects (also associated with vocabulary size). This methodology was also used to compare performance on discrimination versus identification tasks (Jerger, Damian, McAlpine & Abdi, Reference Jerger, Damian, McAlpine and Abdi2018). Again, there was continuous improvement from 4 to 14 years of age for visual speech (for easy to recognize [b], but not for hard to recognize [ɡ]), which was further associated with vocabulary skills. However, performance changed differently on the two tasks: discrimination abilities grew more linearly, while identification development grew sharply, then slowed after 7 years.
The issue of task complexity was further addressed by Lalonde and Holt (Reference Lalonde and Holt2015), who tested children aged 3 to 4 years and adults on three different tasks: AV speech matching, discrimination and recognition tasks. Overall, they found that 3- and 4-year-olds were able to use visual cues on discrimination and recognition measures; however, only 4-year-olds showed (some) knowledge of visual cues for higher level processing (based on secondary analyses of substitution errors which indicated knowledge of how visual cues map to phonemes). In a follow-up study with children aged 6 to 8 years using modified tasks, Lalonde and Holt (Reference Lalonde and Holt2016) found that older children did not use visual cues in higher-level, speech-specific processing as seen with adults. Similar differences were found using a consonant phoneme monitoring task presented in an AV or A-only modality, with adults (Fort, Spinelli, Savariaux & Kandel, Reference Fort, Spinelli, Savariaux and Kandel2010), and with children 6 years to 10 years of age (Fort, Spinelli, Savariaux & Kandel, Reference Fort, Spinelli, Savariaux and Kandel2012). All age groups were faster on words compared to non-words, indicating a lexicality effect, but only adults showed a stronger lexical bias effect in AV trials. Together, this work converges on the idea that visual speech does not aid lexical access for children the same way as for adults.
A variety of other tasks also show developmental variability in children’s use of visual cues for speech processing. Similar to the current study, the Test of Child Speechreading presents videos of a single word produced in silent visual speech, followed by a forced-choice task between 4 images. Children perform above chance starting around 5 to 7 years (Knowland et al., Reference Knowland, Evans, Snell and Rosen2016; Kyle et al., Reference Kyle, Campbell, Mohammed, Coleman and MacSweeney2013). In a normative study, Hnath-Chisolm, Laipply and Boothroyd (Reference Hnath-Chisolm, Laipply and Boothroyd1998) reported on AV, A-only and V-only perception of syllable contrasts in children between 5 to 11 years. Lipreading (V-only) improved with age, with above chance performance on only a subset of contrasts, dependent on word position. Other open-ended measures of lipreading show protracted development, including tests that measure the accuracy of identifying a visual word in a carrier phrase, e.g., “Say the word _____” (Tye-Murray, Hale, Spehar, Myerson & Sommers, Reference Tye-Murray, Hale, Spehar, Myerson and Sommers2014). Children improved between the ages of 7 to 14 years, but overall performance was not very accurate, echoing performance in similarly challenging tasks (i.e., repeating or identifying a silently produced word), where both children and adults cannot accurately identify words out of context (Ross, Molholm, Blanco, Gomez-Ramirez, Saint-Amour & Foxe, Reference Ross, Molholm, Blanco, Gomez‐Ramirez, Saint‐Amour and Foxe2011). Task differences are also seen in Kaganovich, Schumaker and Rowland (Reference Kaganovich, Schumaker and Rowland2016). When participants saw familiar images being named, followed by a matching or mismatching silent visual articulation, 7- to 13-year-olds were above 90% accurate; but, on a task of silent lipreading, the same children were below or at chance.
The current study
In summary, the development of visual speech processing shows mixed results, which stems in part from task and stimulus demands. In less cognitively demanding tasks at younger ages, visual speech appears to contribute to lexical processing in infancy (Weatherhead & White, Reference Weatherhead and White2017) and toddlerhood (Havy & Zesiger, Reference Havy and Zesiger2017, Reference Havy and Zesiger2020). However, when older children are tested on methodologies that require explicit behavioural responses, results are mixed. Even by 6 to 10 years, children do not have adult-like abilities to use visual-speech cues for high-level processing and lexical access (Fort et al., Reference Fort, Spinelli, Savariaux and Kandel2010). Sensitivity to visual speech cues is also shown to develop slowly in studies using a visual speech fill-in methodology and primed picture-naming tasks (Jerger et al., Reference Jerger, Damian, Tye-Murray and Abdi2014, Reference Jerger, Damian, Tye-Murray and Abdi2017), and in measures of children’s lipreading abilities using forced-choice tasks, with stable performance only in children aged 5 to 7 years (Knowland et al., Reference Knowland, Evans, Snell and Rosen2016; Kyle et al., Reference Kyle, Campbell, Mohammed, Coleman and MacSweeney2013).
If task complexity is controlled for, we may see a clearer developmental pattern in how children (and adults) use auditory and visual cues to identify a lexical referent. Here we report a study to bridge the gap between the apparent successes of visual speech processing in very young children (in studies using visual-looking tasks), with the apparent difficulty of speech processing in older children (in studies using explicit behavioural measures). We are interested in establishing whether and when visual cues can be used for lexical processing, using an implicit measure of response in children. If participants succeed at this task from early in our age range of 2 to 8 years, we would show continuity between young learners’ and older children’s visual speech processing. However, if children show only incremental development similar to tasks using explicit behavioural tasks, then we would show developmental discontinuity with the literature on infants and toddlers that could not easily be attributed to task differences.
Participants were presented with trials that started with a Target Word Presentation Phase. A speaker produced familiar target words in audio-visual (AV), audio-only (A-only), or visual-only (V-only) speech modalities, with either labial (/b/) or velar (/k/) places of articulation at onset (POA) that are visually distinct from each other (Hall, Green, Moore & Kuhl, Reference Hall, Green, Moore and Kuhl1999). The trials then moved to a Preferential Looking Phase, where participants saw target and distractor images (with different POAs) and looking to the target image was measured. Our method is similar to Cannistraci (Reference Cannistraci2017), who used an AV word recognition task with adults: target words were presented in either AV or V-only modalities, with both correctly pronounced or mispronounced targets. In Cannistraci (Reference Cannistraci2017), the speaker appeared at the top of the screen, with two images (target, distractor) at the bottom of the screen, whereas in our study this was separated into two phases. Adults’ performance in Cannistraci (Reference Cannistraci2017) was well above chance, showing a clear ability to identify target images in the V-only modality.
We tested the developmental pattern of use of auditory and visual cues in two ways. First we asked if fixations to the eyes and mouth of a speaker change across development. We predicted that as children improve in using lipreading and using the visual modality, they will make more looks to the mouth of a speaker than the eyes. Then, we asked if word recognition was affected by developmental changes in use of these cues. We predicted that during the Preferential Looking Phase, children and adults would look accurately to target images in both the AV and A-only speech modalities, and that adults would also look accurately to target images in the V-only modality. Since previous research using a forced-choice task has shown that above chance performance on lipreading emerges in children aged 5 to 7 years (Knowland et al., Reference Knowland, Evans, Snell and Rosen2016; Kyle et al., Reference Kyle, Campbell, Mohammed, Coleman and MacSweeney2013), we predicted that accuracy on the V-only mode would emerge around the same time. However, visual-looking tasks have found that sensitivity to visual cues emerges by toddlerhood (Havy & Zesiger, Reference Havy and Zesiger2017, Reference Havy and Zesiger2020), so we could also expect to see high accuracy under 5 years of age.
Method
Participants
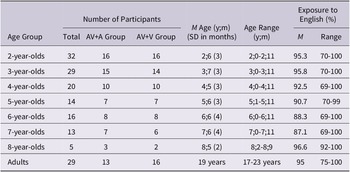
Participants were 129 English-speaking children aged 2 to 8 years (65 females, 62 males, 2 unrecorded). Age in months was analyzed as a continuous variable, but the breakdown by years can be seen in Table 1. Participants were considered monolingual English speakers if they had a minimum lifetime average of 70% exposure to English (M = 93%, range = 69–100%, see Table 1 for breakdown by years), learned English from birth, and had no more than two consecutive years of +30% exposure to another language as estimated from parental reports. Note that we included three children (a 4-year-old, a 6-year-old and a 7-year old) who had reported 69% exposure to English as it was close to the 70% cut-off. All children were also reported to have normal hearing, normal vision, and no history of language impairment. Children were tested in one session in a sound attenuated booth or room either at a campus-based or museum-based lab. Twenty-two additional children were tested but not included in the analyses for not completing calibration (n = 13), not completing the experiment (n = 1), equipment error (n = 5), parental interference (n = 1), or not enough data (n = 2, see data analyses). A group of 29 adults was also tested (M = 19 years, 22 females, 7 males). Adults had self-reported monolingual exposure to English (M = 95%, range = 75–100%). All adults were tested at a campus-based lab and received partial course credit. One additional adult was tested and excluded for equipment error.
Breakdown of participants by age group, Speech Modality and % lifetime exposure to English

Stimuli
Stimuli were 14 monosyllabic words: six practice items (dog, shoe, sheep, toy, sun, eye), and 8 test items. The test items were yoked, controlling for animacy, and contrasting in the initial consonant (B-word targets started with voiced labial stop /b/; K-word targets started with voiceless velar stop /k/), while avoiding phonological overlap in the rime (bear-cat, bed-car, ball-coat, bird-cow). Words were chosen to be early-acquired nouns. This was verified using the American-English normative data from the Words and Sentences MB-CDI (Fenson et al., Reference Fenson, Marchman, Thal, Dale, Reznick and Bates2007) on Wordbank (Frank, Braginsky, Yurovsky & Marchman, Reference Frank, Braginsky, Yurovsky and Marchman2016). Stimuli items are produced on average by 75% of children at 24 months, with the exception of coat which reaches 75% at 30 months, and cow, which reaches 75% by 26 months. Based on the production normative data, it was expected that all words would be recognized by the youngest children in our study. Visual targets were depicted using coloured clip-art images. Images were horizontally centered, sized 350 x 370 pixels, and spaced 260 pixels apart.
Stimuli were audio-video recorded by a native speaker of English, and used for the audio-visual (AV), audio-only (A-only), or visual-only (V-only) modalities. Words were produced naturally, with no enhancement or exaggeration of the articulatory gestures. In the AV- and V-only speech modalities, the video of the speaker always began with a closed mouth, and so preparatory mouth gestures for syllables produced in isolation could also have provided some additional (but naturalistic) information about the target words (Schwartz & Savariaux, Reference Schwartz and Savariaux2014). Such preparatory movements have been shown to influence audio-visual speech processing in adults (Bernstein, Auer & Takayanagi, Reference Bernstein, Auer and Takayanagi2004) and in infants (Lalonde & Werner, Reference Lalonde and Werner2021). For our stimuli, lip movement for initial consonants began on average 690 ms into the trial (M = 704 ms for B-words, M = 683 ms for K-words). On the K-words the speaker’s mouth began moving earlier (M = 450 ms), as the talker made a preparatory movement (duration M = 225 ms), before beginning the /k/ articulation. There was no preparatory movement on the B-initial words; however, a slight movement below the chin can be observed on some trials as vocal tract air pressure builds before the /b/. Based on these naturally occurring differences in speech articulation, there may be differences in how participants perform on the K-words (with preparatory movement) vs. B-words (without preparatory movement).
The target word played on the audio track in the AV and A-only modalities on average 800 ms into the trial, (M = 830 ms for B-words, M = 750 ms for K-words). The average audio duration of targets was 520 ms (range = 461–571). Stimuli were normalized for amplitude (70 dB). In the V-only modality, the auditory track from the AV modality was removed, resulting in a silent video of the speaker articulating a target word. Stimuli in the A-only modality contained a static image of the speaker with her mouth closed and a neutral expression while only the auditory track was played. Images and AV stimuli are available at an OSF repository: https://osf.io/jxtsk/.
Design
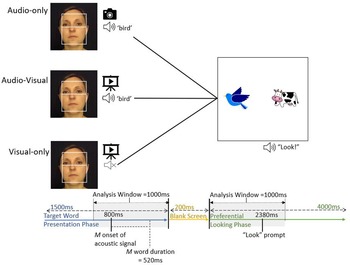
Each trial consisted of two phases: a Target Word Presentation Phase and a Preferential Looking Phase. There was a blank screen for 200 ms between the two phases (Figure 1). During the Target Word Presentation Phase, the target word was presented in either AV, A-only or V-only speech modalities, which lasted 1500 ms in duration. Analyses of eye-movements to the visual face were based on a 1 s window, from 500-1500 ms, with more detail provided below in the description of the analyses for the Target Word Presentation Phase. There were also two interest areas (AOIs) for the Target Word Presentation Phase: Eyes (554 x 296 pixels) and Mouth (554 x 387 pixels): See Figure 1.
Timeline of trials for the different Speech Modalities conditions and Analysis windows. Areas of Interest for Eyes and Mouth used in the analyses for the Target Word Presentation Phase. Timeline is not to scale.

The second phase was the Preferential Looking Phase where participants saw two images (target and distractor) presented in silence. After 680 ms, participants heard ‘Look!’. Images remained on the screen for 4 seconds; however, only the first 1 s window was analyzed, starting from when the images appeared on the screen. More details are provided below in the analyses of the Preferential Looking Phase. AOIs during the Preferential Looking Phase were placed slightly larger around the target and distractor images, 380 × 390 pixels.
The different speech modalities were presented in separate blocks and each participant received two blocks. The first block was always the AV modality, as pilot testing suggested that the optimal protocol across all age groups was to run the AV modality first to familiarize the procedure, before moving onto the more difficult A-only and V-only modalities in the second block. This first block comprised 2 practice trials and 8 test trials. Each word appeared once as a target and once as a distractor. A short attention-getting video clip then appeared between blocks. In the second block, half of participants received the A-only modality, and the other half received the V-only modality. The structure of the second block was the same as the first block: two practice trials and 8 test trials.
There were 4 different lists for counterbalancing the order of target words and images. In each block, the same initial consonant (/b, k/) did not appear as a target word more than twice in a row. Target images did not appear on the same side (left, right) more than twice in a row. In each block, there was a maximum of one repetition of the same consecutive yoked pair (e.g., Trial: bed [left-target], car [right-distractor] followed by Trial: car [left-target], bed [right-distractor]). The datasource file can be found on the OSF repository. Practice trials had the same structure as the test trials; however, during the Preferential Looking Phase, the target image moved horizontally to indicate that it was the target.
Procedure
Participants were seated 50–60 cm from a 17-inch monitor. Adults were tested alone in the room, while children either sat on their caregiver’s lap (with caregivers instructed not to look at the screen and to tilt their eyes and heads downwards behind their child’s head), or sat alone while parents remotely viewed the session from the adjoining waiting room. Eye movements were recorded using an Eyelink 1000 (campus-based lab) or an Eyelink 1000 Plus (museum-based lab) in monocular remote mode with a sampling rate of 500 Hz (SR Research, Ottawa). Calibration was based on a 3-point grid (HV3). All trials started with an attention getter in the centre of the screen. When participants looked at the attention getter, the experimenter triggered the start of the trial. The experiment took approximately five minutes to complete. Participants were randomly assigned to either the AV+A-only or AV+V-only groups (see Table 1 for a breakdown of groups by years).
Results
Each trial began with the Target Word Presentation Phase where the target word was presented in AV, A-only or V-only speech modalities. This was followed by the Preferential Looking Phase, which displayed the target and distractor image. We first assessed how participants attended to the screen during the Target Word Presentation Phase in order to interpret looking during the Preferential Looking Phase. For the Target Word Presentation Phase, total fixations in ms to the Eyes and Mouth AOIs were extracted from the 1-s time window. Participants had to look a minimum of 500 ms within this time window to either the Eyes and/or Mouth AOIs for a trial to be included in the analysis. This ensured looking at the screen for at least 1/2 of the presentation of the word (average auditory word length was 520 ms, average onset of audio was 300 ms into the 1-s time window and average offset was 820 ms into the 1-s time window). While the looking criteria was only relevant for AV and V-only modes, we applied the same criterion to all trial types (AV, A-only and V-only trials). On average, child participants met this criterion on 14.78 out of 16 trials. The age group with the lowest average number of included trials by this criterion was 3-year-olds (14.17 out of 16 trials). Of the trials that were included in the analysis, children looked an average of 932 ms during the 1 s time window. The age group with the lowest average looking following data cleaning was 7-year-olds (921 ms). See supplementary materials on the OSF repository for a breakdown of included trials and average looking by children’s years. Adults met the criterion on an average of 15.97 out of 16 trials. Adults looked an average of 942 ms on included trials.
We also restricted our analyses in the Preferential Looking Phase to trials on which participants had tracked gaze for a minimum of 250 ms to either the target or distractor image AOIs. On average, child participants met this criterion on 15.29 out of 16 trials. The age group with the lowest average number of included trials was 2-year-olds (15.06 out of 16 trials). Of the trials that were included in the analysis, children looked an average of 644 ms during the 1 s time window. The age group with the lowest average looking following data cleaning for this phase was 3-year-olds (635 ms). See supplementary materials for further details by children’s years. Adults met the criterion on an average of 15.83 trials. Adults looked an average of 693 ms. Cumulatively, based on these criteria from both the Target Word Presentation Phase and Preferential Looking Phase, 9.5% of trials were excluded from analyses of children’s data, and 1% of the trials were excluded from analyses of adult data.
Target word presentation phase: analyses of looking to the face
The first analyses examined fixations to the face during the presentation of the target word, done separately for children and adults. We examined the proportion of looking to the eyes and mouth, in order to understand how scanning the face for linguistic information might change over age, and under different speech modalities. This analysis involved a looking index, which followed prior work (Lewkowicz & Hansen-Tift, Reference Lewkowicz and Hansen-Tift2012). The calculation of this index began by taking the proportion of time fixated to the Eyes and Mouth AOIs relative to total face looking, which normalized total looking across individual differences (i.e., older children look more overall, compared to younger children). We then calculated a difference score for each trial (i.e., proportion of gaze in the Eyes AOI – the proportion of gaze in the Mouth AOI). Thus, positive index scores (0 to 1) indicated more looking to the Eyes AOI, while negative scores (-1 to 0) indicated more looking to the Mouth AOI. In addition to analyzing fixations using the Eye-Mouth indices, we first verified that there were no clear differences in overall gaze to the face across the different modalities (see Total Looking To Face Analysis in supplementary materials). Adults looked more to the face during the V-only modality and children looked less during the A-only modality (the still face). However, these reflect small differences in total face looking, with looking to the face over 900 ms in all of the modalities (out of 1000 ms).
Eye-mouth indices were dependent variables for different sets of linear mixed-effects models performed in R (R Core Team) using the lmer() function from the lme4 package (version 1.1-26; Bates, Mächler, Bolker & Walker, Reference Bates, Mächler, Bolker and Walker2015). In each model, there were three fixed effects: Speech Modality (AV, A-only, V-only; dummy coded with AV as reference level), Place of Articulation (POA, with BK deviation coded as [–0.5, 0.5]), and their interaction. For child data we also included the effect of age in months (mean-centered) and its interaction with all other fixed effects. Parts of our data were skewed as we had sparser sampling in our range at 8 years of age versus 2 years of age and overall greater looking to the eyes than to the mouth. Thus, statistical assumptions of the normality of linear models were sometimes violated. However, linear mixed-effects models are largely robust to violations of normality (Schielzeth, Dingemanse, Nakagawa, Westneat, Allegue, Teplitsky, Réale, Dochtermann, Garamszegi & Araya-Ajoy, Reference Schielzeth, Dingemanse, Nakagawa, Westneat, Allegue, Teplitsky, Réale, Dochtermann, Garamszegi and Araya-Ajoy2020), and all present measures remained untransformed to preserve variable interpretation (i.e., age in years, eye-mouth index, etc.). We started with the most complex random-effects structure, including random intercepts for subjects and items, and random slopes for POA (across subjects) and Speech Modality (across items). The random effects structure was reduced incrementally until models converged. Significance testing for model effects was done using Wald F-tests with Kenward-Rogers estimations for degrees of freedom, applied through the Anova function in the car package for R (Fox & Weisberg, Reference Fox and Weisberg2011). Post-hoc comparisons of complex effects were done with the emmeans package, using Kenward-Rogers estimations for degrees of freedom and Bonferroni-corrections (Lenth, Reference Lenth2020). Alternative analyses running binomial mixed effects models are available in supplementary material but most models did not converge and were therefore not reported here. Data and detailed code can be found at the OSF repository.
Eye-Mouth index
Adults
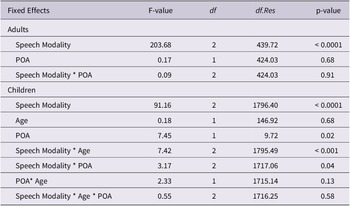
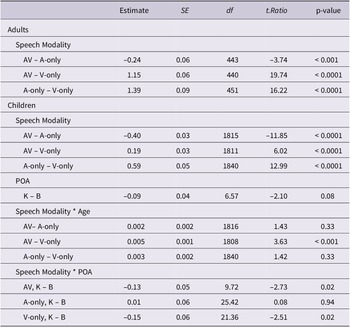
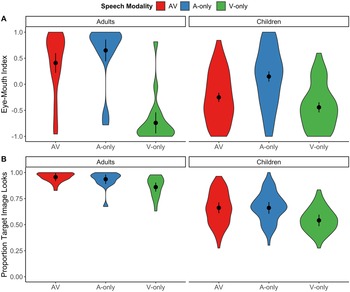
There was a significant effect of Speech Modality and no other significant effects. Results from the adult model are shown in Table 2 and Figure 2A. Post-hoc tests of the estimated marginal means for Speech Modality (Table 3) reveal that all levels of speech modalities were different from each other. Adults’ Eye-Mouth Index was higher (i.e., with more looking to the Eyes AOI) in the AV modality, M = 0.41, SE = 0.10, 95% CI [0.22, 0.60], compared to the V-only modality, M = –0.74, SE = 0.10, 95% CI [–0.95, –0.53], and lower (i.e., more to the Mouth AOI) in the AV modality compared to the A-only modality, M = 0.65, SE = 0.11, 95% CI [0.44, 0.86]. Similarly, the Eye-Mouth Index was higher in the A-only modality (i.e., less mouth-biased) than in the V-only modality. The proportion of variance accounted for by the final adult model for the fixed effects was R2 m = 0.40, and for the fixed and random effects was R2 c = 0.71.
Individual effects from the models predicting Eye-Mouth Index looking during Target Word Presentation Phase, for Adults and Children

Note. Wald F-tests with Kenward-Roger estimates for df. The original model specified in the syntax for the lme4 package was as follows for the adult data set: Eye-Mouth Index ~ Speech Modality * Place of Articulation + (1 | Participant). For the child data, the final model had the following syntax: Eye-Mouth Index ~ Speech Modality * Age * Place of Articulation + (1 | Participant) + + (1 | Item).
Post-hoc tests of the estimated marginal means for significant effects from the model predicting proportion of looking to the target image during the Target Word Presentation Phase, for Adults and Children

Violin plots showing the distribution of data by Target Speech Modality for adults and children. Points are the estimated marginal means from the model with error bars indicating 95% confidence intervals. (A) Eye-Mouth Index during Target Word Presentation Phase. Positive scores (+1) indicated more looking to the Eyes AOI, while negative scores indicate more looking to the Mouth AOI. (B) Proportion of Target Image Looks during the Preferential Looking Phase.

Children
There were significant main effects of Speech Modality, POA, as well as interactions between Speech Modality and POA, and between Speech Modality and Age. Results from the child model are also shown in Table 2 and Figure 2A. Post-hoc tests of the estimated marginal means for Speech Modality (Table 3) show that children, like adults, had a higher index (i.e., less looking to the mouth) in A-only modality, M = 0.15, SE = 0.05, 95% CI [0.05, 0.25], compared to both AV modality, M = –0.25, SE = 0.04, 95% CI [–0.34, –0.16], and V-only modality, M = –0.44, SE = 0.05, 95% CI [ –0.54, –0.34]. There was also significantly less mouth-looking in the AV compared to the V-only modality. Thus, the direction of looking at the Eye-Mouth AOIs was similar in children and adults: children looked most at the mouth in the V-only modality, somewhat less in the AV modality, and least in the A-only modality. However, there were striking differences visually in the pattern of looking to the Eye-Mouth AOIs. While adults looked more to the Eyes (i.e., positive Eye-Mouth Indices) in both the AV and A-only modalities, children had a slightly higher positive index (more looking to the Eyes) only in the A-only modality (Figure 2A).
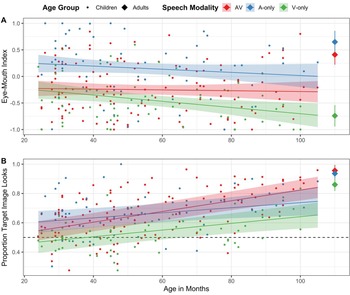
The effect of Speech Modality also interacted significantly with age (Figure 3A). There was an overall tendency to look more at the mouth as children got older for the V-only modality, β = –.0059, SE = 0.0021, 95% CI [–.0099, –.0018], but not in the AV modality, β = –.0008, SE = 0.0018, 95% CI [–.0044, .0029], and not in the A-only modality, β = –.0030, SE = 0.0022, 95% CI [–.0072, .0013]. The pattern of Eye-Mouth AOIs looking converges slowly to the adult pattern, with AV and V-only looking becoming more distinct with age. However, even the oldest children in our sample did not show the adult pattern in AV and A-only modalities: that is, when comparing the average adult values on the right side of Figure 3A which shows greater looking to the eyes in the AV and A-only modalities for adults, compared to the oldest children in Figure 3A, where looking to the eyes and mouth across all modalities has a much smaller spread.
Model-estimated trends for the child data, plotting age-related change by Target Speech Modality. Adult data as a reference point. Error bars indicate 95% confidence intervals. (A) Eye-Mouth Index during Target Word Presentation Phase. Positive scores (+1) indicated more looking to the Eyes AOI, while negative scores indicate more looking to the Mouth AOI. (B) Proportion of Target Image Looking during the Preferential Looking Phase. Dotted line represents chance looking at .50.

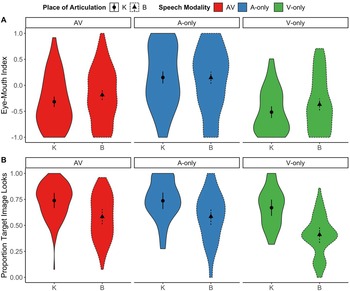
The interaction of Speech Modality and POA (Figure 4A), indicates that children looked more at the mouth for K-word targets than B-word targets in the AV modality (K-word: M = –0.32, SE = 0.05, 95% CI [–0.42, –0.21]; B-word: M = –0.19, SE = 0.05, 95% CI [–0.29, –0.08]) and V-only modality (K-word: M = –0.52, SE = 0.06, 95% CI [–0.63, –0.40], B-word: M = –0.37, SE = 0.06, 95% CI [–0.48, –0.25]), with no difference in the A-only modality (K-word: M = 0.15, SE= 0.06, 95% CI [0.03, 0.27], B-word: M = 0.15, SE= 0.06, 95% CI [ 0.03, 0.26]). The increased looking to the mouth during the K-word vs. B-word videos, likely reflects the preparatory mouth opening gesture on K-words (M = 225 ms), whereas articulation for B-words were initiated from lip closure. The proportion of variance accounted for by the final child model for the fixed effects was R2 m = 0.11, and for the fixed and random effects was R2 c = 0.48.
Violin plots showing the distribution of data by Target Speech Modality and Place of Articulation of the target words, for just the child data. Points are the estimated marginal means from the model with error bars indicating 95% confidence intervals. (A) Eye-Mouth Index during Target Word Presentation Phase. Positive scores (+1) indicated more looking to the Eyes AOI, while negative scores indicate more looking to the Mouth AOI. (B) Proportion of Target Image Looking during the Preferential Looking Phase.

Together, these analyses established there were differences in the proportion of looking to the eyes versus mouth across the different POAs, as well as across different ages and different target speech modalities (AV, A-only, and V-only). The most notable difference was in how children fixated to the mouth in the V-only modality, fixating more to the mouth with age (Figure 3A). We return to these results when we discuss possible accounts for children’s looking to the target images in the next phase, which are covered in the next set of analyses.
Preferential looking phase: analyses of looking to the target images
After the target word presentation, participants then saw target and distractor images, (Figure 1). Looking was calculated as a proportion of total looks to the target image over total looks to the target and distractor images. Data were analyzed using linear mixed-effects models with the same fixed and random effects structure as the previous analysis. The methodology for establishing the model with the most complex random effects structure was the same as before, as was the methodology for calculating significance and post-hoc comparisons.
Proportion target image looks
Adults
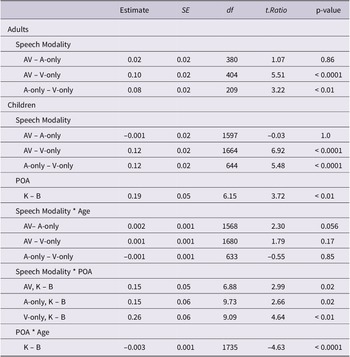
For preferential looking, F-tests indicated that there was only a significant effect of Speech Modality. Results from the adult model are shown in Table 4, Figure 2B and posthoc tests of the estimated marginal means are provided in Table 5. Post-hoc tests revealed that adults looked more to the target image in the AV modality, M = 0.96, SE = 0.02, 95% CI [0.91, 1.00], compared to V-only modality, M = 0.86, SE = 0.02, 95% CI [0.81, 0.91], and more to the target image in the A-only modality, M = 0.94, SE = 0.02, 95% CI [0.89, 0.99], compared to V-only modality (Table 5). Looking to the target image in the AV versus A-only modality was not different. In the supplementary analyses for Total Looking To Face, we found that adults looked more to the face during the V-only modality compared to the AV and A-only modalities. Thus, decreased looking to target image in the V-only modality during the Preferential Looking Phase cannot be attributed to less overall looking during the Target Word Presentation Phase. Instead, the differences in target image fixation indicate differences in how the AV, A-only, and V-only cues were processed. The proportion of variance accounted for by the final adult model for the fixed effects was R2 m = 0.06, and for the fixed and random effects was R2 c = 0.21.
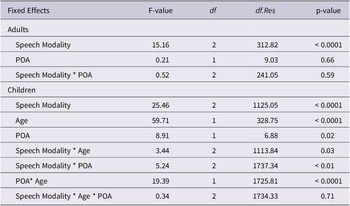
Individual effects from the model predicting proportion of looking to the target image during the Preferential Looking Phase, for Adults and Children

Note. Wald F-tests with Kenward-Roger estimates for df. The original model specified in the syntax for the lme4 package was as follows for the adult data set: Proportion Looking to Target ~ Speech Modality * Place of Articulation + (1 + Place of Articulation | Participant) + (1 | Item). For the child data, the final model had the following syntax: Proportion Looking to Target ~ Speech Modality * Age * Place of Articulation + (1 | Participant) + (1 | Item).
Post-hoc tests of the estimated marginal means for significant effects from the model predicting proportion of looking to the target image during the Preferential Looking Phase, for Adults and Children

Children
This model revealed significant main effects of all predictors and significant 2-way interactions between all predictors (Table 4). Post-hoc tests of the main effect of Speech Modality reveal that the pattern with children was the same as with adults (see Figure 2B and Table 5). Children looked more to the target image in the AV modality, M = 0.66, SE = 0.03, 95% CI [0.60, 0.72], compared to V-only modality, M = 0.54, SE = 0.03, 95% [0.48, 0.60], and more to the target in the A-only modality, M = 0.66, SE = 0.03, 95% CI [0.60, 0.73], compared to V-only modality. Looking to the target image in the AV compared to A-only modality was not different, however, and overall accuracy was much lower for children compared to adults. The main effect of Age shows that children’s looking to the target image simply increased with age, with <1% increase in target looking every month, β = .004, SE = .0005, t(329) = 7.7, p < .001. Lastly, the main effect of POA indicated that children were less accurate at looking at B-word target images, M = 0.53, SE = 0.04, 95% CI [0.44, 0.61], versus K-word target images, M = 0.72, SE = 0.04, 95% CI [0.63, 0.80].
As shown in Figure 4B, post-hoc tests for the interaction between Speech Modality and POA showed that the pattern of greater target image looking in the K-word versus B-word was present in all modalities (Table 5). The locus of the interaction was that the advantage for K-words was especially pronounced in the V-only modality (K-words: M = 0.67, SE = 0.04, 95% CI [0.58, 0.76]; B-words: M = 0.41, SE = 0.04, 95% CI [0.32, 0.50] as compared to the AV modality (K-words: M = 0.74, SE 0.04, 95% CI [0.65, 0.83]; B-words: M = 0.58, SE = 0.04, 95% CI [0.50, 0.67]) and the A-only modality (K-words: M = 0.74, SE = 0.04, 95% CI [0.65, 0.83]; B-words: M = 0.59, SE = 0.04, 95% CI [0.50, 0.68]). It is somewhat curious that there was also more looking to K-words than B-words on the A-only modality. It may be that the increased mouth-looking for K-words in the AV Target Word Presentation Phase coupled with increased target-image looking for K-words in the AV Preferential Looking Phase may have carried over to the A-only modality (as A-only trials were always preceded by AV trials).
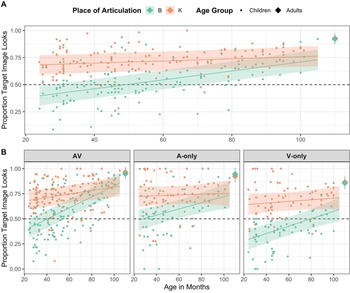
There was also a significant interaction between Age and POA (Figure 5A). Children had greater accuracy in looking to K-initial compared to B-initial target images; but for K-words, performance increased only slightly across age, β = .0010, SE = 0.0005, 95% CI [<.0001, .0020], while improvement was more marked for B-words, β = .0041, SE = 0.0005, 95% CI [.0031, .0051] (Table 5). For B-words, the proportion of looking at the correct target image went from 0.40 at the youngest ages (SE = 0.04, 95% CI [0.31, 0.49] at 24 months) to 0.73 at the oldest ages (SE = 0.04, 95% CI [0.64, 0.83] at 105 months), with looking rising above chance starting at 5 to 6 years of age for these words. At the same time, K-words only changed from 0.68 at the youngest ages (SE = 0.04, 95% CI [0.60, 0.77] at 24 months) to 0.76 at the oldest ages (SE = 0.04, 95% CI [.67, .86] at 105 months). In summary, the overall advantage for K-words dissipated with age.
Model-estimated trends for the child data with adult data as a reference point. Error bars indicate 95% confidence intervals. (A) Proportion of Target Image Looking during the Preferential Looking Phase plotting age-related change by Place of Articulation, collapsed across Target Speech Modality. (B) Proportion of Target Image Looking during the Preferential Looking Phase plotting age-related change by Place of Articulation, broken down by AV, A-only and V-only Speech Modality. Dotted line represents chance looking at .50.

The last interaction, between Speech Modality and Age, showed faster age-related increases in some modalities than others. Specifically, improvement was most marked in the AV modality, β = .0037, SE = 0.0005, 95% CI [.0027, .0046]; improvement in the V-only modality was intermediate, β = .0023, SE = 0.0007, 95% CI [.0010, .0036]; and the most gradual improvement was in the A-only modality, β = .0017, SE = 0.0007, 95% CI [.0003, .0032]. The slopes of the AV and A-only modalities were significantly different (Table 5). As can be seen in Figure 3B, at the youngest ages, children performed slightly better on the A-only trials compared to the other modalities; however, AV trials became more effective than A-only trials with age. To examine this statistically, we examined the predicted proportion of looks to target image at each age in 12-month intervals and examined the relation of the 3 modalities to each other. The statistics are available in supplemental materials. At all ages, performance on the AV and A-only modalities did not significantly differ, while performance on the AV modality was significantly higher than on the V-only modality. At ages 2 to 7 years, target image looking in the A-only modality was greater than in the V-only modality; but, for 8-year-olds, there was no significant difference in performance between the A-only and V-only modalities. When examining the confidence intervals in each modality at each age range, we found that performance was above chance for only the A-only modality at age 2 years, for both the AV and A-only modalities at ages 3, 4, and 5 years, and was above chance for all modalities at age 6 years and older.
This finding may be explained by several factors. First, AV trials always came first (children either had AV followed by A-only trials, or AV followed by V-only trials), which may have made AV trials more difficult for the youngest participants, with support from visual cues during AV target word presentation only emerging at later ages. Second, there was V-only improvement with age, but this remained consistently lower than both the AV and A-only trials, with target-image looking at chance until 6 years of age. In summary, we show a parallel result with other work which uses more explicit behavioural measures, suggesting that children showed a very gradual ability to use V-only speech information in word recognition. The proportion of variance accounted for by the final child model for the fixed effects was R2 m = 0.15, and for the fixed and random effects was R2 c = 0.21.
The interaction between Speech Modality, Age, and POA was not significant. However, in order to understand trends in the data, we present the interaction effects in Figure 5B. Looking at the estimated confidence intervals for K-words, we can see that target-image looking is relatively flat and above chance starting at the youngest age group for all Target Speech Modalities (around 70% accuracy). However, looking at the B-words, looking to the target image in all speech modality conditions is below chance at the earliest ages, with improvement in all speech modality conditions continuing until the end of the age range. One of the research questions posed was when are learners able to use V-only cues to identify lexical references. Based on Figure 5B, we can see that in the V-only modality, K-words were identified at the earliest stages, whereas B-words only approached above chance performance at the oldest age groups. We return to this sound-specific effect in the discussion.
Discussion
Developmental changes are seen in how auditory and visual cues contribute to on-line speech processing. Here we discuss the findings from adults, followed by results from children.
Summary of adults
During the Target Word Presentation Phase, adults fixated more to the eyes on the AV and A-only modalities, and more to the mouth in the V-only modality. This is consistent with previous work where adults fixated more to the mouth than the eyes when a speech-related task is made more challenging (Barenholtz, Mavica & Lewkowicz, Reference Barenholtz, Mavica and Lewkowicz2016; Lewkowicz & Hansen-Tift, Reference Lewkowicz and Hansen-Tift2012). During the Preferential Looking Phase, adult performance was well above chance in all Target Speech Modalities (AV 96%, A-only 94%, and V-only 86% accurate), indicating that adults were able to successfully lipread to identify the target image. Our findings are in line with Cannistraci’s (Reference Cannistraci2017) AV word recognition task with adults, where performance was also well above chance, with higher accuracy in the AV mode (95%) compared to the V-only mode (93%). Our results should be interpreted with caution, given the small effect size, and the fact that AV modality was always tested before the V-only modality.
Summary of children
During the Target Word Presentation Phase, children looked more at the mouth for K-words than for B-words in the AV and V-only modalities, but not in the A-only modality. This follows from characteristics of our videos: K-words included a preparatory mouth gesture; whereas, on B-words, the speaker went directly from a neutral closed mouth into the gesture of lip closure. The overall pattern of looking to the eyes and mouth became more adult-like with age, but even the oldest children did not yet show clear adult-like patterns. The most notable developmental trend was increased mouth-looking in the V-only modality, particularly compared to the AV modality. Children as old as 8 years show only a gradual tendency towards adult-like patterns when looking for visual speech information on the mouth in AV versus V-only modalities, echoing other reports (Worster, Pimperton, Ralph‐Lewis, Monroy, Hulme & MacSweeney, Reference Worster, Pimperton, Ralph‐Lewis, Monroy, Hulme and MacSweeney2018). We also show that children across all ages looked more to the mouth than eyes in AV and V-only modalities, unlike adults, which similarly echoes prior work (Nakano, Tanaka, Endo, Yamane, Yamamoto, Nakano, Ohta, Kato & Kitazawa, Reference Nakano, Tanaka, Endo, Yamane, Yamamoto, Nakano, Ohta, Kato and Kitazawa2010).
Turning to the Preferential Looking Phase, as expected, children’s accuracy in target-image looking increased with age; however, accuracy was also contingent on other factors. Critically, looking to target images in the V-only modality only differed from chance starting at 6 years of age; suggesting that the ability to lipread from V-only information in our task did not emerge until childhood. This, however, needs to be considered in relation to the interaction between Speech Modality and POA – where there was an overall advantage for K-words across all Speech Modality conditions, and most pronounced in the V-only modality. This suggests that the increased mouth-looking during the Target Word Presentation Phase for K-words compared to B-words in both AV and V-only modalities was reflected in overall performance in the Preferential Looking Phase. Interestingly, this improved performance for K-words relative to B-words carried over even to the A-only trials (which was always preceded by the AV trials). This may have stemmed from the increased mouth-looking to the K-words during the Target Word Presentation Phase during the first AV block.
The last interaction was a developmental change in children’s accuracy in looking to target images with K-words compared to B-words. For K-words, accuracy was stable across development; however, with B-words, accuracy went from about 40% to 73%. Thus, the overall advantage for K-words reduced across age. Collapsed across POA, children’s ability to lipread target words emerged at around 6 years of age, in-line with previous work (Knowland et al., Reference Knowland, Evans, Snell and Rosen2016; Kyle et al., Reference Kyle, Campbell, Mohammed, Coleman and MacSweeney2013). As in previous research, we also found that lipreading performance varies: target-image looking on the V-only mode for just K-words was consistent across age, while looking to target images on B-words showed ~35% improvement across the age range. This is counter to previous research which found that visual cues from /b/ improved performance (35–40%) compared to /ɡ/ in children aged 4 to 14 years (Jerger et al., Reference Jerger, Damian, McAlpine and Abdi2018; also see Jerger et al., Reference Jerger, Damian, Tye-Murray and Abdi2014). We found the opposite effect, which, as we argued above, stems from the nature of our visual stimuli: K-words included a preparatory mouth gesture which may have given participants time to initiate their eye gaze towards the mouth, and subsequently fixate in time to perceive the /k/ gesture. Research has shown that infants are already sensitive to the temporal aspects of visual speech cues (Lalonde & Werner, Reference Lalonde and Werner2021). While speech stimuli naturally have other visual cues (e.g., vowels and final consonants) that could be used to identify the target words, onsets have the most reliable and perceivable visual cues (Gow, Melvold & Manuel, Reference Gow, Melvold and Manuel1996). Our expectation is that if there was a similar preparatory gesture before moving into the /b/ gesture – then younger children would show higher accuracy on B-words. This is not to say that sound-specific effects are driven only by the visual characteristics of articulation: part of this observed effect might also have depended on the frequency of individual words and pairs. For example, across the age-span, the difference between /k-b/ was least pronounced for the pair cat-bear, which could reflect children’s higher familiarity with the words. There are also semantic differences between the pairs, as pointed out by a reviewer. While we yolked animate items to control for saliency (e.g., cat-bear), stimuli pairs also differed such that semantic overlap was higher for some pairs (cat-bear) than for others (ball-coat). Just as for word familiarity, the effect of these item-related semantic factors likely have an effect on word recognition (e.g., Borovsky, Ellis, Evans & Elman, Reference Borovsky, Ellis, Evans and Elman2016), and could also be further manipulated in future research on visual speech.
We investigated how auditory and visual cues are used for word recognition, and more specifically whether visual speech cues alone could be used to determine a lexical referent. Our results are mixed. On the one hand, we show that children are able to reliably use V-only cues to identify referents from a young age, but only for K-words. This suggests developmental continuity with the literature on infant and toddler visual speech processing, who show a tenuous sensitivity to visual cues. On the other hand, when considering all stimuli in 1-year age chunks, we observed a gradual development in processing of visual speech cues (rather than a U-shaped curve). This is compatible with work showing that word recognition skills continue to develop over childhood (Desmeules-Trudel, Moore & Zamuner, Reference Desmeules-Trudel, Moore and Zamuner2020; Rigler, Farris-Trimble, Greiner, Walker, Tomblin & McMurray, Reference Rigler, Farris-Trimble, Greiner, Walker, Tomblin and McMurray2015). Furthermore, since both looking to the mouth in V-only modality and looking to the target images across all speech modalities increased with age, our results show continuity between younger learners and older children’s visual speech processing, and and our results support previous research suggesting that sensory dominance shifts from auditory to visual across development (Hirst et al., Reference Hirst, Stacey, Cragg, Stacey and Allen2018).
Overall, our results show that the precocious visual speech skills seen in infancy and toddlerhood are replicable, but are far more fragile than one might think, with children only gradually learning to use visual speech for lexical access over development. Although we characterize this as an age-dependent skill, we did not include any additional measures of processing. Previous work has observed associations of visual speech processing with vocabulary (Jerger et al., Reference Jerger, Damian, McAlpine and Abdi2018), phonological awareness (Buchanan-Worster, MacSweeney, Pimperton, Kyle, Harris, Beedie, Ralph-Lewis & Hulme, Reference Buchanan-Worster, MacSweeney, Pimperton, Kyle, Harris, Beedie, Ralph-Lewis and Hulme2020) and working memory (Tye-Murray et al., Reference Tye-Murray, Hale, Spehar, Myerson and Sommers2014). Future work is needed to understand what drives the development of visual-speech skills, as top-down mechanisms such as expectation, attention, suggestion, or mental imagery can also be factors in the dominance and integration of audiovisual speech (Alsius et al., Reference Alsius, Paré and Munhall2017).
In our study, when children saw words in V-only mode, e.g., cat, they interpreted these cues to identify and correctly fixate on the image of the cat. This suggests that lexical entries include not only acoustic representations, but also information for how sounds and/or words are articulated (Fort et al., Reference Fort, Spinelli, Savariaux and Kandel2010). Lexical access with adults can be triggered by the articulatory gestures of just the first syllable (Fort, Kandel, Chipot, Savariaux, Granjon & Spinelli, Reference Fort, Kandel, Chipot, Savariaux, Granjon and Spinelli2013). Current models of lexical access such as TRACE (McClelland & Elman, Reference McClelland and Elman1986) and MERGE (Norris, McQueen & Cutler, Reference Norris, McQueen and Cutler2000) do not consider visual modality in their architecture. Findings like ours suggest that the integration of visual and auditory information should be accounted for in lexical access models. The integration of visual information could occur in at least three levels in current parallel models: the prelexical level, where visual information would activate corresponding phonemes; the lexical level, where visual information would activate representations in the lexicon directly parallel to auditory information; and/or visual information may be integrated post-lexically.
Future work is needed to identify the levels at which visual-based information is specified and used by children during word recognition. Participants may have identified the referent (cat) based solely on the visual cues associated at the phonemic level, such as from just the initial phoneme (the /k/ in cat), or from a combination of the initial phoneme, vowel and/or final consonant, which could be at phonemic and/or lexical levels (see Weatherhead & White, Reference Weatherhead and White2017 for a discussion of these issues). Further research is needed to determine, for example, if children can correctly identify a referent based on V-only cues isolated from the initial consonant. If so, this would provide support for phonemic level visual representations (though it would not omit the possibility of corresponding lexical level visual representations). Although our research cannot answer these questions, it does indicate when visual speech in children’s lexical representations is observable in their implicit eye-gaze behaviour. In the absence of auditory information, visual speech can be used to identify words with increasing accuracy over development.
The current study reveals that, like infants and toddlers, children across the ages of 2 to 8 years continue to fixate on a speaker’s mouth during word production (in AV and V-only modalities). In addition, above chance performance on lip-reading in a simplified looking-task starts at 2 years of age, but only with K-words. This is in line with the literature showing that sensitivity to visual cues emerges by toddlerhood (Havy & Zesiger, Reference Havy and Zesiger2017, Reference Havy and Zesiger2020), but is also compatible with work that shows this ability is still developing (up to at least 8 years) for less visually salient stimuli (our B-words). We thus reinforce other work showing that the flexible use of visual cues for lexical access continues to develop throughout childhood.
This visual speech research is not only interesting from this theoretical perspective, but it may also have broader implications for educators and clinicians (Toki & Pange, Reference Toki and Pange2010). For example, some suggest that access to a bimodal video of teachers could be more beneficial than just auditory information in adverse listening conditions (Işik & Yilmaz, Reference Işik and Yilmaz2011), but our results further suggest optimal ages for the implementation of these strategies (i.e., only after 6 years of age). For clinical applications for developmental populations, it may be beneficial to slow down recordings of articulatory gestures or present them with transparent features to allow better visualization of a particular gesture. For example, Massaro and Light (Reference Massaro and Light2004) found that children with hearing loss had improved articulation when they used an animated talking head to demonstrate speech production during sessions, which is suggestive of the idea that modifications to the visual saliency of talking faces may improve children’s ability to use visual speech. Overall, our study reinforces the importance of studying the effects of visual articulatory information in children’s lexical access and could support the maximization of using visual stimuli for speech and language intervention.
Acknowledgments
This research was supported by TSZ’s and HHY’s NSERC grants. We thank the Canada Science and Technology Museum, where a portion of the data was collected. We thank our participants and Amélie Bernard, Keara Boyce, Michele Burkholder, Myriam Ducos, Leah Gosselin, Gabriel DeRooy, Éloïse Soroka-Lavictoire and members of the uOttawa Centre for Child Language Research who contributed to this research. Lastly, we thank Susan Jerger for helpful comments.
Competing interests
The authors declare none.