Introduction
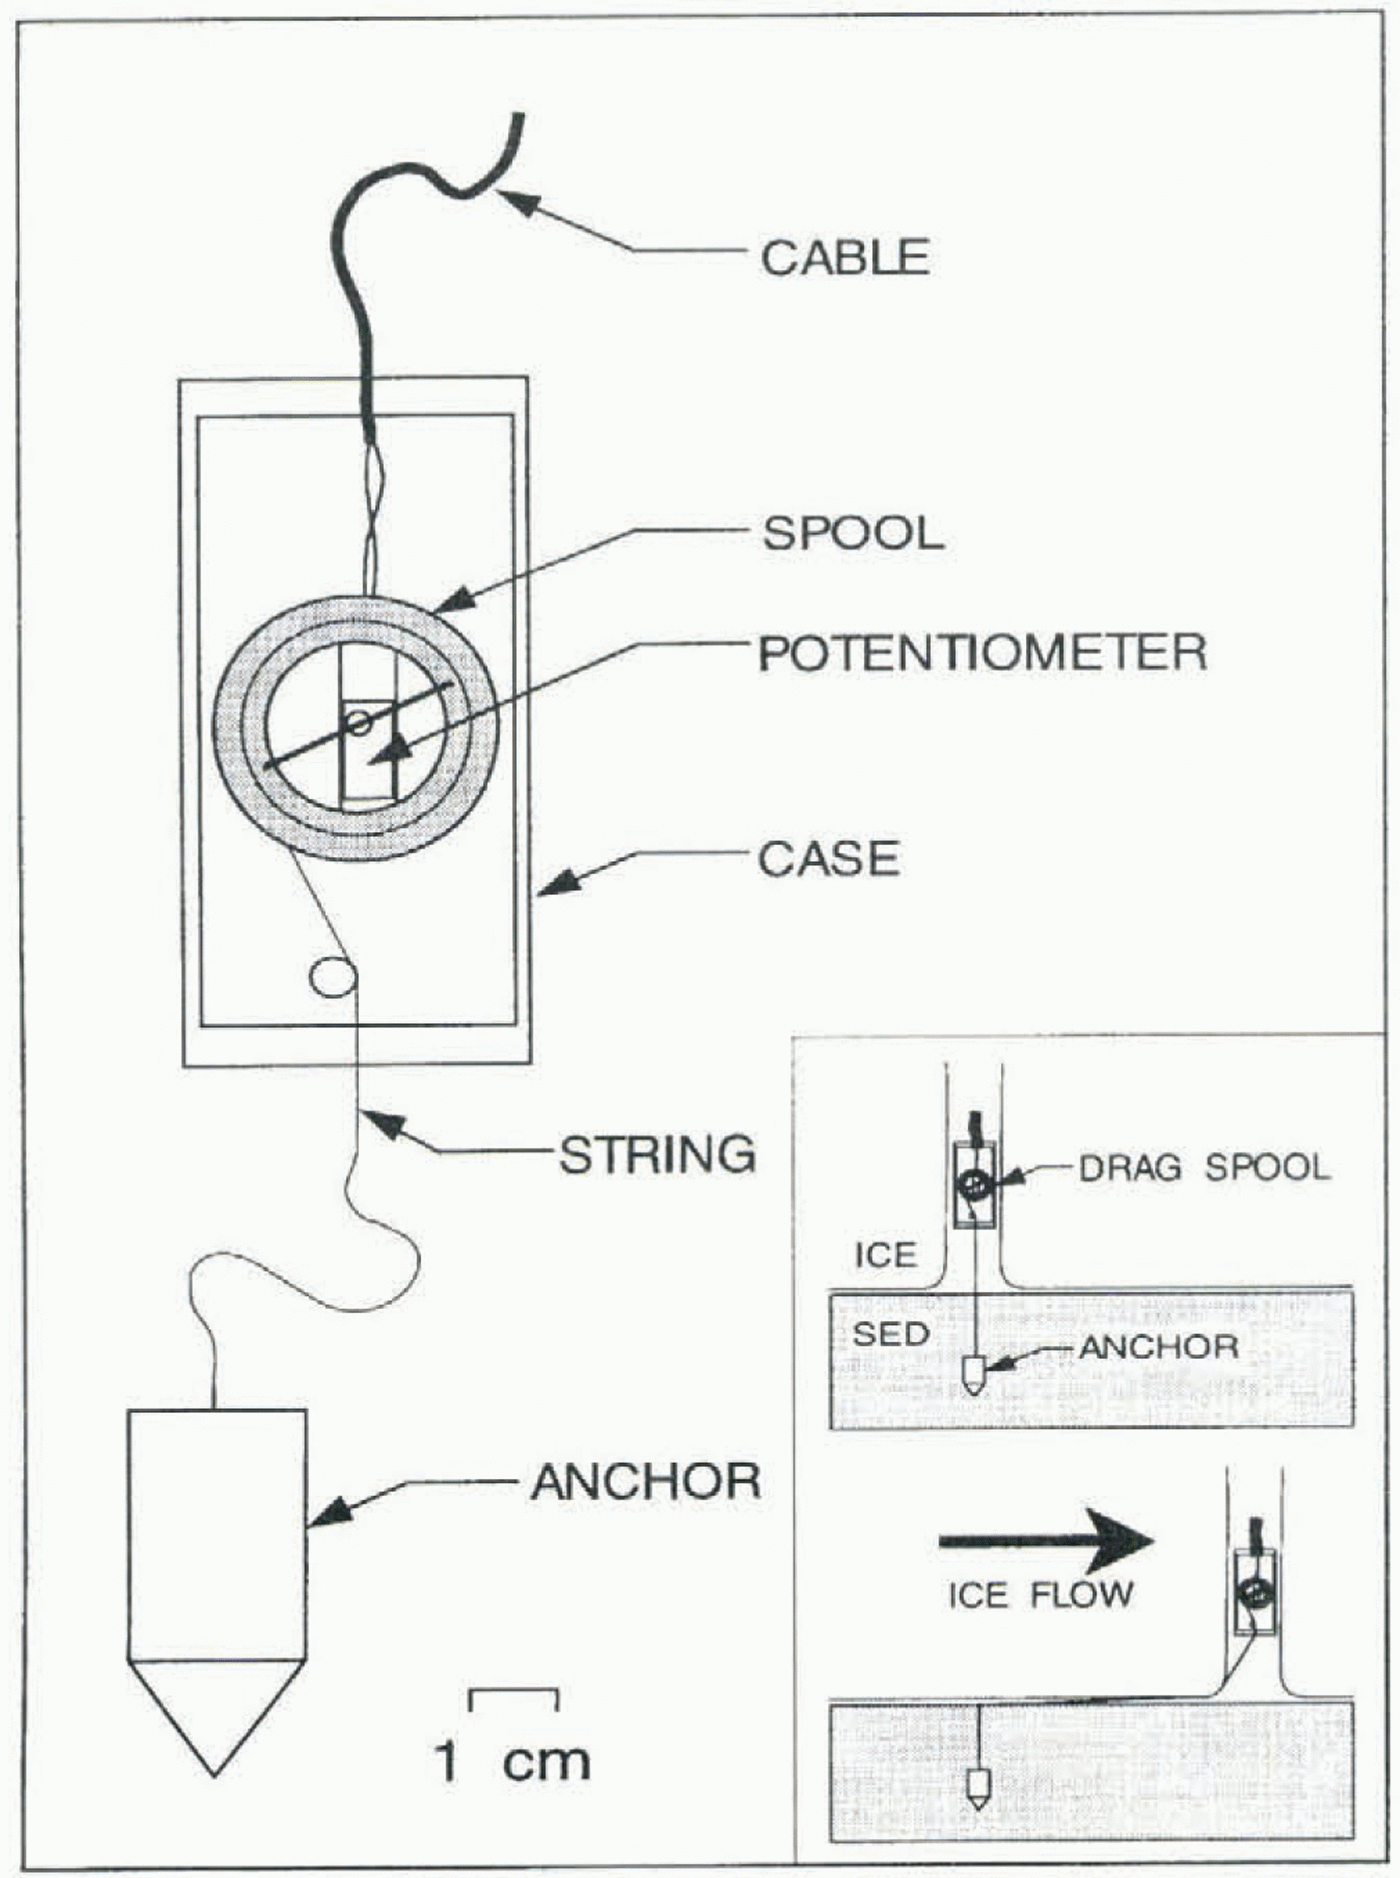
Glaciers that rest on a soft bed flow by some combination of ice creep, basal sliding and subglacial sediment deformation (Alley, 1989). The processes that control the partitioning of the basal motion between sliding and sediment deformation depend strongly on the mechanical and hydrological coupling at the ice/bed interface. It is generally accepted that there is a strong correlation between subglacial water pressures and both sliding (Kamb and others, 1985; Iken and Bindschadler, 1986; Kamb and Engelhardt, 1987; Hooke and others, 1989) and sediment deformation (Boulton and Hindmarsh, 1987; Iverson and others, 1995). However, the complex links between changes in subglacial water pressure and variations in basal drag, sliding and sediment deformation remain poorly known and require further study. To this end, we have developed an instrument, termed a “drag spool”, to measure basal sliding of Trapridge Glacier, Yukon Territory, Canada. The device consists of a multi-turn potentiometer connected to a spooled string (Fig. 1). The drag spool is suspended within the borehole close to the glacier bed, and continuously measures the length of string paid out to an anchor in the bed (Fig. 1, inset). Detailed information on the construction and installation of this device is given in Blake and others (1994).
Simultaneous measurements of subglacial water pressure and basal sliding during the 1992 field season on Trapridge
Schematic diagram of the drag spool. As the string attached to the anchor is paid out, the potentiometer screw is turned and resistance change can be measured. Inset illustrates drag-spool operation.

Glacier show that a diurnal signal in the drag-spool record appears to be correlated to fluctuations in water pressure. This correlation suggests that mechanical conditions at the bed vary temporally in response to changes in the basal water system (Fischer and Clarke, 1994b; Fischer, 1995). A noteworthy feature of our data is the apparent 90° phase shift between water pressure and sliding rate which implies that the largest sliding velocities occurred when subglacial water pressures were rising rather than at times when pressures reached their maximum as is commonly observed (Kamb and others, 1985; Iken and Bindschadler, 1986; Kamb and Engelhardt, 1987; Hooke and others, 1989).
In this paper, we describe a theoretical model for the sliding motion of ice over a surface having a basal drag that varies temporally in response to fluctuating subglacial water pressures. Our model calculations indicate that the unexpected relationship between water pressure and glacier sliding velocity can be satisfactorily explained in terms of a stick–slip sliding process at the glacier base.
Observations
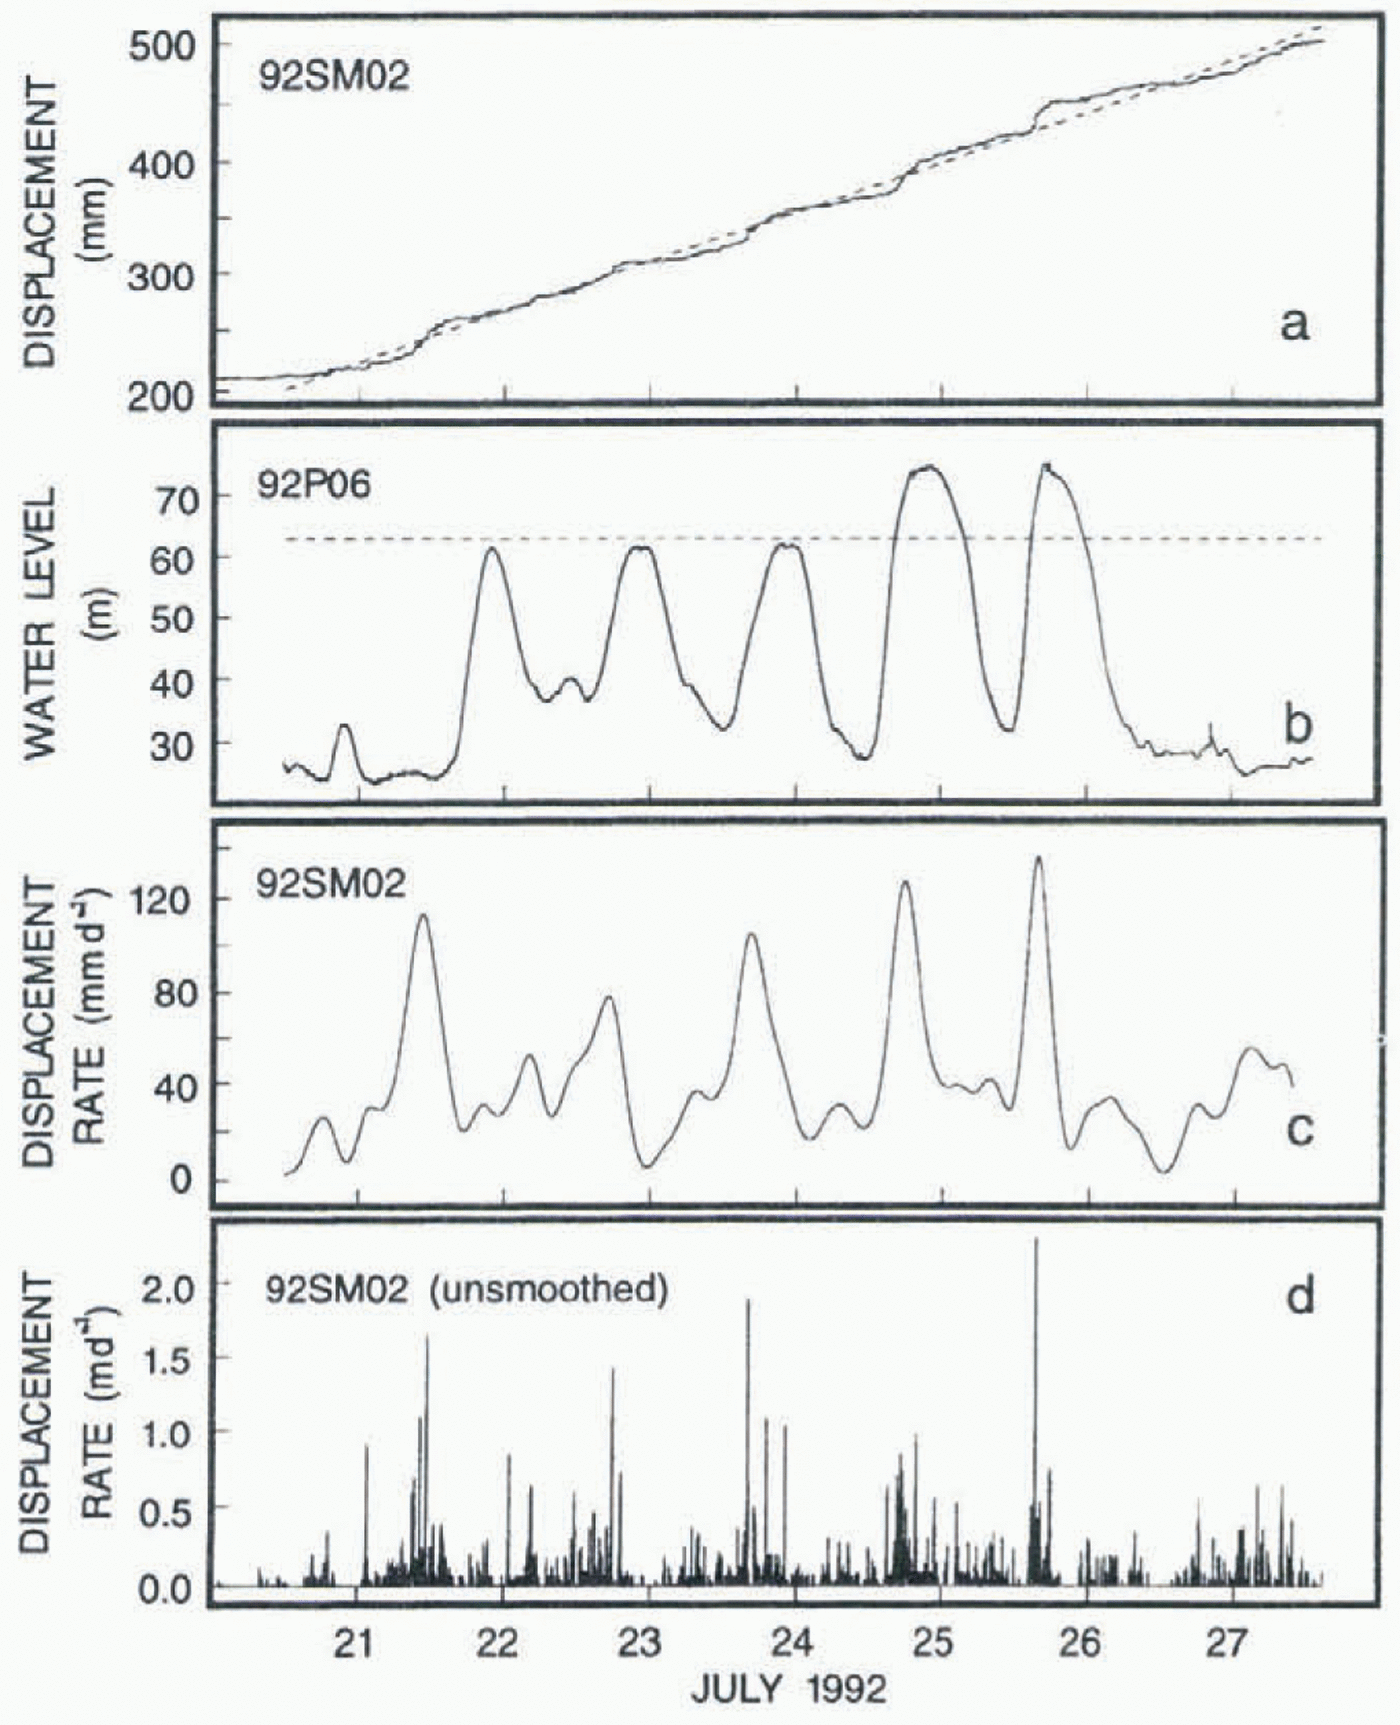
Figure 2 shows 7 d of data obtained from drag spool 92SM02 and pressure sensor 92P06 during the 1992 summer field season on Trapridge Glacier. The location and a detailed description of the Trapridge Glacier study area are given in Clarke and Blake (1991). During the course of these measurements,
Data from drag spool 92SM02 and pressure sensor 92P06 (see text for details), (a) General increasing trend (dashed line) obtained by linear regression, superimposed on the relative displacement between anchor and drag-spool case (solid line). (b) Subglacial water-pressure record. Flotation pressure corresponds to a water level of roughly 63 m (dashed line), (c) Rate of displacement between anchor and drag-spool case, obtained by numerical differentiation of the displacement record. (d) Same as (c) but unsmoothed.
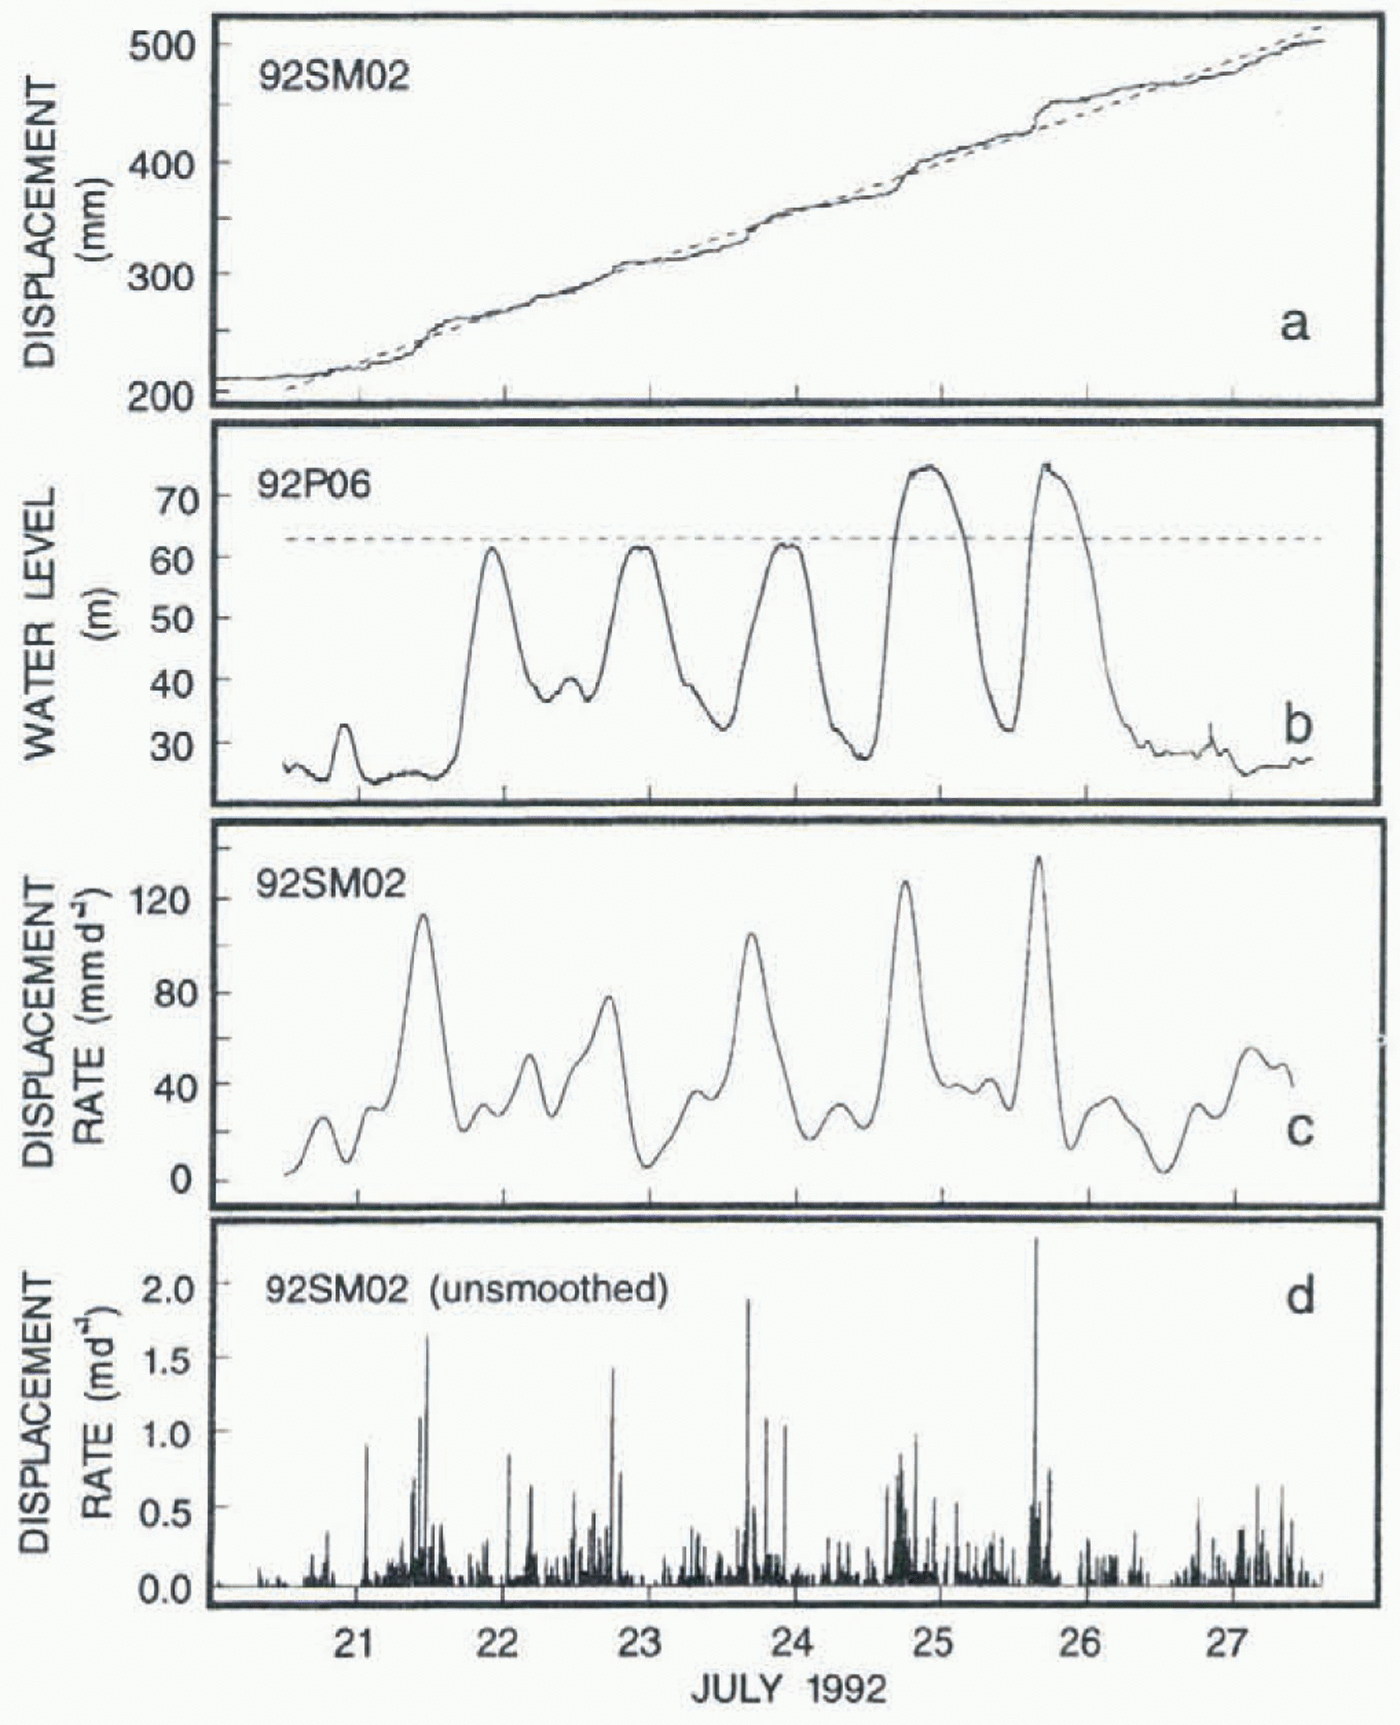
we collected data at 2 min intervals. We estimate that the anchor was inserted ~18 cm into the basal sediment (Blake and others, 1994). The data (Fig. 2a) indicate that the anchor was displaced from the drag-spool case on average by roughly 43 mm d–1. Furthermore, the displacement record (solid line) shows distinct diurnal variations superimposed onto a general trend of increase (dashed line) as obtained from linear regression. Strong diurnal fluctuations in subglacial water pressure (92P06; Fig. 2b) were contemporaneously observed in a borehole located approximately 12 m up-flow from drag spool 92SM02 and appear to be correlated with the variations in the displacement record.
Interpretation
In an earlier paper (Blake and others, 1994), we presented two alternative interpretations in an attempt to explain the available data. The stepwise increase in displacement seen in the drag-spool data (Fig. 2a) could indicate either an increase in sliding velocity or a vertical glacier uplift due to growing water-filled cavities at the glacier bed — in response to a rise in subglacial water pressure. Although we concluded that the diurnal character of the drag-spool data is mostly a result of variable sliding velocity, we could not completely dismiss the possibility of fluctuating bed separation.
We computed the sliding velocity (rate of displacement; Fig. 2c) by applying a five-point first-derivative filter to the displacement record (Abramowitz and Stegun, 1965, p. 914), followed by a Gaussian smoothing filter having a standard deviation of 100 min. Comparison of figure 2b and c shows that peak displacement rates coincide with rises in water pressure. This result contrasts with observations by Kamb and others (1985), Iken and Bindschadler (1986), Kamb and Engelhardt (1987) and Hooke and others (1989) where peak subglacial water pressure and peak surface velocity (and by implication basal sliding velocity) appear to coincide. However, if increases in subglacial water pressures coincide with the growth of water-filled cavities at the glacier bed, then a viable interpretation of the apparent 90° phase shift between water pressure and sliding rate may correspond to numerical results by Iken (1981) suggesting that maximum horizontal velocities coincide with times when basal water-filled cavities are growing. This interpretation agrees with observations at Unteraargletscher (Iken and others, 1983) showing that the highest horizontal velocity occurred when the rate of upward motion of the ice was largest rather than when the uplift reached its maximum.
Unfortunately, the heavy smoothing required to clarify the velocity record (Fig. 2c) masks finer detail that might illuminate the motion mechanism. The unsmoothed displacement rate record (Fig. 2d) suggests the idea that a localized stick-slip relaxation process is at work. As water pressure rises (Fig. 2b), a local strain build-up in the ice is released and the sliding rate increases momentarily; this small rapid motion produces δ-function-like spikes in the velocity record as shown in figure 2d. Once the finite relaxation has occurred, further rises in water pressure do not produce additional enhancement of basal sliding.
On a cautionary note, the δ-function-like pulses in sliding velocity (Fig. 2d) would be indistinguishable from stick–slip behaviour of the drag spool. Such behaviour of our instrument might result from the physical set-up during operation: a “sticky” spool being suspended by an “elastic” However, laboratory tests showed that the force required to unwind the spool is small (~1 N) (Blake and others, 1994) and not sufficient to significantly stretch the drag-spool cable. We therefore believe that stick–slip behaviour of the instrument is unlikely to be the cause of the spikes in the velocity record.
A simple model for stick–slip behaviour is a slider block pulled by a spring. Slider-block models have been used to simulate fault behaviour, foreshocks, aftershocks, and pre-and post-seismic slip (Cao and Aki, 1986; and references therein), and to explain earthquake statistics (Rundle and Jackson, 1977). The block is constrained to move horizontally along a plane surface. It interacts with the surface through friction, which prevents sliding of the block until a critical value of the pulling force is reached. The block sticks, and the force in the spring increases until it equals the frictional resistance to sliding on the surface; then slip occurs. The extension of the spring is analogous to elastic strain in rock adjacent to a fault. The slip is analogous to an earthquake on a fault. The stored elastic strain in the spring is relieved in analogy to the elastic rebound on a fault.
The stick–slip relaxation process postulated for the glacier bed resembles the behaviour of a fault. We can therefore draw analogies between the extension in the spring and the build-up of elastic strain in ice as well as the slip of the block and the momentary enhancement of basal sliding. Bahr and Rundle (1996) used a stick–slip model consisting of hundreds of blocks that are connected by nearest neighbour springs to carry out a statistical mechanical treatment of the sliding process beneath glaciers. The slider-block simulations showed that as basal water pressure increases, a block which overlays a region with higher friction will build up elastic strain as other blocks around it slip forward. Eventually the large strain will cause the block which has resisted failure to suddenly slip. Although the block may continue to slip as the water pressure continues to rise, its highest velocity will be during the initial release of stored elastic strain that occurred before water pressure reached its maximum (Bahr and Rundle, 1996). The model, therefore, produces the desired result, but, due to the non-dimensional approach, the analogy between glacier mechanics and the physics of the model may lack precision.
Elastic block model
Our model differs from the simple spring-block model described above and the stick–slip model consisting of hundreds of interacting blocks used by Bahr and Rundle (1996) in that it incorporates physically based mechanics. By choosing model parameter values that pertain to the ice rheology, basal stress and strain rates, we hope to approximate conditions of real glaciers. Below, we compute the motion of ice that is purely elastic and slides over an elastic substrate. The resistance to sliding along the ice/substrate interface is allowed to vary temporally in response to fluctuating subglacial water pressures. We begin by looking at our visualization of the bed beneath Trapridge Glacier.
ice/bed contact
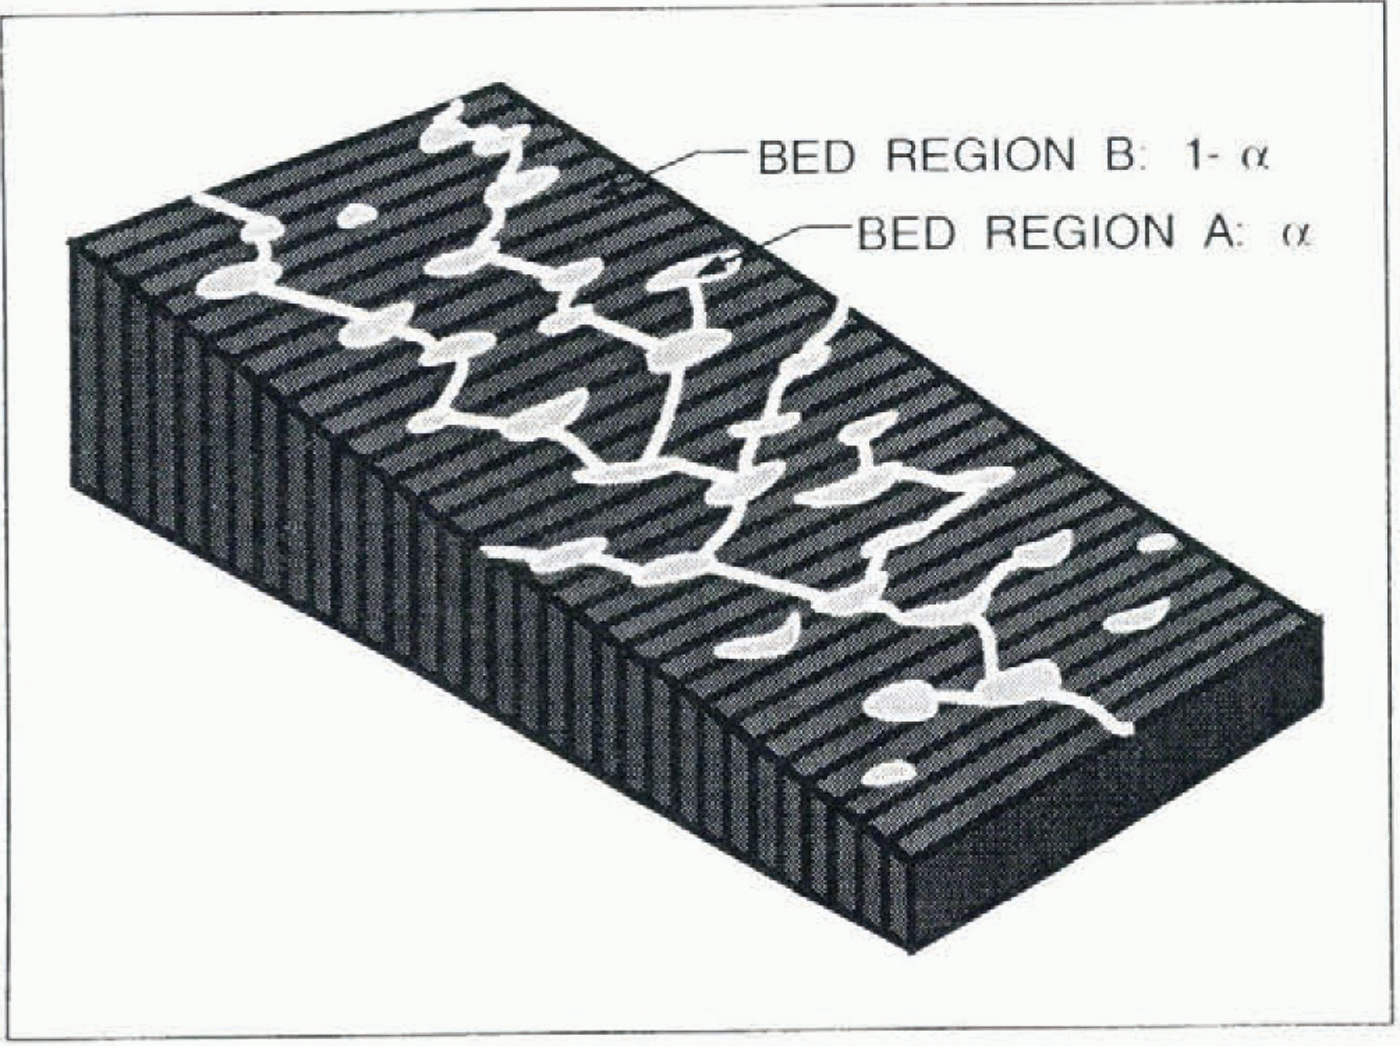
Murray and Clarke (1995) described the ice/bed contact beneath Trapridge Glacier as a thin macroporous horizon, a layer consisting of granule- and pebble-sized clasts between the glacier ice and the underlying matrix-rich sediments. Depending on local conditions the intergranular pore space in this horizon is occupied by water or ice. As a result, we can identify at least two distinct components of the subglacial water system, which we refer to as the connected and unconnected water systems. Meltwater that reaches the bed through crevasses or moulins from the glacier surface or water that originates at the bed by melting due to frictional or geothermal heat is evacuated from the glacier bed through the connected water system. We visualize this water as flowing through the pore space of the macroporous horizon in a drainage configuration that consists of hydraulically linked patches (Fig. 3). The remainder of the glacier bed is covered by the unconnected water system. Here, ice penetrates into the pore space of the horizon, possibly interspersed with isolated pockets of water which are not in communication with other free water in the subglacial water system. With the two components of the subglacial water system, we effectively divide the glacier bed into two regions. Let α be the fractional area of bed which is covered by the connected system. We shall refer to this part of the bed as region A. Consequently, the area fraction of the bed which is covered by the unconnected system, referred to as region B, is 1 – α. Despite our belief that the areal coverage of the connected region can increase as rising water pressures cause local uplift of ice in the vicinity of a connected water channel, we assume α to be constant in the following analysis.
Conceptual diagram of the ice/bed contact beneath Trapridge Glacier. Bed region A is covered by the connected water system, while bed region B is covered by the unconnected water system. The fractional areas of these two regions are α and 1 – α.

Description of model
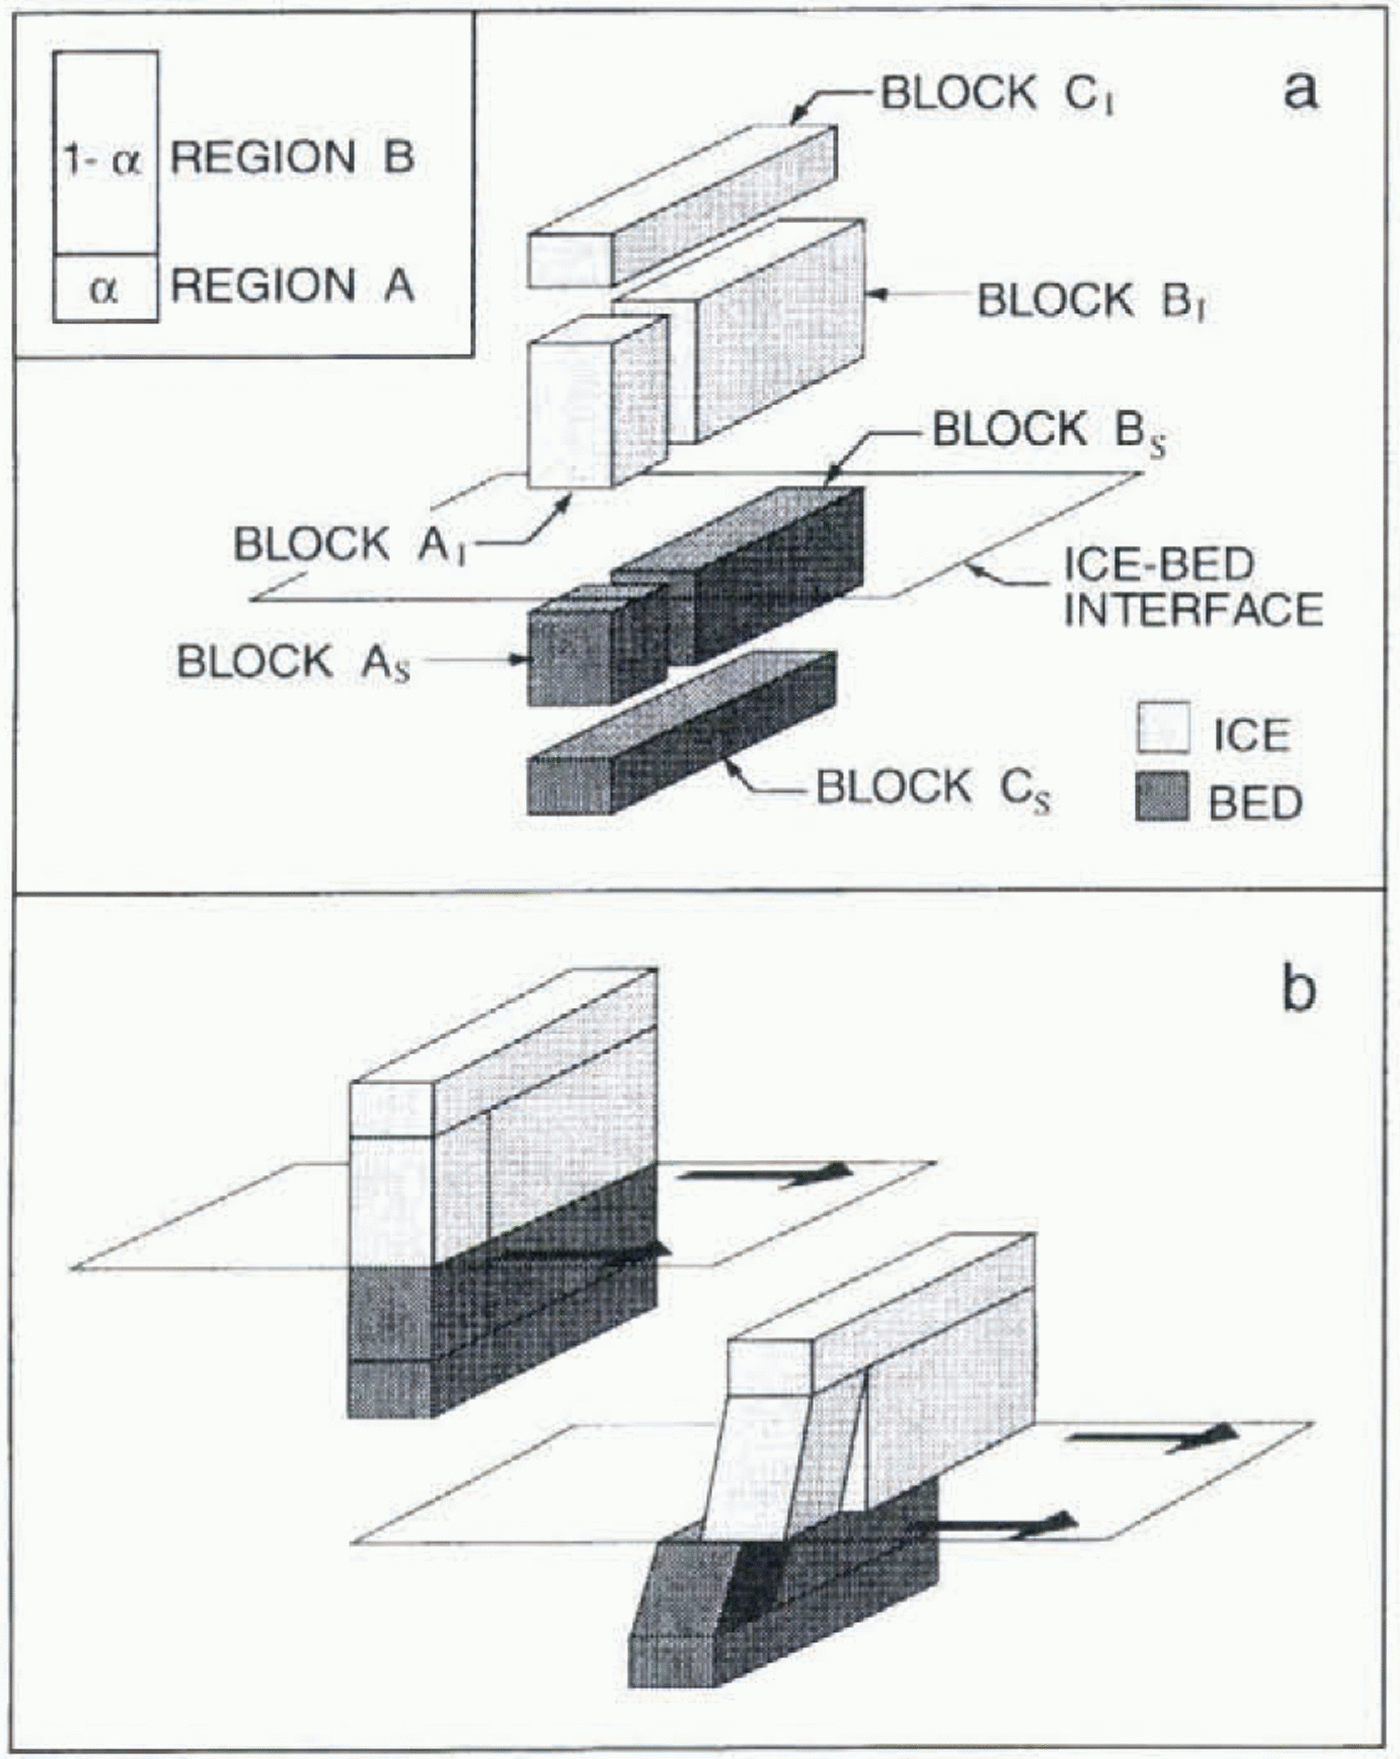
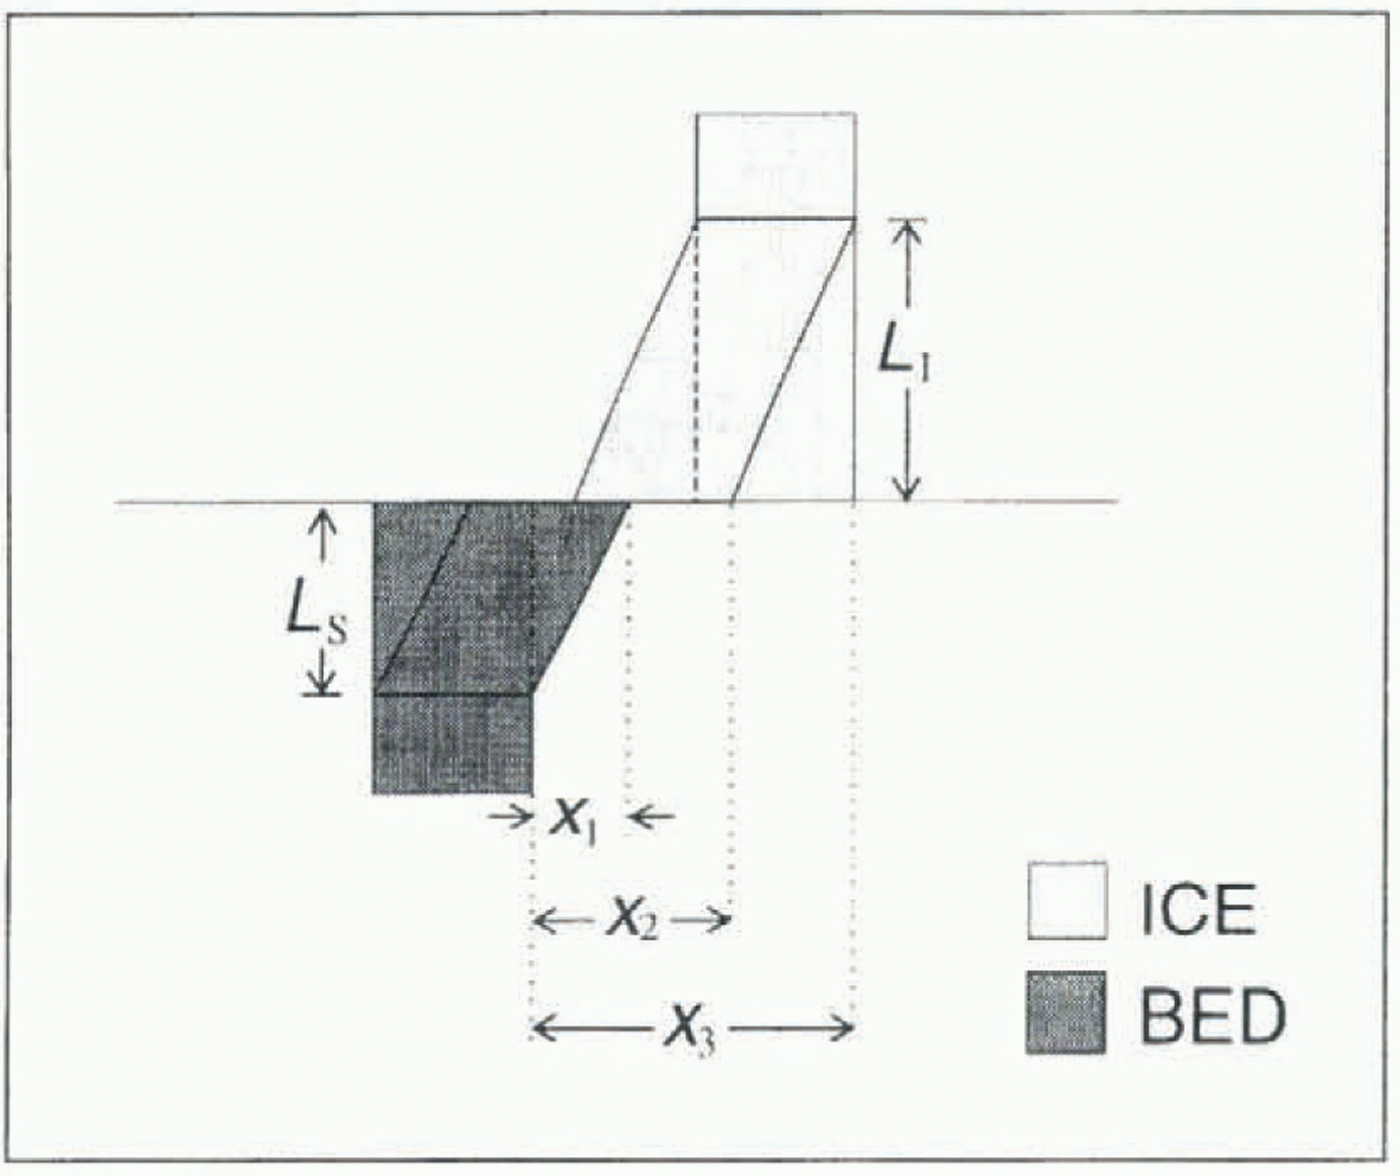
Instead of modelling ice flow over a complex glacier bed such as the one shown in Figure 3, we take a simplified approach and represent the glacier/substrate interaction by a system consisting of three ice blocks and three substrate blocks (Fig. 4a). Block A1 represents the parts of the glacier that slide over the connected region of the bed with area fraction α, while block B1 represents all the ice that slides over the unconnected region of the bed with area fraction 1 – α. At the top, block A1 and block B1 are attached to block C1. In this way the two blocks are coupled to each other, but otherwise are allowed to deform and thus move independently. We can view blocks A1 and B1 as being hinged to block C1. The height of block A1 and block B1
Schematic diagram of the elastic black model. (a) Building-blocks of the model consisting of a system of three ice blocks and a similar system of three substrate blocks separated by the ice/bed interface. Inset shows a plan view indicating the area fractions that represent the connected and unconnected regions of glacier bed. (b) Behaviour of blocks as the glacier slides along the ice/bed interface. Subglacial water pressure is assumed to be low, implying a high resistance to sliding for block A1 due to strong local ice/bed coupling.

represents what we call the “strain equilibration distance”. This is the distance above the bed at which strain differences within the glacier disappear and all the ice moves at the same rate. Below the ice/bed interface, the ice blocks are opposed by a similar system of substrate blocks As, Bs and Cs.
We first consider the basal water pressure to be low in the connected region of the glacier bed. In terms of our block model, a poorly lubricated ice/bed interface implies a high resistance to sliding for block A1 because there is a strong coupling between blocks A1 and As. As a result the two blocks start to deform under the applied shear stress imposed by block B1, which continues to slide (Fig. 4b). When subglacial water pressure rises in the connected region, block A1 becomes decoupled from block As due to increased lubrication of the bed. At this point, any elastic component of the deformation can be recovered, i.e., block A1 snaps forward while block As snaps backward.
Mathematical formulation
We consider a glacier of thickness h1 that flows over a horizontal bed. The x axis is directed in the glacier flow direction and the z axis is vertical, pointing positive upward through the ice. With the two bed regions A and B as introduced above, the basal shear stress

can be unevenly distributed on the bed so that

where p1 is the density of ice, g is the gravitational acceleration, θ is the surface slope of the glacier, and σA and σB represent the basal shear stresses in regions A and B, respectively. In the following we base our analysis on the assumption that glacier flow obeys the linear sliding law

where V b denotes the basal sliding velocity and f is a drag coefficient. With reference to Figure 5 we can then write down expressions for the shear stresses on region A,

and region B,

where f A and f B are the drag coefficients for the connected and unconnected regions, respectively, of the glacier bed.
Furthermore, we consider that blocks A1 and S only
Side-view of ice and substrate blocks showing dimensions and displacements of blocks.
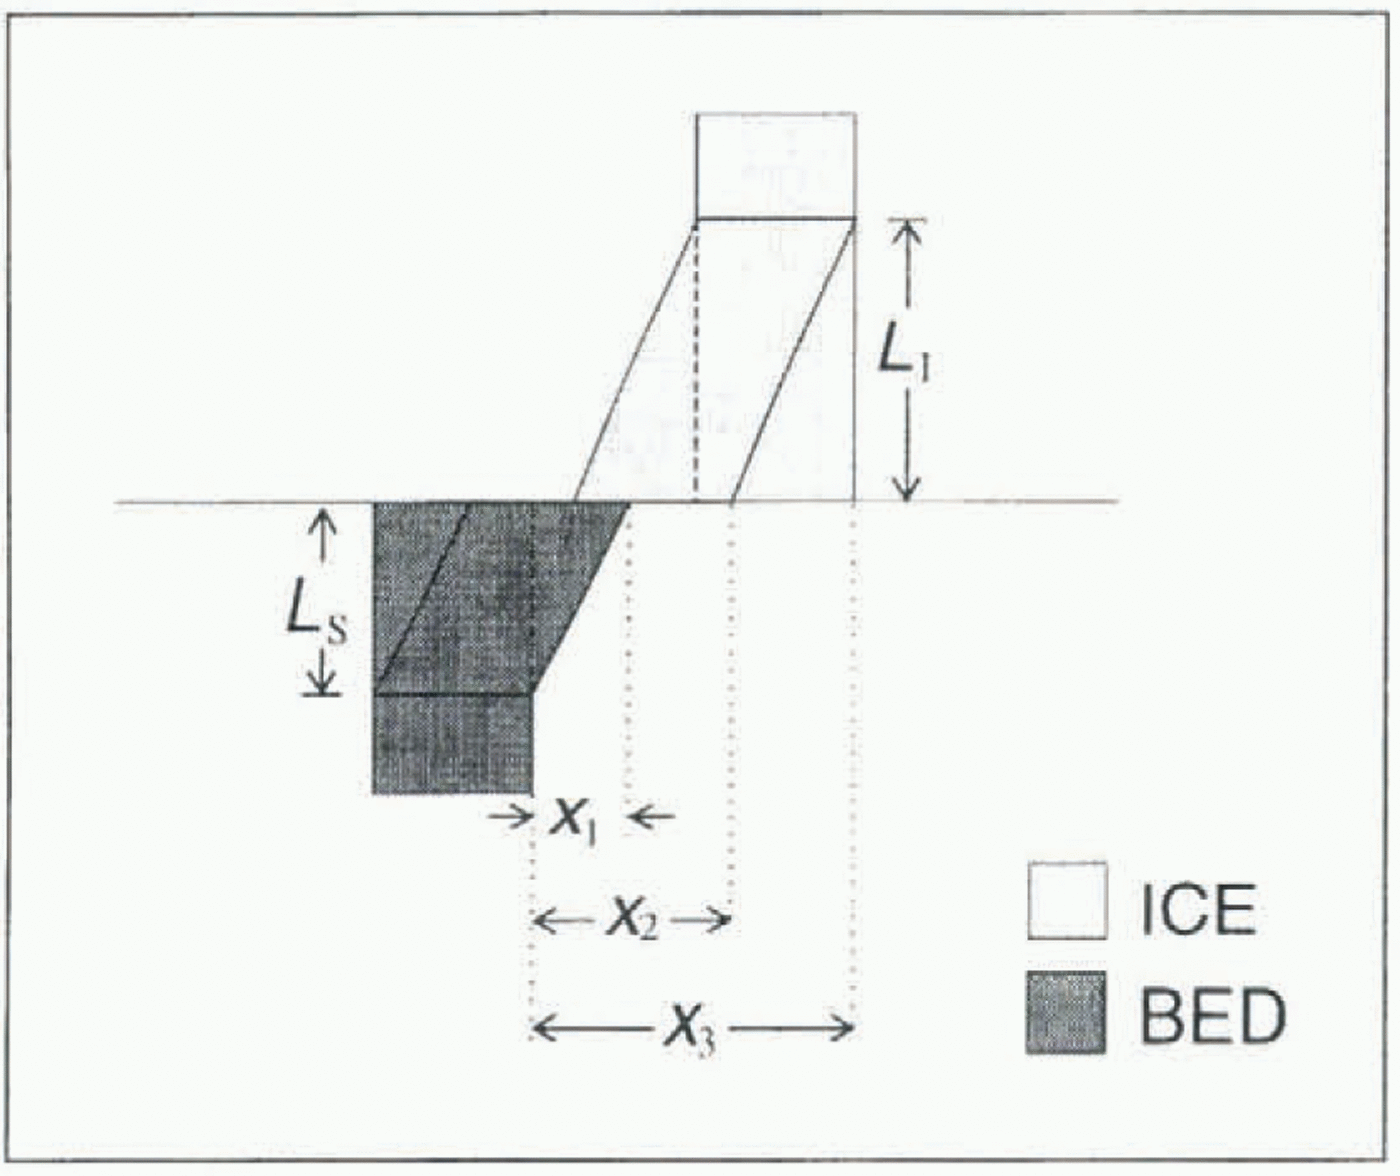
deform elastically and completely ignore any creep deformation within the ice and viscous deformation of the sediment. As will be shown in the Discussion section, this simplification is a shortcoming of the model. Nevertheless, with this assumption and noting that L1 and LS are the strain equilibration distances in the ice and the substrate (see Fig. 5), we can easily write down stress–strain relations for block A1,

and blocks AS
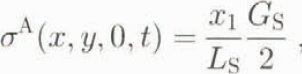
where G1 and GS denote the shear moduli of ice and substrate.
Substitution of Equations (6) and (7) into Equation (4) yields an equation which describes the motion of block A1 with respect to block AS:
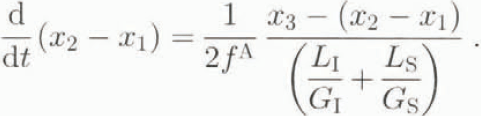
To obtain the corresponding equation of motion for block B1 we substitute Equations (5) and (8) into Equation (2):

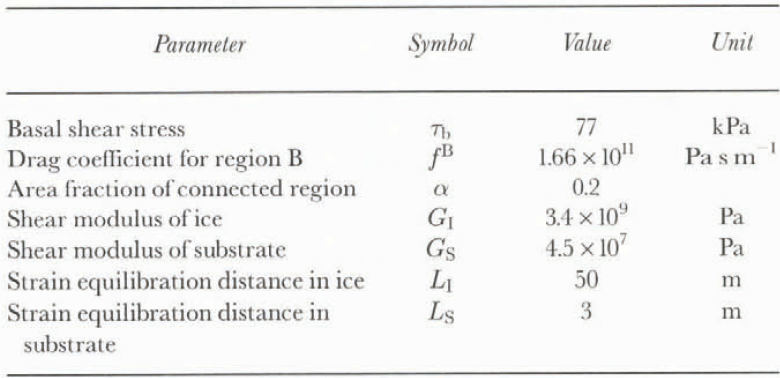
Parameters for elastic block model
Model results
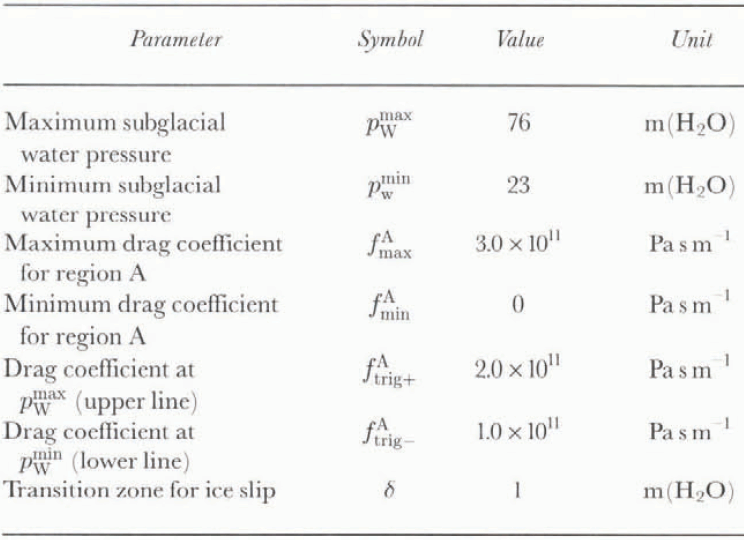
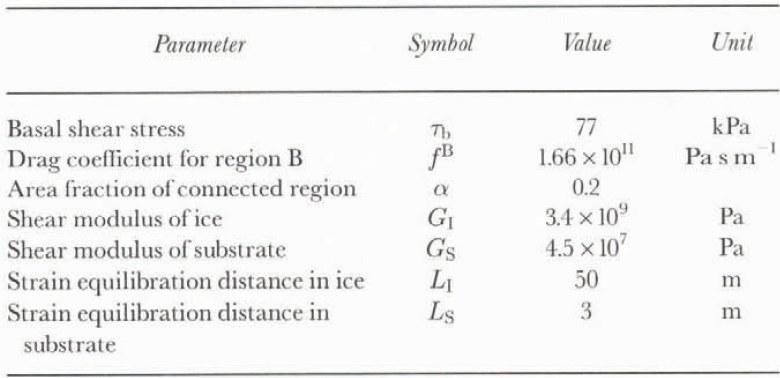
Table 1 summarizes the model parameter values that were used to obtain the calculated solutions, Using an ice thickness of h 1 = 72 m, a surface slope of Ø = 7° (Clarke and Blake, 1991; Blake, 1992) and a density of ice of p 1 = 900 kg m–3 substituted into Equation (1), we calculated a mean basal shear strees of т b = 77 k Pa beneath our study site. The drag coefficient for the unconnected region of the glacier bed was taken to be essentially an average constant value, f B = 1.66 x 10 11 Pa s m–1, as obtained by substituting an average basal sliding velocity of υ b = 40 mm d–1 into Equation (3). The areal distribution of connected and unconnected regions of the bed beneath Trapridge Glacier can be estimated from our drilling programme, About 20–25% of holes drilled with a spatially random distribution across our study site to the glacier bed appear to connect to the subglacial water system. We therefore assigned α = 0.2 for the area fraction of the connected region in our model calculations. Elastic properties of ice are reasonably well known. Hobbs (1974, p. 258) and Sinha (1984) list values of the shear modulus of ice in the range 3.36 to 3.80 x 10⁹ Pa. For our model calculations, we used G 1 = 3.4 x 10⁹ Pa. In contrast, elastic properties of soils are less well constrained. The shear modulus is found to depend on stress state as well as stress history of the particular soil sample (Yu and Richart, 1984). Typical values for sands and clays easily span one order of magnitude. An estimate of the shear modulus of Trapridge sediment can be calculated from the results of seismic reflection studies conducted on Ice Stream B, Antarctica (Blankenship and others, 1986, 1987). The shear wave velocity of υ s = 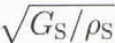 yields a theoretical estimate of the shear modulus of the substrate G S = 4.5 × 10⁷ Pa. The values for the strain equilibration distance in ice and in the substrate were determined on a trial-and-error basis to yield the final results. In any case, the values for equilibration seem to have a plausible order of magnitude.
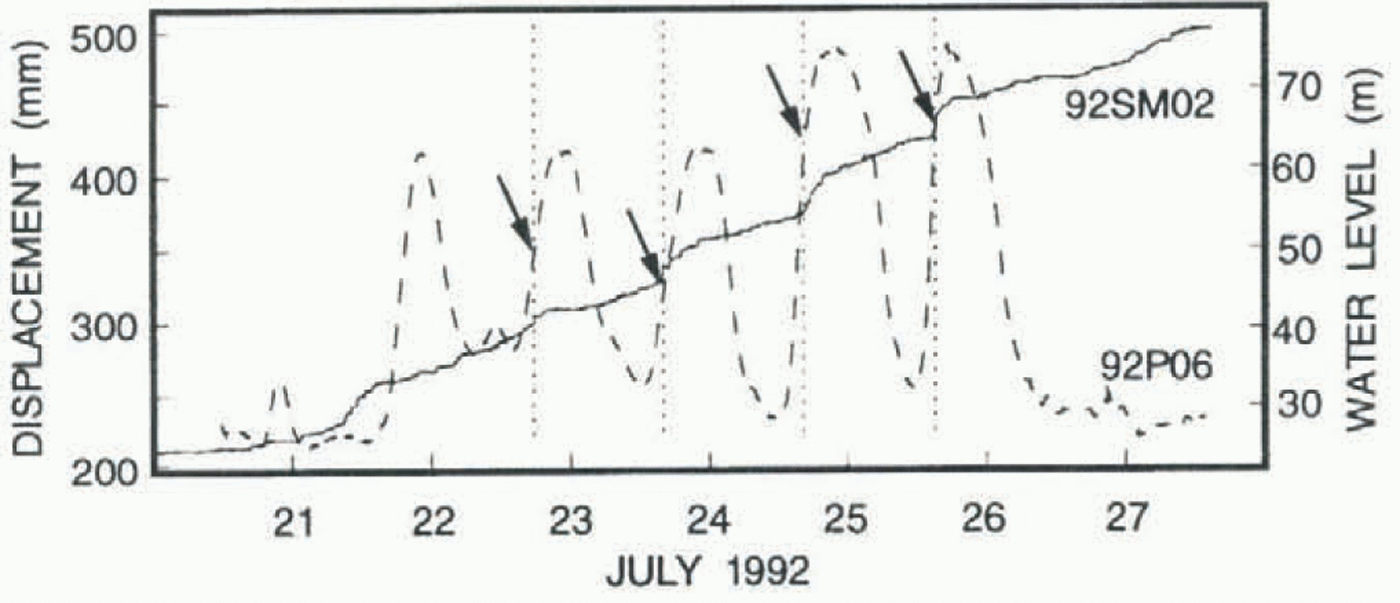
To simulate the variable resistance to sliding in the connected region of the glacier bed in response to varying subglacial water pressures, a pressure dependence was included in the calculation of the drag coefficient f A. However, from inspection of figure 2a and b, we note that the strain buildup in the ice is only released after a certain threshold level of subglacial water pressure has been reached. For this reason, a simple linear inverse relationship between drag coefficient and subglacial water pressure is not appropriate for our model calculations. Figure 6 shows a composite plot of data from pressure sensor 92P06 (Fig. 2b) and displacement record from drag spool 92SM02 (Fig. 2a) where we have also
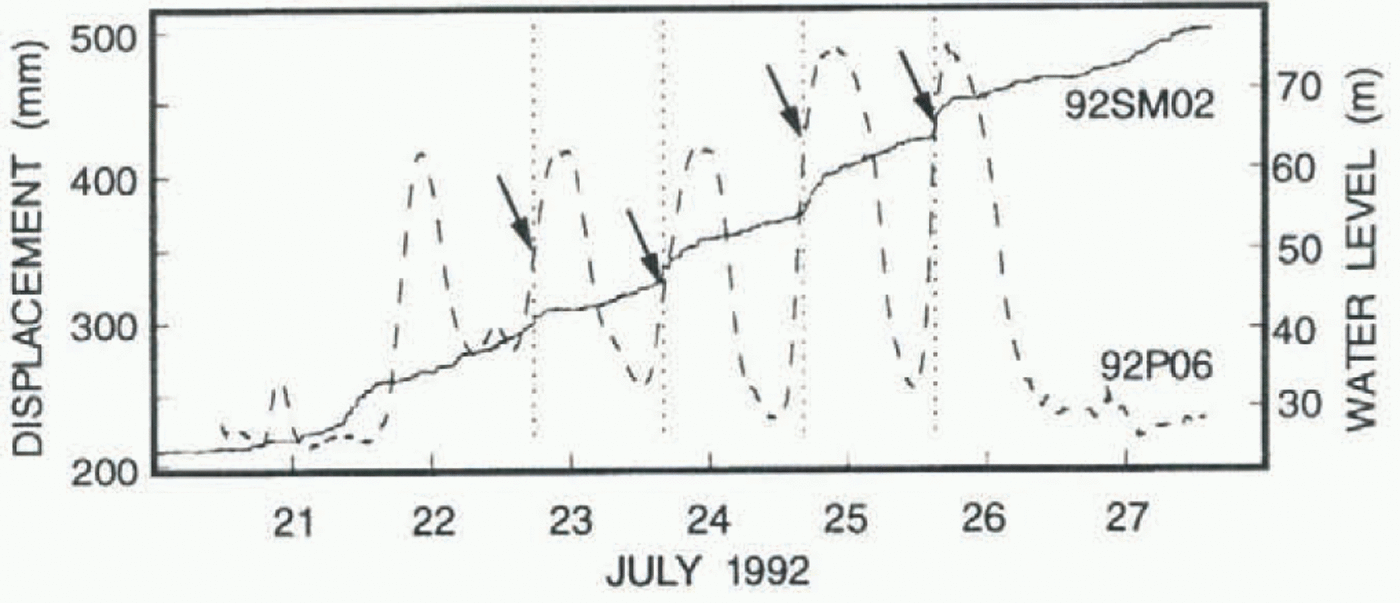
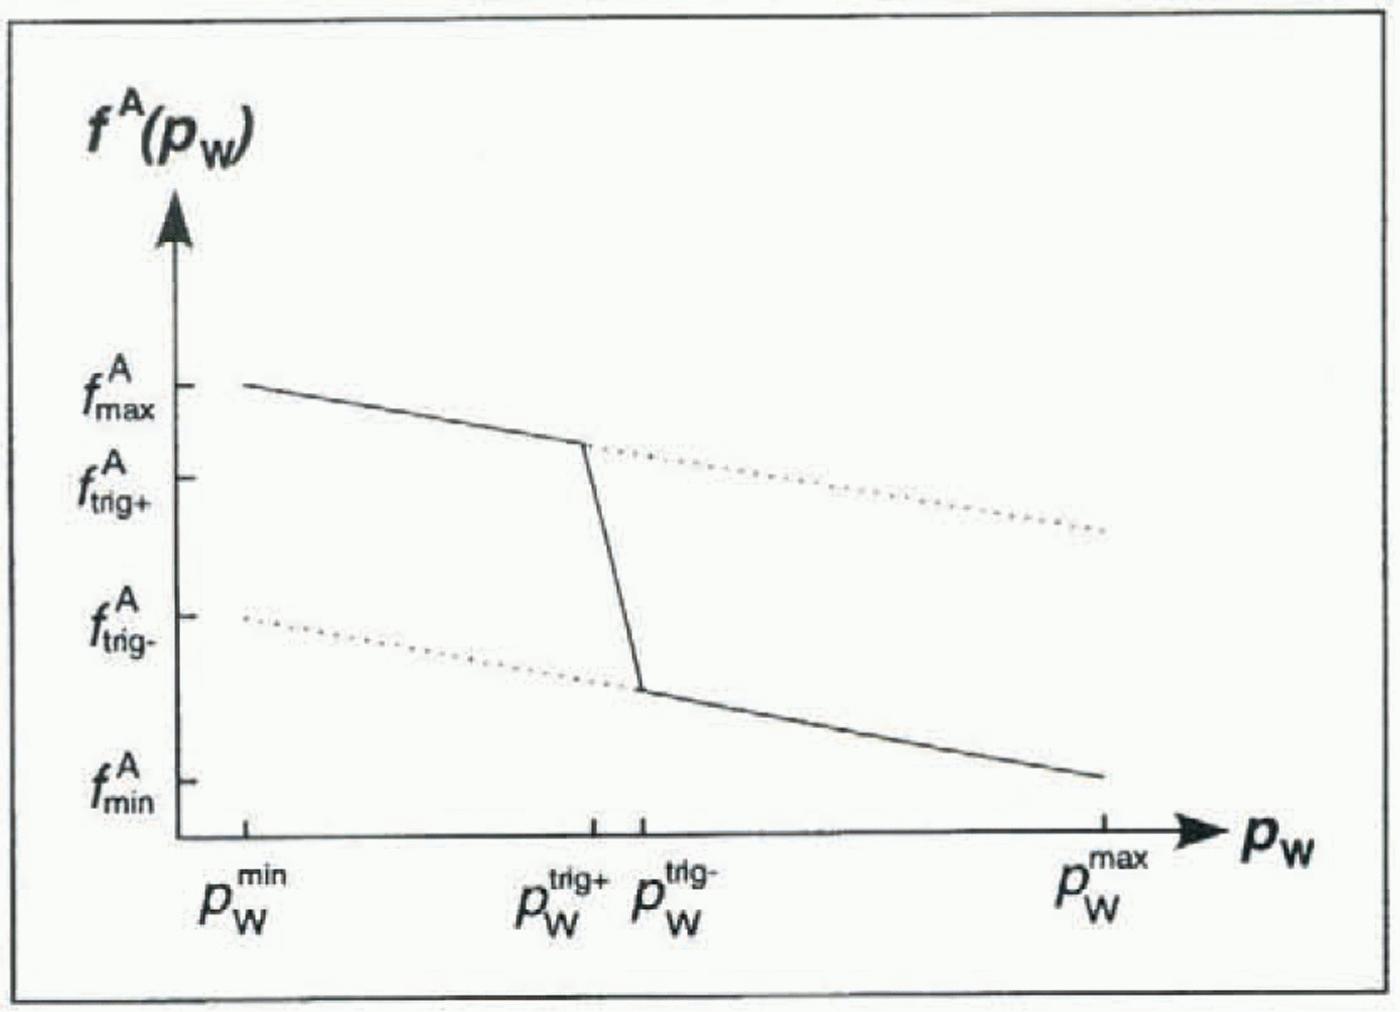
identified the strain release events by arrows. Examination of these strain release events shows that these occur over a range of water pressures and there is no clearly defined trigger level at which ice slip is initiated. We are not perplexed by this behaviour, because the slip condition is probably stochastic rather than deterministic, so that each slip event is distinct from previous ones. Due to our inability identify an obvious condition for strain release, we take the trigger levels of water pressure for ice slip initiation as known a priori. We incorporated the strain build-up followed by the slip initiation by calculating the drag coefficient as a function of subglacial water pressure, f A (PW), as follows (Fig. 7):

where  denotes the threshold level for slip initiation,
 is the transition zone over which most of the ice slip occurs and (secTable 2 for parameter values)


Relationship between the drag coefficient for the connected region of glacier bed fA and subglacial water pressure

PW (see text for details).
Parameters for calculation of drag coefficient for region A
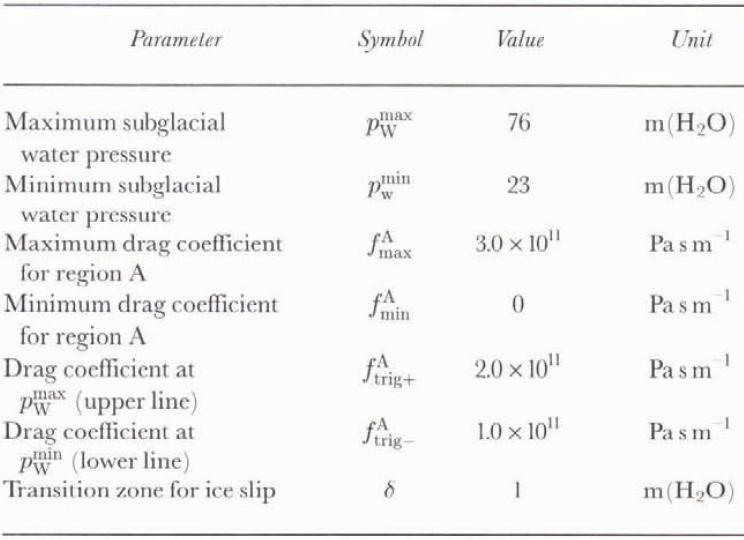
For water pressures below the trigger level  , the drag coefficient does not change significantly; once the water pressure reaches the trigger level, there is a dramatic drop in drag coefficient (Fig. 7). The threshold level for slip initiation can be altered by shifting the steep section (transition zone) in Figure 7 along the water pressure axis.
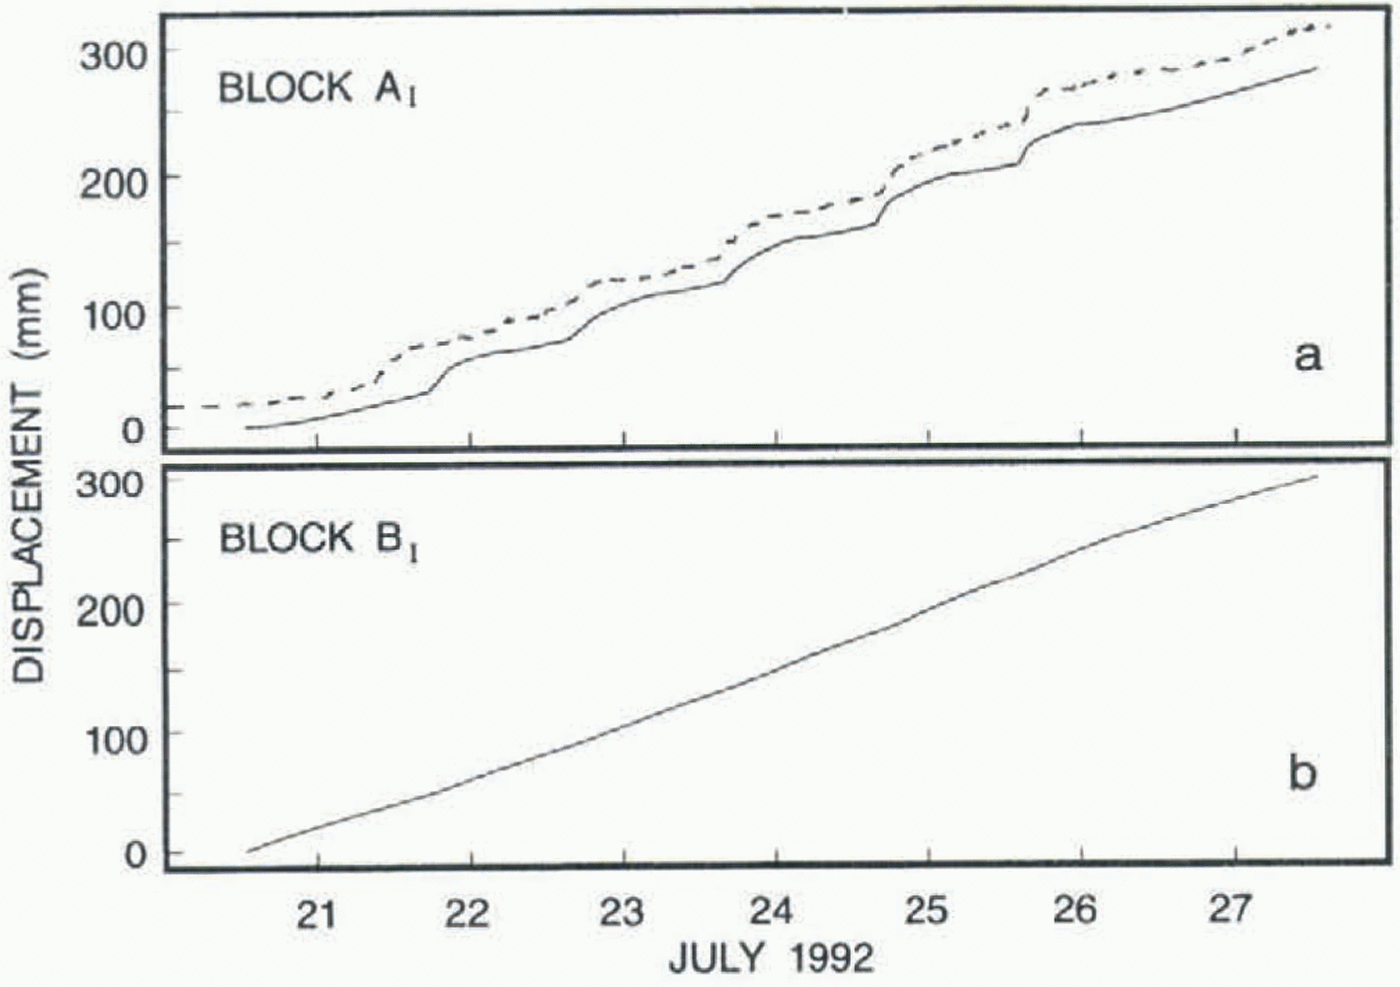
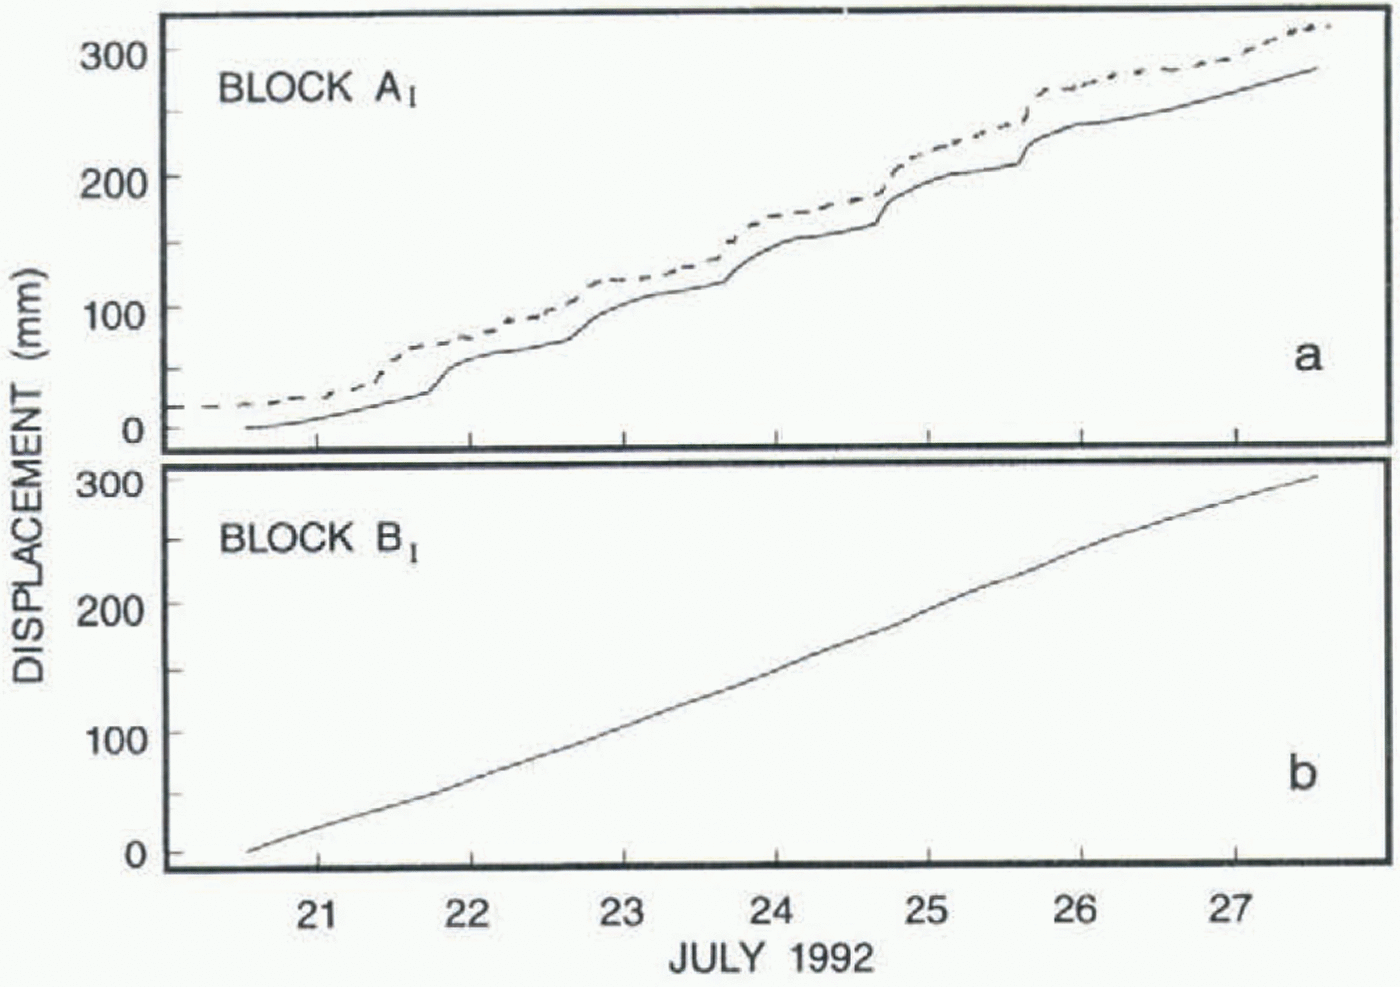
Figure 8 shows the results from our calculations using the elastic block model. The computed displacement of block A1 (Fig. 8a) displays a remarkable similarity to the field data from 92SM02. At the same time, the motion of block B1 (Fig. 8b) appears to be characteristic of the responses that have been recorded with other drag spools (i.e., linearly increasing displacement without distinct diurnal signal; see Blake and others, 1994, Fig. 4).
Computed displacements of (a) block At and (b) block B1. Note the similarity of the displacement record of block A1 to that measured with drag spool 92SM02 (included for comparison in (a), dashed line).
Discussion And Concluding Remarks
The assumption that glacier ice and substrate only deform elastically is certainly a gross over-simplification, because our model only takes into account the short-term responses of ice and sediment. We essentially ignore any long-term responses such as those of a Glen-law viscous fluid in the case of ice. Therefore, the question of whether viscoelastic relaxation of elastic strain proceeds so rapidly that elastic strain cannot be accumulated effectively must be examined.
To simplify the following analysis, we approximate the transient rheological behaviours of ice and sediment by assuming that both behave as viscoelastic Maxwell materials. In this case, the viscoelastic relaxation time (Malvern, 1969, p. 315) for ice is given by

And for sediment by

where η and μ denote the effective linear viscosities of ice and sediment, respectively. A theoretical estimate of the effective dynamic viscosity of ice can be obtained by combining Glen’s flow law for simple shear in the x–z plane with the stress–strain relations for a linear viscous fluid, η = 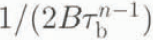 . Using a flow law parameter for temperate ice (B = 6.8 x 10–l5 s–l ka–3, n = 3 (Paterson, 1994, p. 97)) and a mean basal shear stress of т b = 77 k Pa (see previous section), we calculated a Trapridge Glacier ice viscosity of η = 1.24 x 10¹³ Pa s. Hence, for 0°C ice, Equation (14) yields a lower limit on the viscoelastic relaxation time of т 1 = 1.0 h. For Trapridge Glacier in the region of this study, the melting point is reached only near the bed, and upper layers consist of cold ire with below-freezing temperatures. Taking B = 1.6 x 10⁻¹ s–1 k Pa–1 (parameter value from Paterson (1994, p. 97) for 5°G ice) yields an upper limit on the stiffness of the flow law and gives the dynamic viscosity as η =5.27 x 10¹³ Pa s. For this colder and stiffer ice, the relaxation time increases to η 1 = 4.3 h. Similarly, we can calculate upper and lower limits on the viscoelastic relaxation time for the substrate by substituting our estimates of the linear viscosities for Trapridge sediment into Equation (15). For viscosities μ between 3.0 x 10⁹ and 3.1 x 10¹⁰ Pa s (Fischer and Clarke, 1994a), we calculated relaxation times т S ranging from 0.02 to 0.19 h.
Although viscoelastic relaxation in ice is unlikely to proceed so rapidly that the elastic strain build-up is completely cancelled out, accumulation of elastic strain in the substrate over time-scales of days cannot operate because of the short relaxation times. At first glance it might be tempting to use sediment viscosities that are an order of magnitude higher than our estimates (e.g. those inferred from work done by Boulton and Hindmarsh (1987) beneath Breidamerkur-jökull, Iceland) to calculate viscoelastic relaxation times т S of the order of hours. Concerns about the suitability of our model, however, remain. While the sediment layer beneath Trapridge Glacier is believed to be up to ~ 10 m thick in places (Stone, 1993), we think that a strain equilibration distance of L S = 3 m (see Table 1) is high because measurements of subglacial deformation (Blake and Clarke, 1989) suggest that the typical thickness of the deforming layer does not exceed 0.5 m. We could remove this concern by assuming a lower shear wave velocity which implies a softer substrate with a lower shear modulus G s. However, an already very low shear wave velocity of т s = 150 m s–1 is only found in very porous materials under low effective pressures. Although saturated with water at a high pore pressure, the porosity of the sediment layer beneath Trapridge Glacier is not believed to exceed that of Ice Stream B, Antarctica (n ≈ 0.4).
We note that our estimate of the shear modulus for the substrate G s was obtained using a method based on the propagation of shear waves and therefore represents the dynamic value. However, in our case of a deforming subglacial sediment, a static shear modulus would be more appropriate. Nevertheless, dynamic methods that are based on seismic wave propagation remain applicable in estimating elastic properties, provided we know how to relate the dynamic moduli to the moduli from static measurements. Results from investigations of the relationship between static and dynamic moduli in diabase and granite (Simmons and Brace, 1965) and sandstones and shales (Cheng and Johnston, 1981) show that the static moduli are generally lower than the dynamic ones. However, the discrepancy in moduli from static vs dynamic methods was found to be not large enough to significantly change our results.
The foregoing discussion points to a shortcoming of our model inasmuch as assumptions of pure elasticity do not approximate the behaviour of the substrate material particularly well. At the same time, our measurements indicate that sliding at the base of a glacier is unlikely to be temporally smooth, but we have no complete explanation for a stick–slip relaxation-type process in a generally viscous environment. Hydraulic disturbance of the basal material around the borehole by the hot-water drill could explain how locally viscous deformation of the substrate becomes inhibited. The washing out of the fine material as water is pumped down the borehole during the drilling process could account for a significant increase in sediment viscosity.
An attractive feature of our model is the potential ability to explain negative subglacial shear-strain rates observed at Trapridge Glacier (Blake, 1992) and Storglaciären (Iverson and others, 1995) during periods of high subglacial water pressures. The release of accumulated elastic strain in the sediment as the ice becomes decoupled from the bed due to increased water lubrication (corresponding to the backwards snapping of block AS (Fig. 4) in our model) could account for the observed up-glacier rotation of tilt sensors.
Acknowledgements
Support for this research was provided by the Natural Sciences and Engineering Research Council of Canada and the University of British Columbia. The data presented in this paper were collected in Kluane National Park. We thank Parks Canada and the Government of the Yukon Territory for granting permission to conduct field studies in the park. B. S. Waddington, S. J. Marshall and T. Murray provided advice and assistance during our field programme. We also acknowledge A. Iken and W. Lawson for improving the manuscript.