Implications
A tool that continuously measures body temperature in calves can improve the health and welfare of the animals and therefore holds implications in calf housing. This could serve as an early warning system to support the farmer in monitoring the health of his calves, particularly in critical periods and subclinical cases. A video-based IR thermography system could represent a fast and non-invasive method that can be installed in a calf feeder to automatically measure the body temperature of each animal daily.
Introduction
The rectal temperature is one of the most important disease indicators in livestock production. The procedure itself, however, is time consuming and requires direct contact with animals.
In contrast, IR thermography represents a non-invasive, contactless method to measure body surface temperature, which can be used as an indicator of core body temperature in cattle (e.g., George et al., Reference George, Godfrey, Ketring, Vinson and Willard2014). Using rectal temperature is a common method used by veterinarians and farmers; however, there are limitations to this method. Investigations showed that both the technique used when administering a digital thermometer and the thermometer type can affect the measured values (Burfeind et al., Reference Burfeind, von Keyserlingk, Weary, Veira and Heuwieser2010; Naylor et al., Reference Naylor, Streeter and Torgerson2012). Other technologies have been developed to continuously record body temperature in cattle, for example, boluses to measure the rumen temperature (Rose-Dye et al., Reference Rose-Dye, Burciaga-Robles, Krehbiel, Step, Fulton, Confer and Richards2011) and sensors to measure the milk temperature in automatic milking systems (Pohl et al., Reference Pohl, Heuwieser and Burfeind2014).
IR thermography is used to measure heat radiation from the surface of a subject and translates the radiation into a point-specific surface temperature (Kammersgaard et al., Reference Kammersgaard, Malmkvist and Pedersen2013). IR thermography has been used in recent years as a non-invasive method in many animal species as well as in humans. The method is a useful tool in predicting increases in local (Rainwater-Lovett et al., Reference Rainwater-Lovett, Pacheco, Packer and Rodriguez2009) or systemic body temperature (e.g., Johnson et al., Reference Johnson, Rao, Hussey, Morley and Traub-Dargatz2011), which can serve as a tool to assess stress in dairy cows (Stewart et al., Reference Stewart, Webster, Verkerk, Schaefer, Colyn and Stafford2007) and sport horses (Bartolomé et al., Reference Bartolomé, Sanchez, Molina, Schaefer, Cervantes and Valera2013) and to predict cow oestrus (Talukder et al., Reference Talukder, Kerrisk, Ingenhoff, Thomson, Garcia and Celi2014). Furthermore, Kammersgaard et al. (Reference Kammersgaard, Malmkvist and Pedersen2013) showed the utility of IR thermography in evaluating the thermal status of neonatal pigs. Other studies have also described a correlation between feed efficiency and IR surface temperatures in beef steers (Montanholi et al., Reference Montanholi, Swanson, Palme, Schenkel, McBride, Lu and Miller2010) and turkeys (Case et al., Reference Case, Wood and Miller2012). An increase in the local temperature was used in combination with environmental temperature monitoring as an early detection method for mastitis (Berry et al., Reference Berry, Kennedy, Scott, Kyle and Schaefer2003), to detect hoof lesions in dairy cows (Alsaaod and Büscher, Reference Alsaaod and Buescher2012) and, by measuring the foot temperatures of cattle, to detect foot-and-mouth disease (Rainwater-Lovett et al., Reference Rainwater-Lovett, Pacheco, Packer and Rodriguez2009). An increase in systemic body temperature as sign of an infection was revealed by an early increase in the eye or orbital temperatures in calves (Schaefer et al., Reference Schaefer, Cook, Tessaro, Deregt, Desroches, Dubeski, Tong and Godson2004), ponies (Johnson et al., Reference Johnson, Rao, Hussey, Morley and Traub-Dargatz2011) and humans (Ng et al., Reference Ng, Kawb and Chang2004; Chiang et al., Reference Chiang, Lin, Lin, Chiou, Chien, Chu and Chiu2008).
The temperature of extremities appears to be more influenced by the ambient temperature than the eye temperature. Gloster et al. (Reference Gloster, Ebert, Gubbins, Bashiruddin and Paton2011) showed that hoof temperatures in cattle substantially depend on ambient temperature, whereas eye temperatures are not significantly affected. After considering factors such as sunlight, moisture, surface dirt and weather conditions (Knížková et al., Reference Knížková, Kunc, Gurdil, Pnar and Selvi2007), the results of previous studies indicate that IR thermography represents a potential tool for the early recognition of temperature increases and therefore of diseases.
Our previous studies demonstrated the potential of video recordings from an IR thermography camera as a non-invasive system to measure body temperature in calves (Hoffmann et al., Reference Hoffmann, Schmidt, Ammon, Rose-Meierhofer, Burfeind, Heuwieser and Berg2013). The maximum temperature of the entire head or body area can be used as a representative temperature for the region of the eye or the back of the ear, respectively. This would be advantageous for future automatic monitoring systems because it would be easier to define a fixed area than to find, for example, the eye, with a software programme. However, the objective of the present study was to determine whether it was sufficient to define only one larger area of the entire animal and to use the maximum temperature of this area.
Material and methods
The investigation was performed at a dairy barn in Brandenburg, Germany. Altogether, nine calves (Holstein-Friesians, 8 to 35 weeks old) were used. The skin and body temperature of the calves were measured during the visits of the calf feeder. The calves were monitored in the morning until every calf had visited the calf feeder at least once. Measurements from the afternoon were not used to reduce disturbing influences due to diurnal changes in body temperature and weather conditions. The skin temperature recordings were performed with the portable infrared camera (IRC) OPTRIS® PI 450 (Optris, Berlin, Germany) in the form of IR thermography videos. Video recording was initiated when each calf entered the calf feeder. The IRC featured a temperature range from −20°C to 900°C with a resolution of 0.1°C, a spectral range from 7.5 to 13 µm and a sensitivity of 0.04 K. An optical resolution of 382×288 pixels was provided by the detector. The emissivity was adjusted to 0.985 based on recommendations for human skin (Wolfe and Zissis, Reference Wolfe and Zissis1985). The videos were recorded at 9 frames/s, and the duration of the video clips was ~5 min/calf. The camera was fixed on a tripod at a certain location to the side of the automatic calf feeder to measure the temperatures with a nearly constant distance and angle of measurement between the IRC lens and the body surface. During every visit to the calf feeder, the head, side and back of the calves’ bodies were filmed while the calves were drinking. This experimental setup provided a well-defined distance (~150 cm) between the camera lens and the body surface (a figure of the experimental setup is given in Supplementary Figure S1). A plate with a reference temperature (preset to 40.0°C) was also installed to serve as a comparison for the IRC. Furthermore, the ambient temperature and relative humidity of the air were recorded with a data logger once per minute. The logger (Tinytag Ultra 2; Gemini, Chichester, UK) was positioned at a height of 2 m in the middle of the barn.
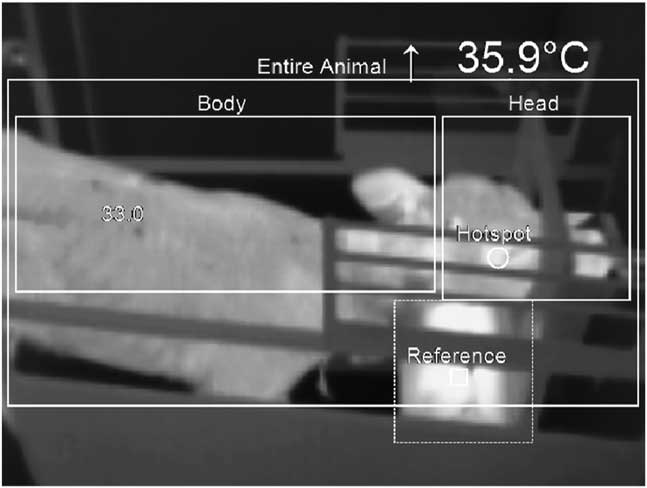
To analyse the IRC temperature, every video was viewed again later with the PI Connect software (version 2.0.2009.0; Optris). The software enabled a subsequent input of the ambient temperature and considered this in the output of the IR temperatures of the body surfaces. Therefore, the mean ambient temperatures of the individual measurement time points were entered during the video analysis. In our previous analysis with the same experimental setup, two main areas of the calves (body and head) were manually defined in the analysis of these videos (Hoffmann et al., Reference Hoffmann, Schmidt, Ammon, Rose-Meierhofer, Burfeind, Heuwieser and Berg2013). The definition of the areas was made while viewing the first video. Later changes in the areas were not needed due to the fixed position of both the camera and the animals in the calf feeder. The first area included the part of the body caudal to the forehead, including the ears. The second area included the part of the head rostral to the ears. For the present study, a third area was also defined. This area (entire animal) included the entire visible area of the calf (Figure 1). While retrospectively playing the IRC videos, the software saved the maximum temperature (hot spots) of the three areas from each video frame (9 frames/s). However, each video was viewed, and the maximum temperatures were used to control the position of the areas for each animal and to determine the location of the hot spot in each frame (which was depicted in the software as a small circle) (Figure 1). The maximum temperature of the head area represented the temperature of the eye region, and the maximum temperature of the body area represented the back of the ear, as shown in our previous study (Hoffmann et al., Reference Hoffmann, Schmidt, Ammon, Rose-Meierhofer, Burfeind, Heuwieser and Berg2013). The 10 highest values for each animal and each defined area were chosen for use in the subsequent statistical analysis.
IR image of a calf during the drinking process showing the defined measuring areas.

The rectal temperature (REC) of each calf was measured as a reference temperature when the calf entered the calf feeder. The same digital thermometer (ApoNorm®, Hillscheid, Germany) was used, always by the same person. The measurement range of the thermometer was from 32.0°C to 43.9°C, with an accuracy of ±0.1°C and a resolution of 0.1°C. The rectal temperature was always measured at the same insertion depth (8 cm) to minimise bias in the measuring process (Burfeind et al., Reference Burfeind, von Keyserlingk, Weary, Veira and Heuwieser2010). The measurements of the REC were finished when an acoustic signal was emitted by the thermometer.
The statistical analysis was performed using SAS 9.2 (SAS Institute Inc., Cary, NC, USA). The data were investigated descriptively for the body surface temperatures (IRC) and the corresponding rectal temperatures (REC) using box-and-whisker plots. Values that were >1.5 interquartile ranges above the 75% quartile or 1.5 interquartile ranges below the 25% quartile were considered to be outliers in the box-and-whisker plots. The method used to compare the IRC and REC temperatures was a modification of the Bland–Altman plot (Bland and Altman, Reference Bland and Altman1999) described by Ludbrook (Reference Ludbrook2010).
Results
The descriptive statistics of all of the measured IRC temperatures showed that the mean and standard deviation of the head area, body area and entire animal were 36.80±0.63°C, 35.76±0.93°C and 36.85±0.54°C, respectively. Previous analyses in this study showed that the IRC temperatures of the calves in total have a very large range (Hoffmann et al., Reference Hoffmann, Schmidt, Ammon, Rose-Meierhofer, Burfeind, Heuwieser and Berg2013). Therefore, it is important to assess the individual relationship between the reference temperature and the IRC temperature of every animal. Choosing the 10 highest temperatures per video and analysed area led to a smaller range in the IRC temperatures of all of the animals. The mean and standard deviation of the maximum temperatures of the head area, body area and entire animal were 37.64±0.86°C, 36.75±1.06°C and 37.66±0.90°C, respectively. The IRC temperatures were always lower than the REC temperatures (median: 38.9°C, minimum: 38.5°C, maximum: 39.2°C).
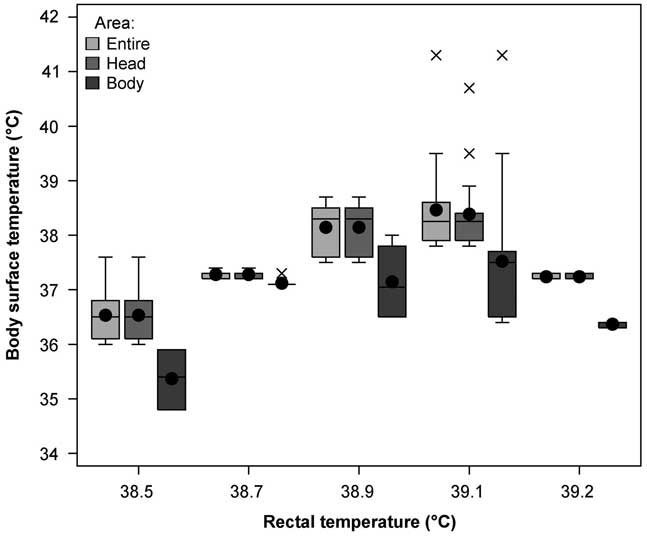
The body surface temperatures of the calves showed an increase in the IRC temperature in both the body and head areas and in the body surface of the entire animal, with an increase in the REC of up to 39.1°C (Figure 2). When the REC approached the upper limit (>39.1°C), the IRC temperatures decreased. However, the maximum temperatures of the entire animal and the head area were always higher than that of the body area. The temperatures of the head area and the entire animal were very similar. The videos of the calves showed that the hot spots of the head area were located at the medial or lateral angle of the eye in most cases. The hot spots of the body area were primarily located at the back of the ear. Using only one area for the entire animal showed hot spots at the eye region and in the region of the ear but with longer periods in the eye region.
Relationship between the rectal temperature and body surface temperature, measured at the head area, body area and the entire body of the calves (n=9).

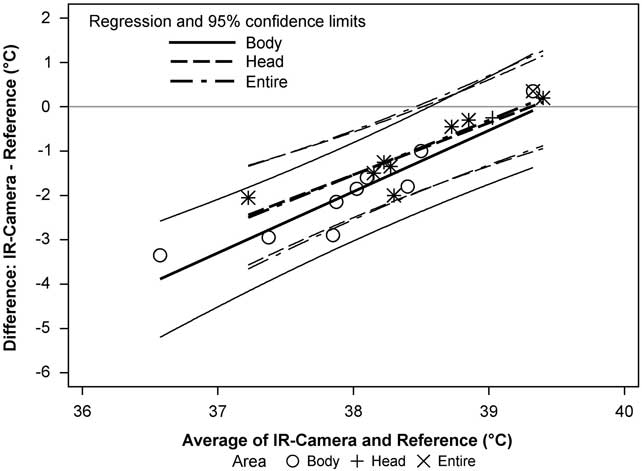
The Bland–Altman plot for the IRC–REC differences (Figure 3) and the corresponding averages demonstrated that the 95% limits of agreement covered a range of ~2°C in both the body area and the head area and consequently for the maximum temperatures of the entire area as well. The difference between the temperatures measured using both methods (head and body area) depended on the average of the temperatures. The difference between the methods was smaller at higher temperatures, for example, the methods were nearly in agreement at ~39°C; however, at lower temperatures, the IRC underestimated the REC by up to 3.5°C. The head area or the area of the entire body appeared to have lower absolute differences from the reference compared with the body area.
Bland–Altman plot of the values of the IR camera compared with the rectal temperature as a reference (nine calves).

Discussion
The video-based IRC system was very promising; however, other factors should be considered. The distance between the camera and animal should be fixed, and extreme temperatures, wind and direct sunshine should be avoided. This is in accordance with the results of Okada et al. (Reference Okada, Takemura and Sato2013), who analysed the effects of various factors on the IR thermography in cattle. In accordance with their recommendations, we used a plate with a preset reference temperature. Thus, the software could compare the measured temperatures with the reference temperature, which led to more precise values.
In a Canadian study by Schaefer et al. (Reference Schaefer, Cook, Bench, Chabot, Colyn, Liu, Okine, Stewart and Webster2012), the orbital region (eye and 1 cm surrounding the eye) was used to identify calves at risk of respiratory disease. In contrast with our video-based IRC system, they installed an IRC that took single pictures and used a fixed position near a calf watering system. In their investigation, the average maximum IR temperature of the eye region (mean±SD: 34.71±0.57°C) was lower in the group of healthy calves (true negatives) than were the maximum temperatures in the head area of the calves in the present study (37.64±0.86°C). This difference could be due to different devices and study designs. However, similar to the findings of our study, Schaefer et al. (Reference Schaefer, Cook, Bench, Chabot, Colyn, Liu, Okine, Stewart and Webster2012) also advocated a firmly installed IR system.
Regarding the method, studies on rabbits concluded that rectal measurements cannot be replaced in animals without clinical findings (Chen and White, Reference Chen and White2006). This was confirmed by our study. Kammersgaard et al. (Reference Kammersgaard, Malmkvist and Pedersen2013) investigated the thermal status of neonatal piglets and stated that IR thermography cannot be used as an identical substitute for rectal temperature measurements. However, the body temperatures of the healthy animals (measured rectally) (mean±SD: 39.0±0.25°C) in the study by Schaefer et al. (Reference Schaefer, Cook, Bench, Chabot, Colyn, Liu, Okine, Stewart and Webster2012) were similar to the body temperatures of the calves in our study (median: 38.9°C). Measuring the body temperatures of calves rectally with a digital thermometer was deemed the best method to record their temperature. However, this method is time consuming and can be disturbing for the animals because it requires a fixation and direct contact with the animals. Other limitations, such as the technique itself, the thermometer type and the penetration depth, have been described (Burfeind et al., Reference Burfeind, von Keyserlingk, Weary, Veira and Heuwieser2010; Naylor et al., Reference Naylor, Streeter and Torgerson2012) and can affect the measured values. Therefore, an automatic and contactless method is of great interest in the livestock husbandry and not only in calves. Such a method would reduce stress for the animals and would both save time for the farmers and provide them with a health monitoring system to detect infectious diseases as well as other conditions.
The present study showed that the maximum temperatures from IR pictures of the entire visible body of calves, which were recorded with an IRC as a movie, increased with increasing body temperatures. However, the results of the study also showed (Figure 2) that when the REC temperatures neared the upper limit (>39.1°C), the IRC temperatures were lower than the results for the lower REC temperatures (⩽39.1°C). This difference could be due to a physiological reaction of the body in an attempt to regulate temperature by reducing the temperature over the skin; however, further examinations are required to explain this result.
A previous study (Hoffmann et al., Reference Hoffmann, Schmidt, Ammon, Rose-Meierhofer, Burfeind, Heuwieser and Berg2013) showed the suitability of IR videos to determine correlations between the rectal temperature and defined IRC areas of the head and body. This study showed that defining only one large area for the entire animal and using the maximum temperature of this area may be sufficient to represent the body temperature in calves. Therefore, it is not necessary to obtain the maximum temperature of the orbital region as recommended by Johnson et al. (Reference Johnson, Rao, Hussey, Morley and Traub-Dargatz2011) for ponies, by Schaefer et al. (Reference Schaefer, Cook, Bench, Chabot, Colyn, Liu, Okine, Stewart and Webster2012) for calves or by Schmidt et al. (Reference Schmidt, Lahrmann, Ammon, Berg, Schoen and Hoffmann2013) for sows. However, environmental factors, such as the position of the camera, animal parameters and climatic conditions, must be taken into account, as mentioned by Knížková et al. (Reference Knížková, Kunc, Gurdil, Pnar and Selvi2007) and Okada et al. (Reference Okada, Takemura and Sato2013).
A strength of the thermography video camera used in the present system was that a large number of pictures per animal could be recorded in a short period of time. In addition, the selection of the 10 highest values within the duration of each video recording led to reliable results.
Therefore, we agree with Johnson et al. (Reference Johnson, Rao, Hussey, Morley and Traub-Dargatz2011), who concluded in their study on ponies that the use of IR thermography may function best by collecting several rapid readings and then using the maximum temperature. Kammersgaard et al. (Reference Kammersgaard, Malmkvist and Pedersen2013) also concluded that the maximum IR temperature from the full-body thermogram is a valid tool to assess the thermal status in neonatal piglets; this is in agreement with the results of the present study.
In conclusion, IR thermography videos can be used to analyse more than one picture per animal. The maximum temperature in each video frame for the entire visible body area appeared to be sufficient to measure the superficial body temperature in calves. IR thermography videos could potentially serve as a monitoring system for body temperature in calves. Nevertheless, for the early detection of infected animals, it is prudent to use animal individuals as their own controls and to obtain accurate algorithms and determine critical temperature differences. The approach involves measuring relative differences between one measurement and the mean of previous measurements at comparable times of day. In our opinion, it would not be possible to describe thresholds (such as for rectal temperatures), and there could be difficulties in determining differences in the body temperatures of healthy animals. However, further studies with febrile calves are necessary to assess individual changes in the IRC temperature. Furthermore, a critical temperature difference must be defined, and a combination with an animal identification system at the calf feeder must be obtained to produce an automatic system with an alarm function.
Acknowledgement
The authors thank the teaching and experimental farm Groß Kreutz, Brandenburg (Germany) for the assistance during this study.
Supplementary material
To view supplementary material for this article, please visit http://dx.doi.org/10.1017/S1751731115001354