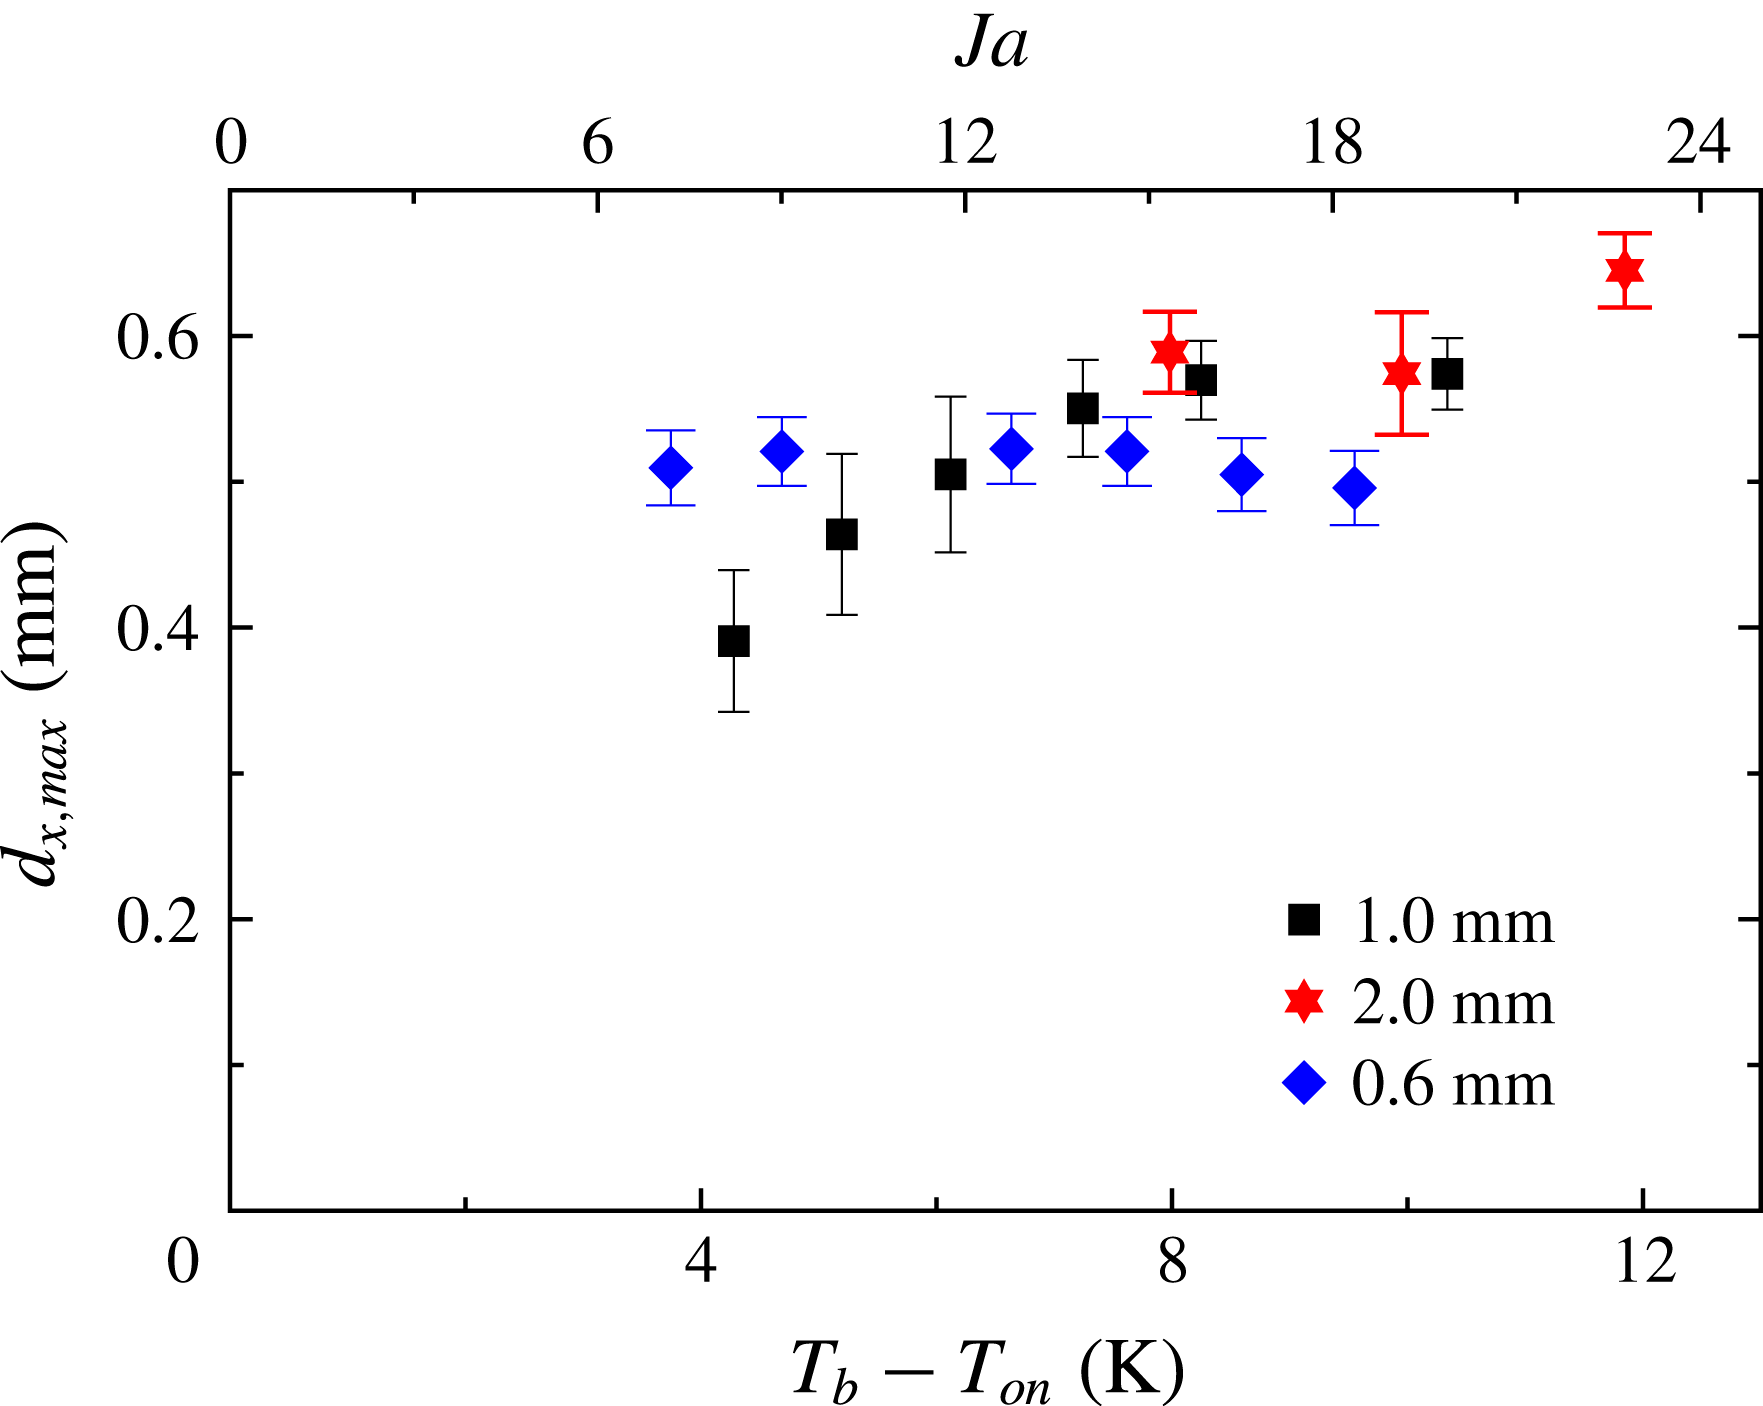
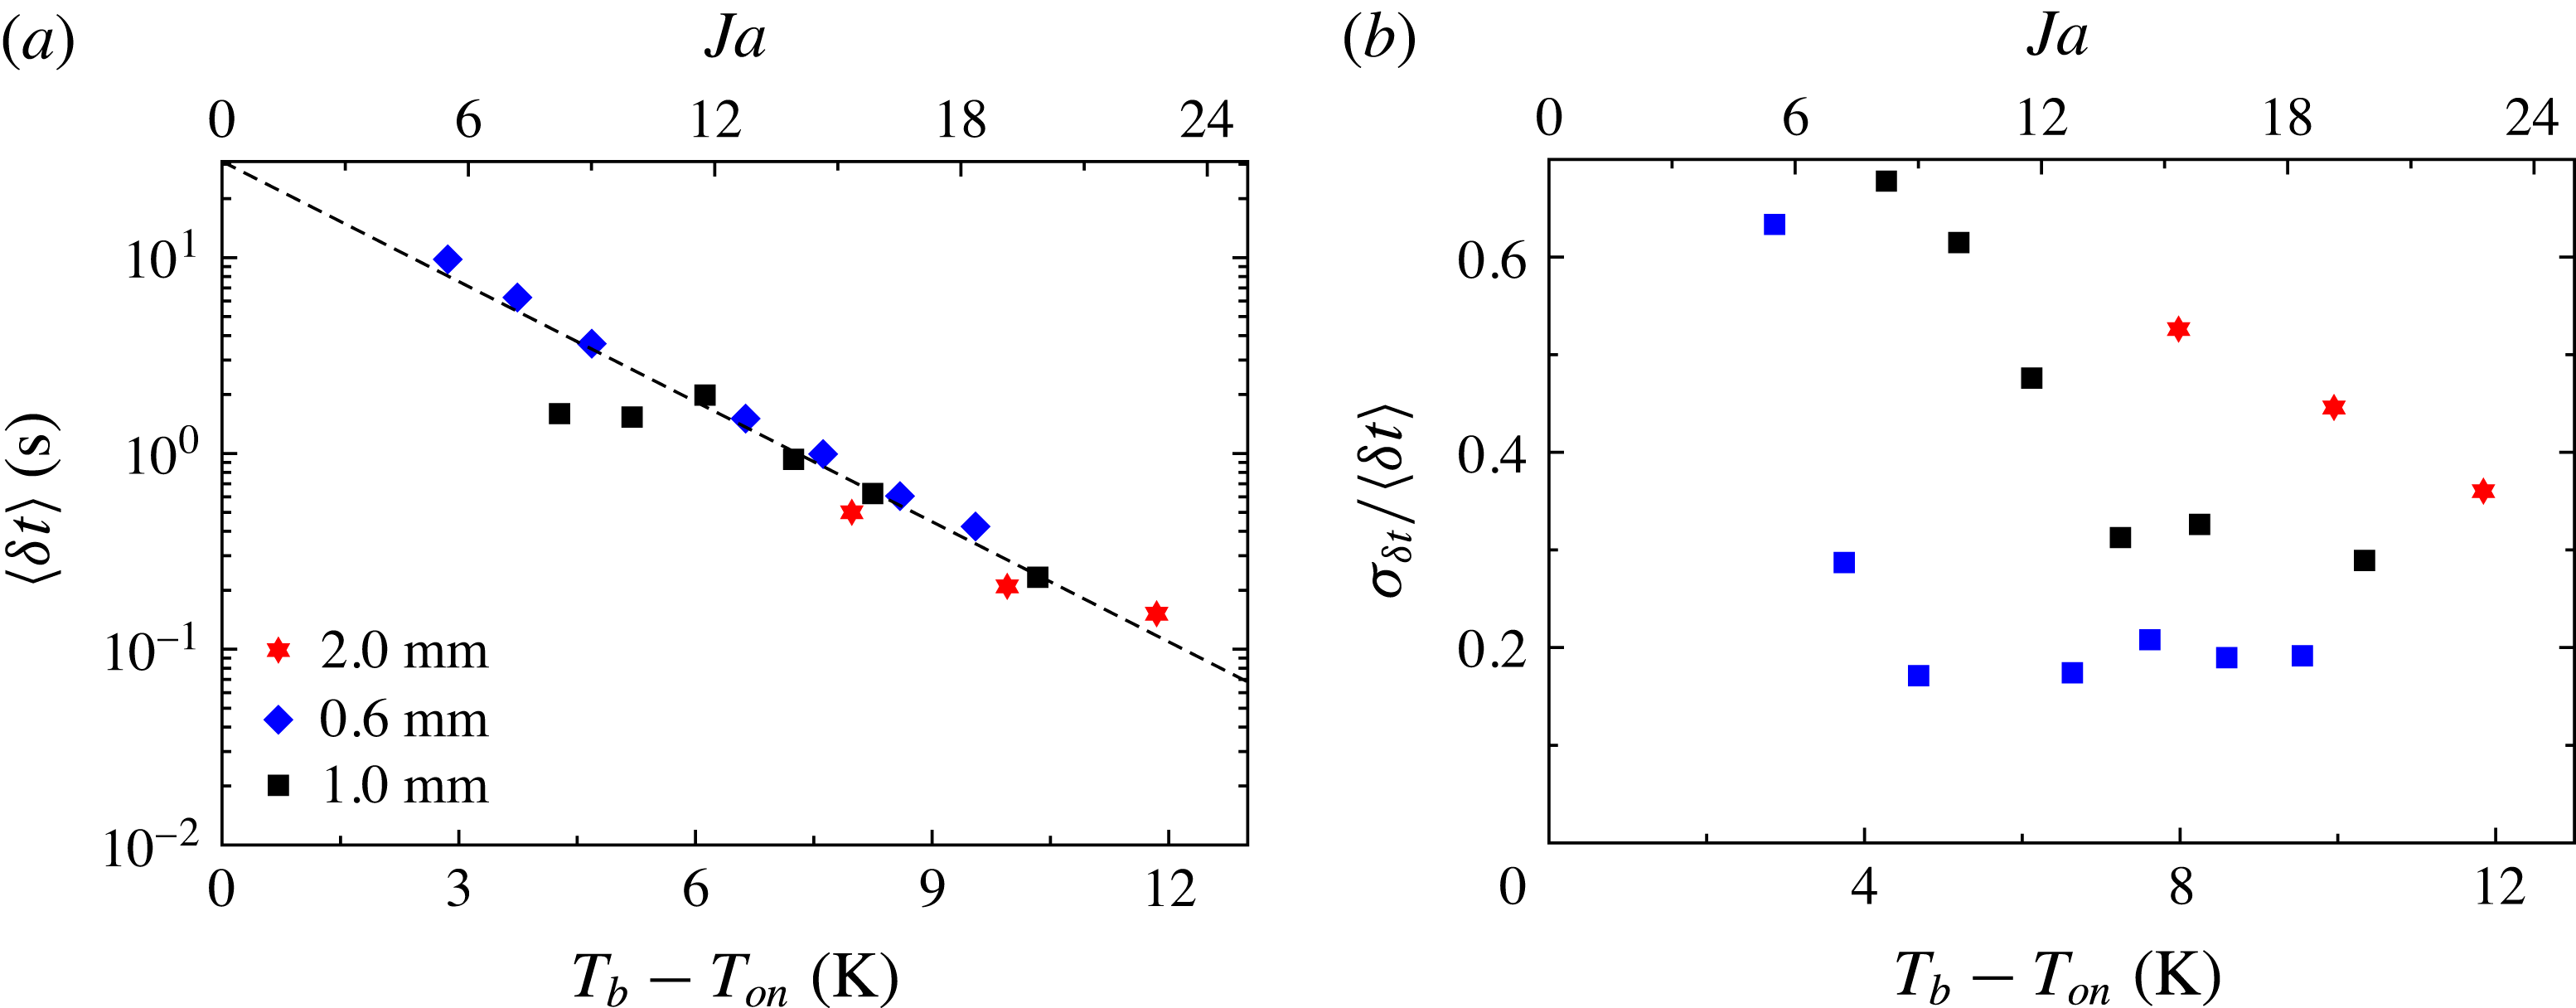
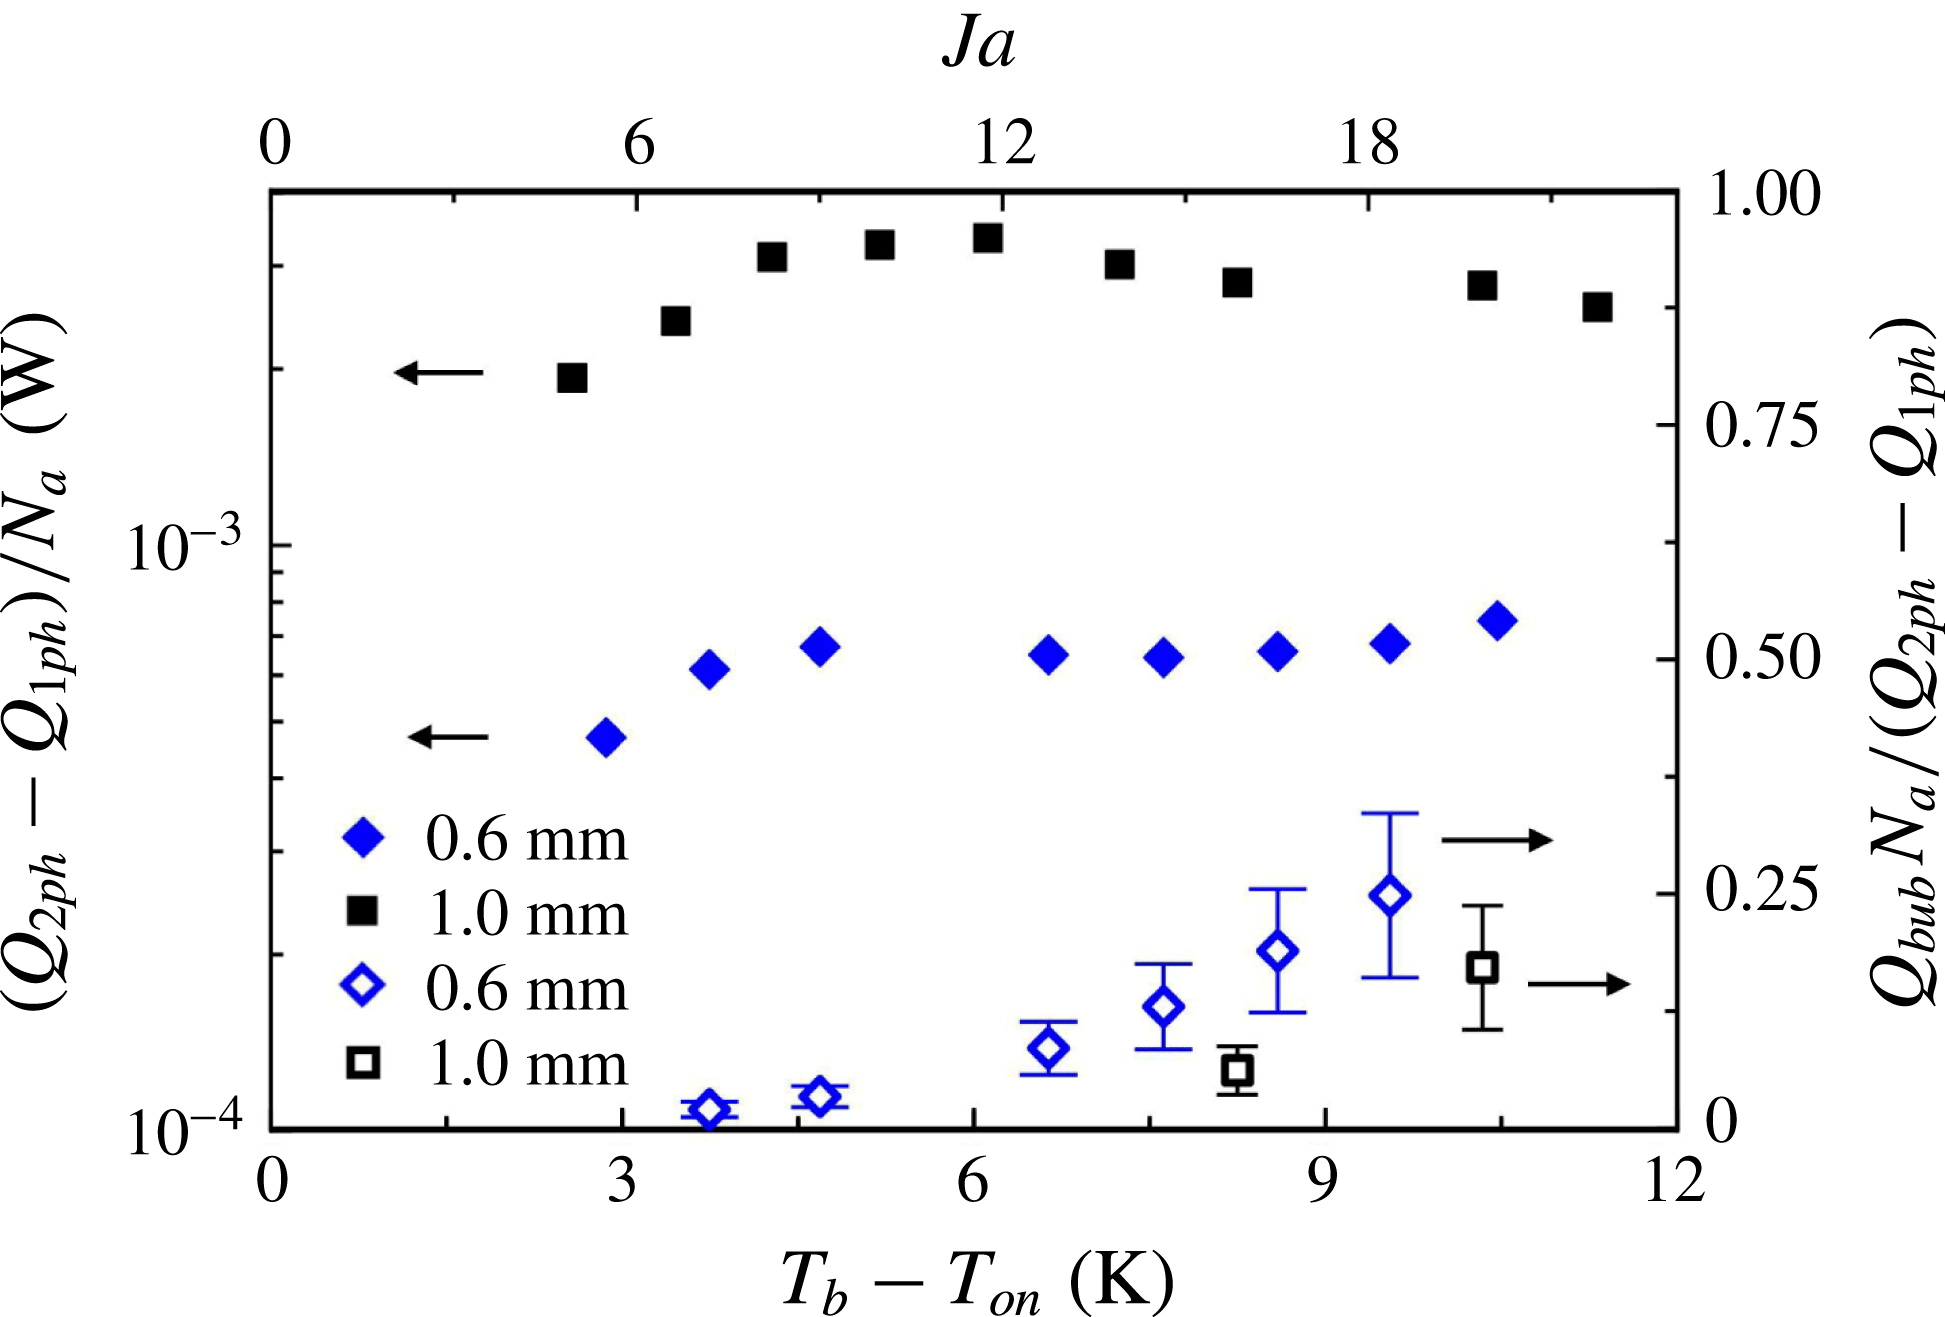
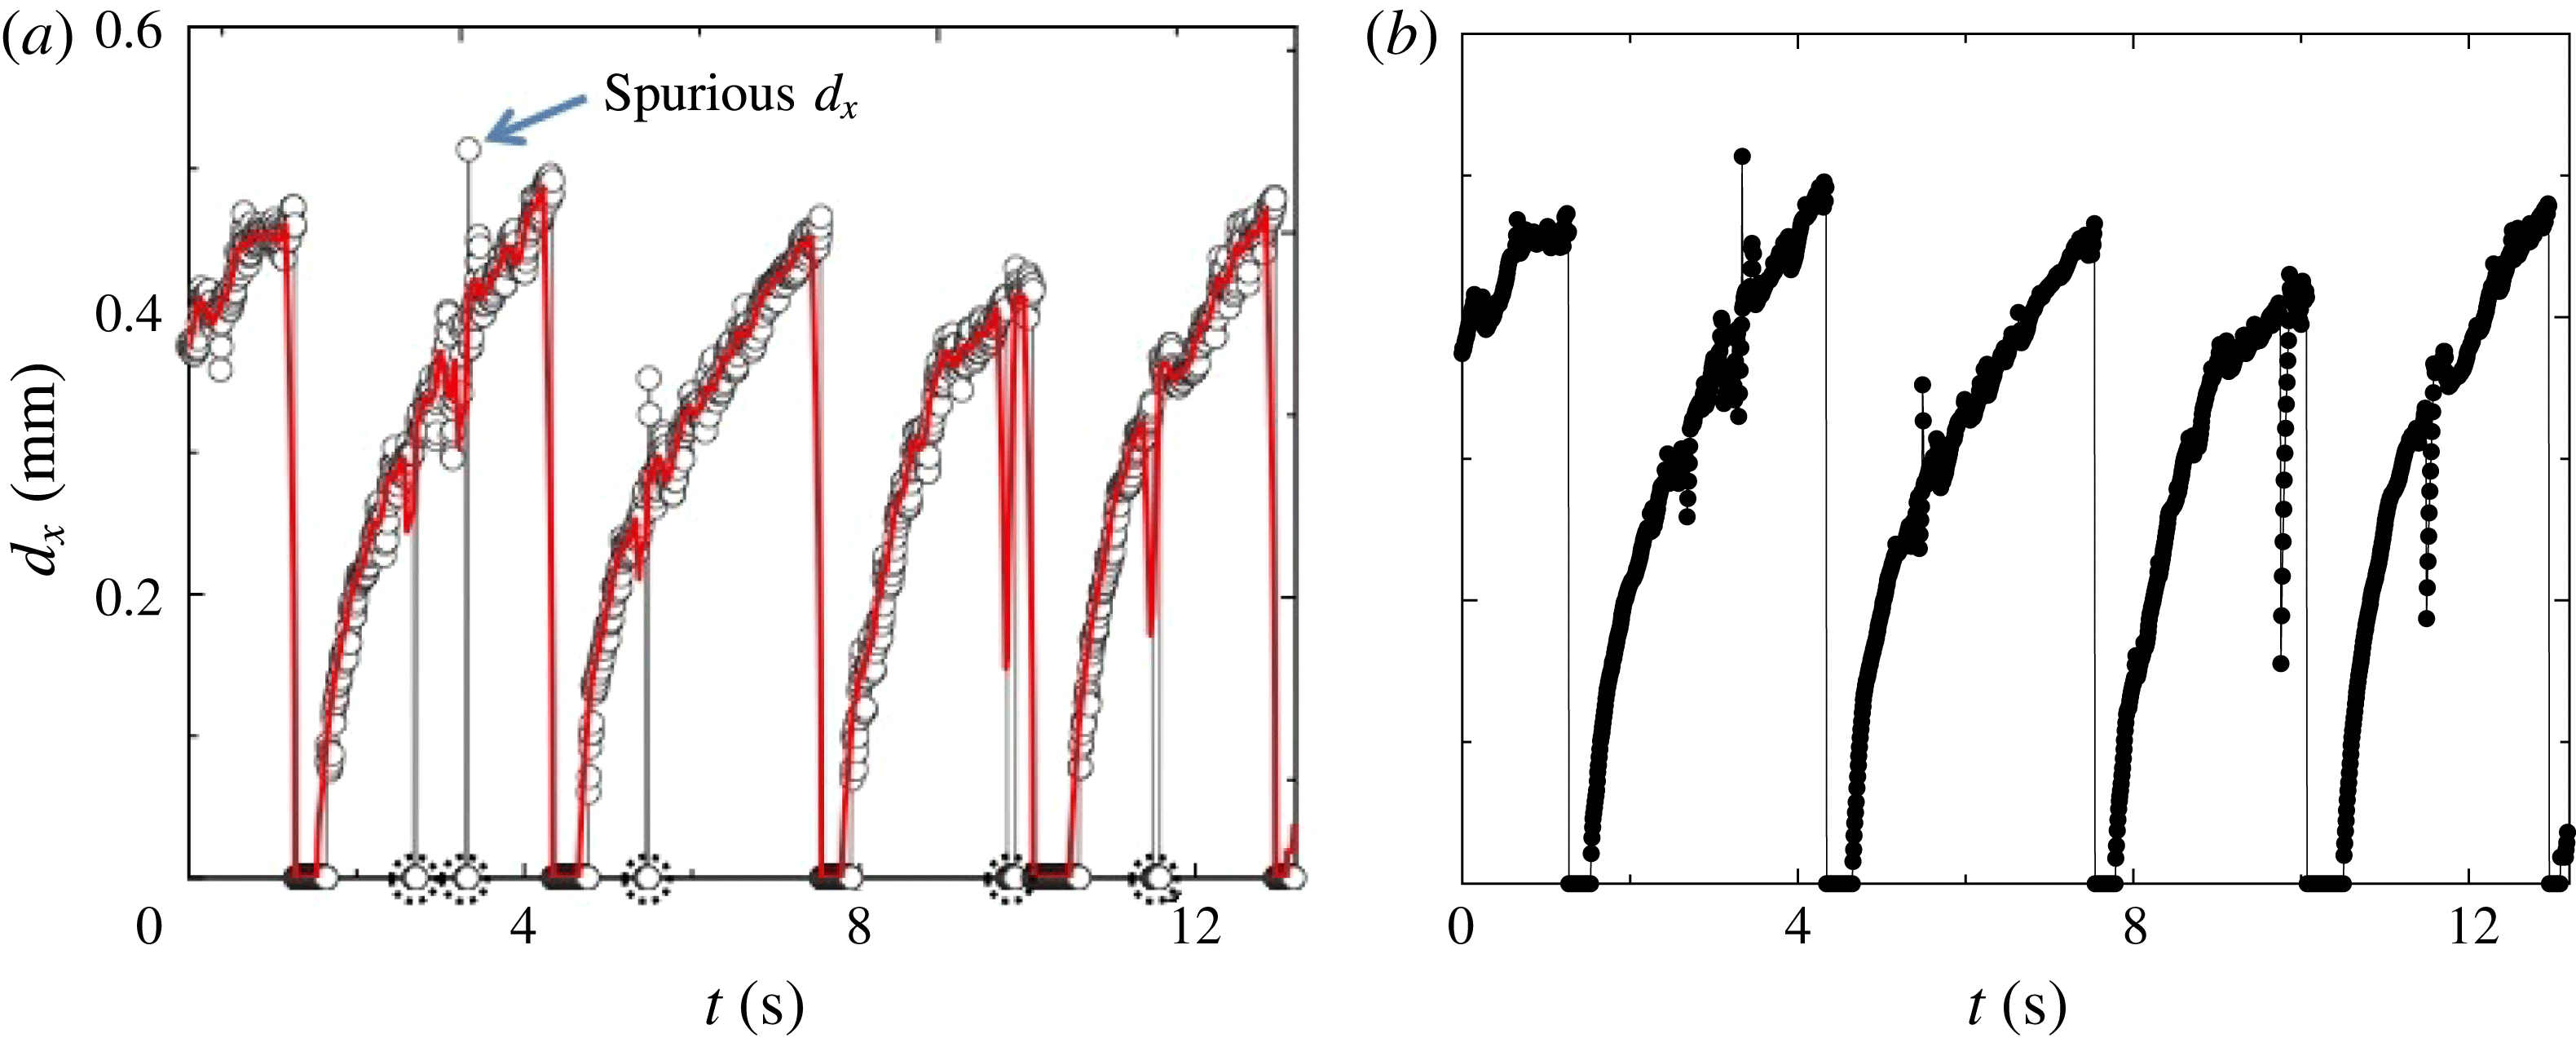
1 Introduction
Boiling mechanisms, which promote heat transfer from a hot surface to a liquid, are numerous and intertwined. As a vapour bubble grows on a surface, an increasing amount of latent heat is required to evaporate liquid at the liquid/vapour interface. The latent heat is attainable through different mechanisms: through the bubble cap in the case where the surrounding liquid is superheated, via micro-layer evaporation, and by three-phase contact-line evaporation (see the review by Kim (Reference Kim2009)). The contribution of each of these mechanisms to bubble growth is still a matter of research (see for example Yabuki & Nakabeppu (Reference Yabuki and Nakabeppu2011) and Baltis & van der Geld (Reference Baltis and van der Geld2015)). As the bubble grows, it causes micro-convection, that is, it perturbs the liquid adjacent to it and disrupts the boundary layer that exists just above the surface. Once the bubble departs from the surface, colder liquid replaces it, enhancing the heat flow due to transient conduction from the hot surface as the liquid rewets it. In addition, a bubble rising in the liquid due to buoyancy carries latent heat with it, and thus effectively transfers heat by advection and augments the effective buoyancy of the flow.
Rayleigh–Bénard flow occurs in a fluid contained within (ideally) adiabatic sidewalls and conducting horizontal top and bottom plates, cooled from above and heated from below. Heat transfer and the flow characteristics of Rayleigh–Bénard turbulence have been studied extensively (Kadanoff Reference Kadanoff2001; Ahlers Reference Ahlers2009; Ahlers, Grossmann & Lohse Reference Ahlers, Grossmann and Lohse2009; Lohse & Xia Reference Lohse and Xia2010; Chillà & Schumacher Reference Chillà and Schumacher2012). In this system there are thin boundary layers above the bottom and below the top plate which each sustain approximately half of the applied temperature difference, while the interior (or ‘bulk’) temperature, although fluctuating vigorously, is nearly independent of the location in the time average (see, however, Ahlers et al. (Reference Ahlers, Bodenschatz, Funfschilling, Grossmann, He, Lohse, Stevens and Verzicco2012), Ahlers, Bodenschatz & He (Reference Ahlers, Bodenschatz and He2014) and Wei & Ahlers (Reference Wei and Ahlers2014) for a more detailed discussion). In the bulk there exists a large-scale circulation (LSC) which, for samples with a height similar to its width, takes the form of a single convection roll with a stochastic dynamics that is driven by the small-scale fluctuations of the velocity field (Brown & Ahlers Reference Brown and Ahlers2007, Reference Brown and Ahlers2008).
For boiling to occur at the heated bottom plate of a Rayleigh–Bénard convection (RBC) sample while the sample remains filled with liquid (except for the bubbles forming at the bottom plate), it is required that the temperature of the top plate
 $T_{t}$
is below the saturation temperature
 $T_{{\it\phi}}$
at the prevailing pressure, and that the bottom-plate temperature
 $T_{b}$
is above it. The temperature difference
 $T_{b}-T_{{\it\phi}}$
is commonly referred to as the superheat. The vapour bubbles form in a boundary layer at the bottom plate and condense as they rise through the bulk of the sample. Depending on whether the mean temperature
 $T_{m}=(T_{b}+T_{t})/2$
is well below or close to
 $T_{{\it\phi}}$
, one expects the vapour bubbles to condense sooner or later along their rising motion through the bulk. If
 $T_{m}=T_{{\it\phi}}$
the bubbles can condense only once they are in the thermal boundary layer at the top plate.
Boiling RBC flow has been studied numerically over the Rayleigh-number (see (2.1)) range
 $Ra=2\times 10^{5}$
to
 $2\times 10^{9}$
and for Prandtl numbers (see (2.2))
 $Pr=1.75$
and 9 (Oresta et al.
Reference Oresta, Verzicco, Lohse and Properetti2009; Lakkaraju et al.
Reference Lakkaraju, Schmidt, Oresta, Toschi, Verzicco, Lohse and Prosperetti2011; Schmidt et al.
Reference Schmidt, Oresta, Toschi, Verzicco, Lohse and Prosperetti2011; Biferale et al.
Reference Biferale, Perlekar, Sbragaglia and Toschi2012; Lakkaraju et al.
Reference Lakkaraju, Stevens, Oresta, Verzicco, Lohse and Prosperetti2013; Lakkaraju, Toschi & Lohse Reference Lakkaraju, Toschi and Lohse2014) in RBC samples with aspect ratios
 ${\it\Gamma}\equiv D/L=1$
and
 $1/2$
(
 $D$
is the sample diameter and
 $L$
its height). Findings of the simulations include flow-structure changes (Oresta et al.
Reference Oresta, Verzicco, Lohse and Properetti2009; Schmidt et al.
Reference Schmidt, Oresta, Toschi, Verzicco, Lohse and Prosperetti2011) and an effect of the bubbles on both the temperature and the velocity field (Schmidt et al.
Reference Schmidt, Oresta, Toschi, Verzicco, Lohse and Prosperetti2011; Biferale et al.
Reference Biferale, Perlekar, Sbragaglia and Toschi2012) as well as on velocity and temperature fluctuations (Lakkaraju et al.
Reference Lakkaraju, Schmidt, Oresta, Toschi, Verzicco, Lohse and Prosperetti2011; Biferale et al.
Reference Biferale, Perlekar, Sbragaglia and Toschi2012; Lakkaraju et al.
Reference Lakkaraju, Stevens, Oresta, Verzicco, Lohse and Prosperetti2013, Reference Lakkaraju, Toschi and Lohse2014). More specifically, the numerical simulations found that the mechanical forcing due to rising vapour bubbles increased the velocity fluctuations in the liquid and led to an increase of both the kinetic-energy dissipation rate and the Reynolds number
 $Re=u_{rms}L/{\it\nu}$
(
 ${\it\nu}$
is the kinematic viscosity) based on the root-mean-square fluctuation velocity
 $u_{rms}$
. The more bubbles were introduced in the flow, the more
 $Re$
increased. Furthermore, the presence of bubbles in the flow augmented the thermal-energy dissipation rate due to localized large temperature gradients associated with bubbles since their surface temperature was fixed at the saturation temperature. The bubbles subjected the boundary layers above the bottom and below the top plate to larger thermal and velocity fluctuations, adding to convective effects of the flow. Due to the large heat capacity of the bubbles and the liquid they drag with them, sharp temperature fronts in the flow were smoothened, reducing the intermittency of the temperature and velocity fluctuations (Lakkaraju et al.
Reference Lakkaraju, Toschi and Lohse2014). One common result in all of these papers for Jakob numbers (see the definition in (2.3))
 $Ja>0$
was that the heat transfer was enhanced due to the presence of vapour bubbles (two-phase flow) with respect to the case without them (one-phase flow). Vapour bubbles significantly enhanced the heat transport by increasing the strength of the circulatory motion. The heat-flux enhancement was a decreasing function of
 $Ra$
, and for a given
 $Ra$
, adding more bubbles into the flow was found to increase this enhancement. All numerical studies focused on the bubble effects on the thermal convection, and the actual heat removal from the plate due to bubble formation was not simulated. Instead, a constant number of bubbles with an arbitrarily chosen initial size of tens of micrometres was introduced at the bottom plate and the bubbles were free to rise immediately once they were created. The heat required to grow the bubbles to their initial size was assumed to be negligible since the bubbles were small.
The vast majority of experimental studies of RBC kept the sample far from a phase transition. To the best of the authors’ knowledge the effect of a phase change on RBC was studied first near the onset of convection (see Ahlers (Reference Ahlers1995), Sakurai et al. (Reference Sakurai, Tschammer, Pesch and Ahlers1999) and references therein). Studies of turbulent RBC in the presence of a phase change were carried out by Zhong, Funfschilling & Ahlers (Reference Zhong, Funfschilling and Ahlers2009) for the case of ethane near its vapour-pressure curve. They reported an increase of the effective thermal conductivity when bubble nucleation took place at the bottom plate and, except for the bubbles, the cell was filled with liquid (
 $T_{m}<T_{{\it\phi}}$
). The effective conductivity became nearly one order of magnitude larger than the effective thermal conductivity for the turbulent one-phase flow. However, it tended to be irreproducible and time-dependent, especially for large superheats. In these experiments, the bottom plate (where bubble formation occurred) was a finely machined copper plate with inhomogeneous-nucleation sites of uncontrolled distribution, size and shape. Surfaces with random roughness provide an increasing number of active nucleation sites as the superheat is increased (Dhir Reference Dhir1998); this probably explains the irreproducibility in some of the measurements by Zhong et al. (Reference Zhong, Funfschilling and Ahlers2009).
For even larger superheats and
 $T_{m}>T_{{\it\phi}}$
, the sample of Zhong et al. (Reference Zhong, Funfschilling and Ahlers2009) was mostly filled with vapour while droplet condensation occurred at the top plate. In that case the effective thermal conductivity measurements were reproducible and time-independent, and also presented an enhancement which could approach an order of magnitude relative to the one-phase flow. The authors argued that the droplet formation occurred via homogeneous nucleation in the boundary layer below the top plate.
In a recent experimental study by Narezo Guzman et al. (Reference Narezo Guzman, Xie, Chen, Fernandez Rivas, Sun, Lohse and Ahlers2015) heat transport in two-phase RBC was studied; vapour-bubble formation under well-controlled boiling conditions was achieved by bubble nucleation occurring only at designed micrometre-sized cavities etched into a silicon wafer that was heated. The classical Rayleigh–Bénard configuration was modified by heating only a central circular area equal to about
 $1/15$
of the total bottom-plate surface in order to avoid uncontrolled bubble nucleation at the small gap between the bottom plate and the cell sidewall. The main focus was the global heat-flux enhancement measured in two-phase flow with respect to one-phase turbulent flow. They investigated the dependence of heat-flux enhancement on the cavity density and the degree of superheat at the bottom plate. They found that the global heat-flux enhancement was an increasing function of superheat (in agreement with the numerical studies by Lakkaraju et al. (Reference Lakkaraju, Stevens, Oresta, Verzicco, Lohse and Prosperetti2013)) and that it had a very weak dependence on the cavity density even though the cavity density varied by a factor of 59. Similarly, Lakkaraju et al. (Reference Lakkaraju, Stevens, Oresta, Verzicco, Lohse and Prosperetti2013) varied the total number of injected bubbles by a factor of 15 at fixed
 $Ra$
and found a corresponding increase in the global heat-flux enhancement by only a factor of two. The heat-flux enhancement per active nucleating site studied at a large superheat of 10 K did show a dependence on cavity density and it was suggested that the enhancement per active site increased as the cavity density decreased. In the extreme case of very dilute and non-interacting neighbouring nucleation sites the enhancement per active site saturated. Moreover, Narezo Guzman et al. (Reference Narezo Guzman, Xie, Chen, Fernandez Rivas, Sun, Lohse and Ahlers2015) acquired local temperature time series at two different vertical locations in the bulk flow and found that, as the superheat became larger, the bubbles increasingly enhanced the stabilizing thermal gradient, diminished the large temperature difference across the bottom
 $1/4$
of the sample, reduced the temperature fluctuations around the mean value and lessened the skewness of the temperature probability distributions.
In the present work we investigated further the two-phase RBC flow reported by Narezo Guzman et al. (Reference Narezo Guzman, Xie, Chen, Fernandez Rivas, Sun, Lohse and Ahlers2015) by means of high-speed imaging from a top view of the nucleation process at the bottom plate. In addition, we visualized one- and two-phase RBC flow (with modified geometry) from the side in a set-up especially designed for it. The lateral view of the departing bubbles added crucial information about the bubble shape and volume, and allowed the study of the bubble dynamics once the bubbles departed from the surface and started condensing and/or dissolving; this information could not be attained by flow visualization from the top. In addition we gained relevant qualitative information on how the bubbles changed the overall flow. The high-speed recordings partly described by Narezo Guzman et al. (Reference Narezo Guzman, Xie, Chen, Fernandez Rivas, Sun, Lohse and Ahlers2015) were analysed quantitatively, carrying through the investigation of bubble growth at and departure from the bottom plate. With this we determined how much of the measured global heat-flux enhancement was attributable to bubble growth directly at the surface. This direct thermal interaction with the plate had been neglected in the numerical simulations of boiling RBC (Lakkaraju et al. Reference Lakkaraju, Schmidt, Oresta, Toschi, Verzicco, Lohse and Prosperetti2011, Reference Lakkaraju, Stevens, Oresta, Verzicco, Lohse and Prosperetti2013, Reference Lakkaraju, Toschi and Lohse2014), which only considered the thermal coupling of the vapour bubble to its surrounding liquid. With this information we estimated separately the actual heat removal from the plate due to bubble formation as one of the mechanisms responsible for heat-flux enhancement. It was then possible to estimate the relative contribution from the other two contributions: the effective buoyancy due to rising bubbles (studied extensively in numerical papers) and the micro-convection together with transient conduction taking place as a consequence of bubble growth and departure.
In the next section of this paper we define various quantities needed in further discussions. Then, in § 3 we describe the apparatus, measurement and imaging procedures, as well as the image-analysis methods. In § 4 we present the results from flow visualization together with results for the bubble-growth contribution to the global heat-flux enhancement. Finally, in § 5 we summarize the results and give our conclusions.
2 Control and response parameters
For a given cell geometry, one-phase RBC flow depends on two dimensionless variables. The Rayleigh number
 $Ra$
is the dimensionless temperature difference
 ${\rm\Delta}T=T_{b}-T_{t}$
between the bottom plate (
 $T_{b}$
) and the top plate (
 $T_{t}$
) at their interfaces with the liquid and is given by
 $$\begin{eqnarray}Ra=\frac{g{\it\alpha}{\rm\Delta}TL^{3}}{{\it\kappa}{\it\nu}}.\end{eqnarray}$$
Here,
 $g$
,
 ${\it\alpha}$
,
 $L$
and
 ${\it\kappa}$
denote the gravitational acceleration, the isobaric thermal expansion coefficient, the cell height, and the thermal diffusivity, respectively. The Prandtl number is the ratio
 $$\begin{eqnarray}Pr={\it\nu}/{\it\kappa}.\end{eqnarray}$$
Unless stated otherwise, all fluid properties are evaluated at the mean temperature
 $T_{m}=(T_{b}+T_{t})/2$
.
For samples in the shape of right-circular cylinders such as those used here, a further parameter defining the geometry is the aspect ratio
 ${\it\Gamma}\equiv D/L$
, where
 $D$
is the diameter of the cell.
In a system with a single fluid involving a liquid–vapour phase change the relevant dimensionless parameter is the Jakob number
 $$\begin{eqnarray}Ja=\frac{{\it\rho}C_{p}(T_{b}-T_{{\it\phi}})}{{\it\rho}_{v}H},\end{eqnarray}$$
where
 ${\it\rho}$
and
 ${\it\rho}_{v}$
are the densities of liquid (evaluated at
 $T_{b}$
) and vapour (at the prevailing pressure), respectively, and
 $C_{p}$
is the heat capacity per unit mass of the liquid (evaluated at
 $T_{b}$
). Moreover,
 $H$
and
 $T_{{\it\phi}}$
are the latent heat of evaporation per unit mass and the temperature on the vapour-pressure curve (at the prevailing pressure), respectively. The Jakob number is the ratio of the sensible heat to the latent heat. The temperature difference
 $T_{b}-T_{{\it\phi}}$
is widely referred to as the superheat. In our case dissolved air reduced the boiling point to
 $T_{on}<T_{{\it\phi}}$
. Thus, in what follows
 $T_{{\it\phi}}$
is replaced by
 $T_{on}$
in (2.3) and throughout the analysis.
The response of the system to the imposed thermal driving, or
 $Ra$
, is reflected in the heat flux from the bottom to the top plate, across the horizontal cross-sectional area
 $A$
of the sample. It is expressed by the dimensionless Nusselt number
 $$\begin{eqnarray}Nu=\frac{{\it\lambda}_{eff}}{{\it\lambda}}.\end{eqnarray}$$
Here the effective conductivity
 ${\it\lambda}_{eff}$
is given by
 $$\begin{eqnarray}{\it\lambda}_{eff}=QL/(A{\rm\Delta}T),\end{eqnarray}$$
where
 ${\it\lambda}$
is the thermal conductivity of the quiescent liquid and
 $Q$
is the heat per unit time input to the system. In our case, it was more meaningful to consider the system response expressed in dimensional form by
 $Q$
. In classical RBC the heated area
 $A_{h}$
covers the entire bottom-plate surface and
 $A_{h}=A$
. Our system was a modified version of classical RBC since only a central circular area smaller than
 $A$
was heated (
 $A_{h}<A$
) while the cooling area
 $A_{c}$
equalled
 $A$
.
Another system response is a characteristic velocity amplitude
 $u$
of the turbulent flow which is described by the dimensionless Reynolds number
 $$\begin{eqnarray}Re=uL/{\it\nu}.\end{eqnarray}$$
3 Apparatus and procedures
Precise measurements of heat-flux enhancement due to vapour-bubble formation, as well as imaging of bubble nucleation at the bottom plate from the top, were carried in the apparatus that had been used by Narezo Guzman et al. (Reference Narezo Guzman, Xie, Chen, Fernandez Rivas, Sun, Lohse and Ahlers2015) (apparatus 1). Bubble nucleation and flow imaging from the side were done in a new apparatus (apparatus 2). Heat-flux measurements in apparatus 2 were not as accurate as those in apparatus 1 because the required broad optical access from the side precluded adequate thermal shielding, and are not reported.
The global turbulent RBC flow was visualized from the side using the shadowgraph technique (Busse & Whitehead Reference Busse and Whitehead1971; Rasenat et al. Reference Rasenat, Hartung, Winkler and Rehberg1989; de Bruyn et al. Reference de Bruyn, Bodenschatz, Morris, Trainoff, Hu, Cannell and Ahlers1996; Trainoff & Cannel Reference Trainoff and Cannel2002), which permitted the visualization of the formation and development of plumes and of thermal structures associated with the LSC, and simultaneously of the rising bubbles in the case of two-phase flow. Focusing on the bubbles from the side provided information about the bubble growth at their nucleation sites and their eventual departure and rise through the bulk of the sample.
3.1 Bottom plate and liquid
Each bottom plate consisted of a 10 cm diameter silicon wafer glued to both a copper cylinder with diameter 2.54 cm and to a polycarbonate ring (10 cm outer diameter and 1.26 cm thick) which surrounded the copper cylinder. A metal-film heater was attached to the bottom of the copper cylinder. Nucleation cavities were etched into the up-facing sides of all silicon wafers over a central circular area of 2.54 cm diameter; outside this area the wafers had a smooth surface (3.46–4.22 Å). The roughness of the cavity walls was less than 500 nm. The etched area was located above the heated area
 $A_{h}=5.07~\text{cm}^{2}$
of the copper cylinder. A thermistor (Honeywell type 121-503JAJ-Q01) was inserted into the copper piece approximately 1.4 cm below the upper surface and measured
 $T_{b}^{\star }$
. For a more detailed description of the bottom-plate configuration, see Narezo Guzman et al. (Reference Narezo Guzman, Xie, Chen, Fernandez Rivas, Sun, Lohse and Ahlers2015).
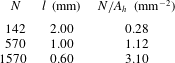
We used three different wafers with micrometre-sized cavities on a triangular lattice. Each had a different centre-to-centre cavity spacing
 $l$
and thus cavity density, see table 1. The cavities had a depth of
 $100\pm 5~{\rm\mu}\text{m}$
and a diameter of
 $30\pm 2~{\rm\mu}\text{m}$
.
The total number of cavities
 $N$
, centre-to-centre spacing
 $l$
and number of cavities per square millimetre
 $N/A_{h}$
with
 $A_{h}=507~\text{mm}^{2}$
for the wafers used in this study.

The working fluid was the fluorocarbon Novec7000™ (1-methoxyheptafluoropropane) manufactured by 3M™. At atmospheric pressure it has a boiling temperature of 34 °C, which makes it suitable for boiling experiments in our apparatus set-ups. Relevant properties are given as a function of temperature by the manufacturer. In the experiments presented here
 $T_{m}$
ranged from 35 to 18 °C. The Prandtl number (see (2.2)) ranged from 7.5 to 8.2 with decreasing
 $T_{m}$
. The resulting Rayleigh number (see (2.1)) ranged from
 $1.4\times 10^{10}$
to
 $2.0\times 10^{10}$
.
3.2 Apparatus 1: heat-current measurements and imaging from above
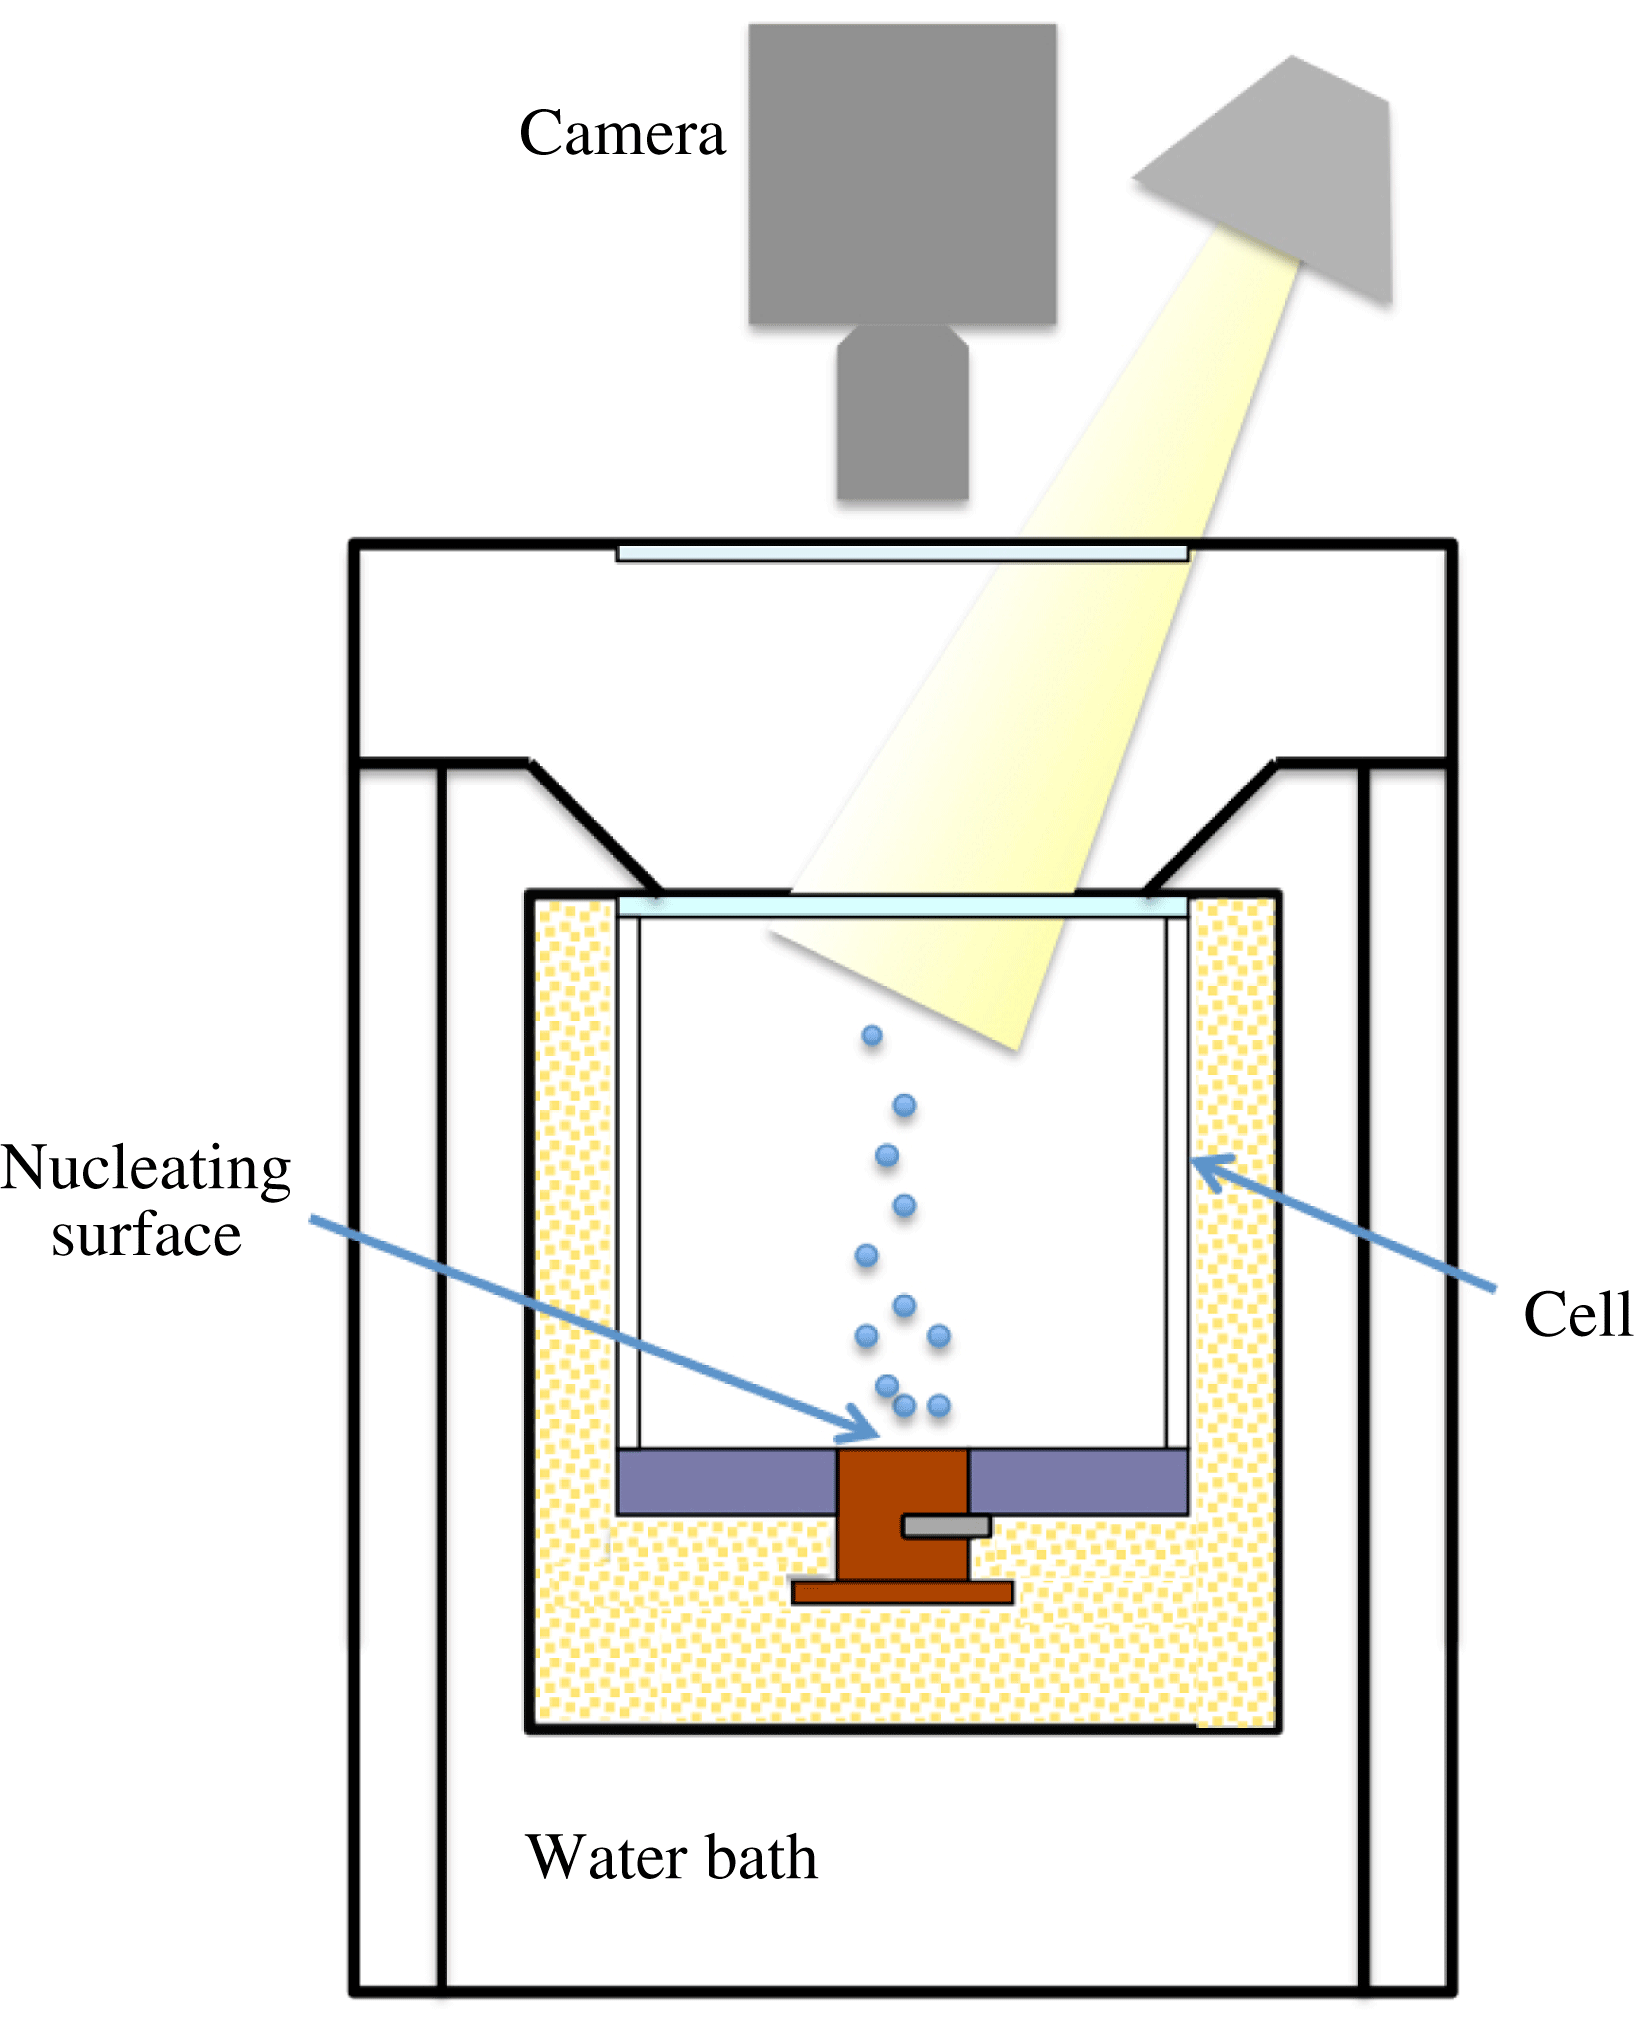
The experiments for visualizing the vapour-bubble nucleation at the bottom plate from the top were conducted in the apparatus used before (see figure 1); details about it are given by Ahlers & Xu (Reference Ahlers and Xu2000), Xu, Bajaj & Ahlers (Reference Xu, Bajaj and Ahlers2000), Funfschilling et al. (Reference Funfschilling, Brown, Nikolaenko and Ahlers2005), Zhong et al. (Reference Zhong, Funfschilling and Ahlers2009). The convection cell consisted of a cylindrical sidewall, either of polycarbonate or acrylic, with a thickness of 0.63 cm. It had a height of
 $L=8.8$
cm, and an aspect ratio
 ${\it\Gamma}=1.00$
. The fluid in the cell was confined between a bottom plate (see § 3.1) and a 0.635 cm thick, 10 cm diameter sapphire plate on the top. The cooling area extended over the entire top plate. The cell was subjected to a vertical temperature difference by means of a water-cooled top plate and a bottom plate heated over its central 2.54 cm diameter area by a film heater. The temperature of both plates was computer controlled, the top (bottom) plate had millikelvin (centikelvin) stability.
Sketch of the cross-section of apparatus 1 of Narezo Guzman et al. (Reference Narezo Guzman, Xie, Chen, Fernandez Rivas, Sun, Lohse and Ahlers2015). A transparent sapphire top plate of the cell and the window at the top of the apparatus allowed the illumination and flow visualization through the top; visualization from the side was not possible in this apparatus.

In practice, the dissipated electrical power of the heater
 $P_{{\it\Omega}}$
equalled the heat current entering the whole system, i.e. the sidewall, the actual RBC flow, and any other part of the apparatus. The quantity of interest was the heat current entering the RBC flow. In order to determine it, we made measurements with an empty cell pumped down to a pressure of approximately 3 kPa where convection will not occur in the remaining air. After correcting for the conduction by the quiescent air in the sample cell we refer to this as
 $Q_{sw}$
. The heat current entering the RBC flow was then given by
 $Q=P_{{\it\Omega}}-Q_{sw}$
. Typically we found
 $0.16\lesssim Q_{sw}/Q\lesssim 0.26$
, where the ratio decreased for increasing superheat.
3.3 Apparatus 2: imaging from the side
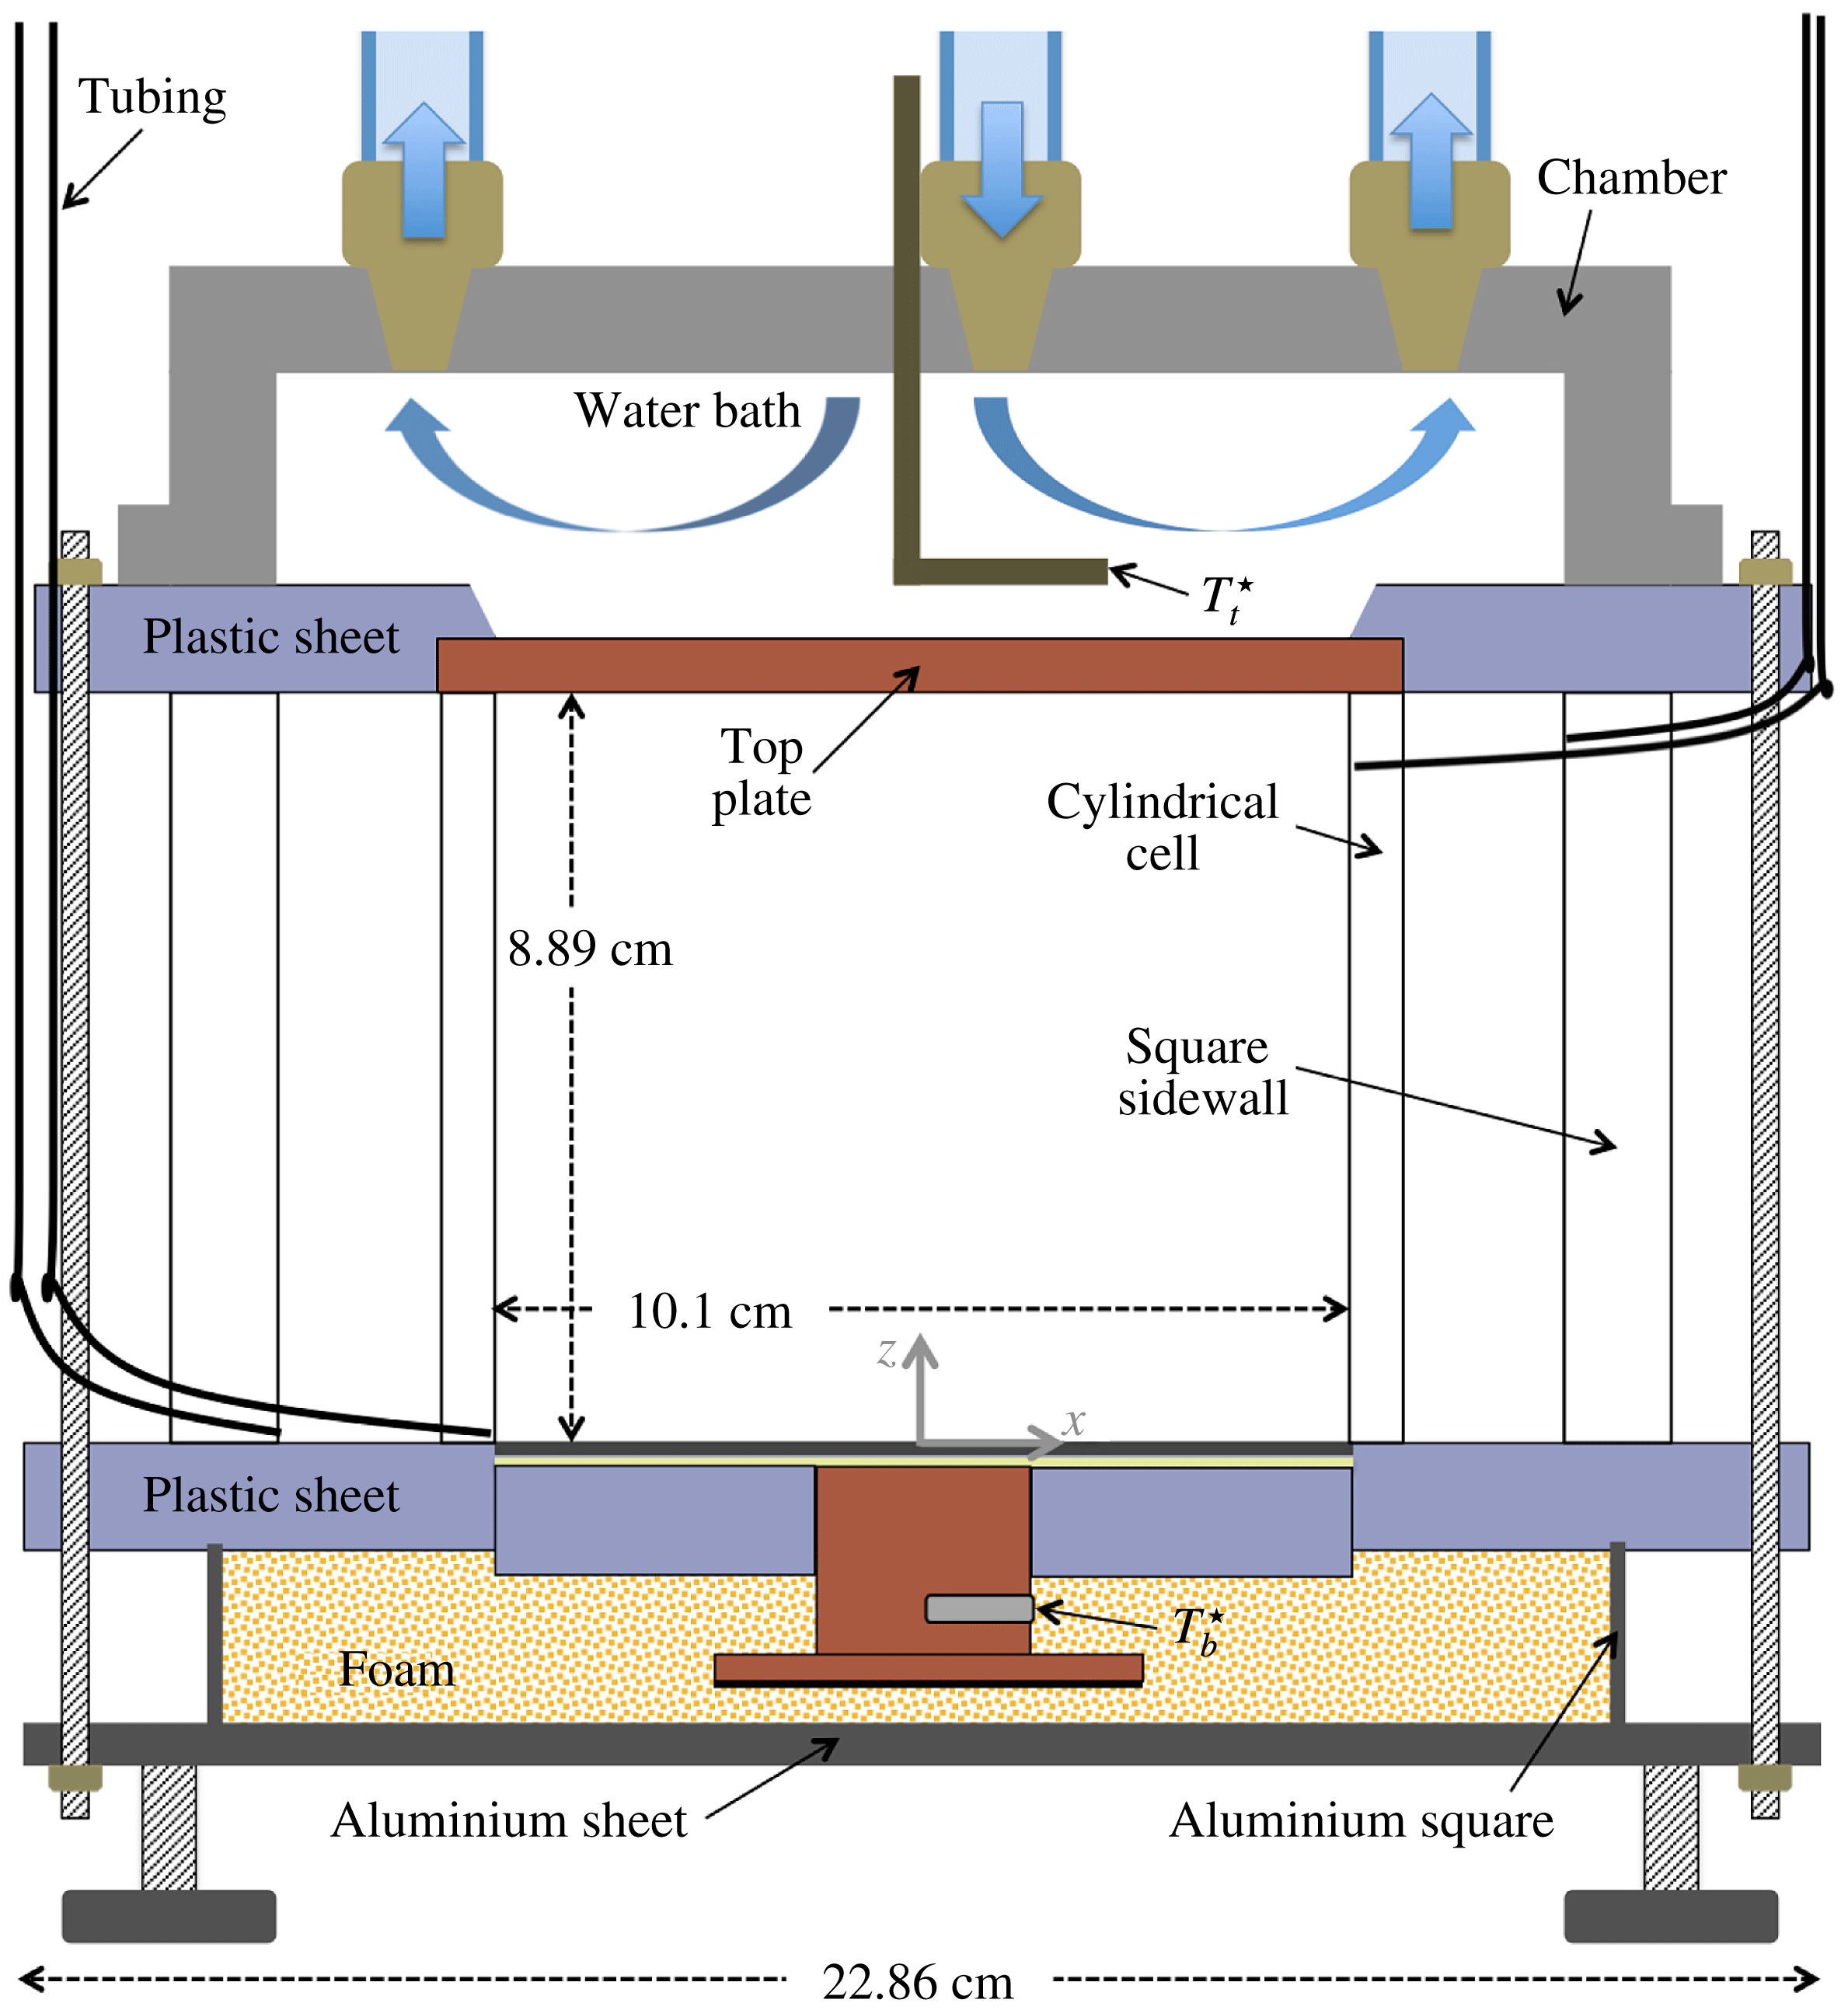
The apparatus for side visualization of the flow was inspired by the work of Xi, Lam & Xia (Reference Xi, Lam and Xia2004). A sketch of the vertical cross-section through its centre is shown in figure 2. It consisted of a cylindrical convection cell which was embedded in a larger volume of fluid contained by square sidewalls in order to reduce the image distortion due to the curvature of the cell walls. Both walls were transparent and the setup allowed for the exchange of the bottom plates in order to study two-phase flow with wafers of different cavity separation
 $l$
.
Sketch of the cross-section of apparatus 2. The cylindrical cell was contained inside a square sidewall. Both cell wall and sidewall were transparent and contained liquid. The bottom plate was interchangeable, allowing for the visualization of bubble formation at wafers with different cavity separations.

The cylindrical sidewall was made of acrylic. It was 8.89 cm high, 0.64 cm thick and had an inner diameter of 10.16 cm (
 ${\it\Gamma}=1.14$
). The square sidewall was made of polycarbonate. The top and bottom round plates of the convection cell were embedded in square plastic (polycarbonate) sheets. The top plate had a diameter of 11.43 cm, was 0.64 cm thick and was made of copper.
The top plate was cooled by a water bath and its temperature was regulated by a cooler/circulator (Neslab RTE 7, Thermo Electronic Corporation) within 0.01 K. A thermistor (same type as that which measured
 $T_{b}^{\star }$
) was inserted into an aluminium tube (L shaped) and measured the water-bath temperature which was assumed equal to the upper-face temperature
 $T_{t}^{\star }$
of the top plate. Both sidewalls were compressed between the bottom and top square sheets, sealing the setup. The bottom-plate temperature was computer controlled and had millikelvin stability. The set-up had three adjustable legs that were used to level it.
The square sidewall had two holes close to its bottom and two close to its top on opposite sides. Plastic tubes passed through each hole, and at their far ends (outside the apparatus) they could be connected to reservoir bottles. At the other end, two of the plastic tubings (one at the top and one at the bottom) ended flush at the inner side of the square sidewall and the other two were connected to the inner (cylindrical) sidewall through two holes (top and bottom and at diametrically opposed locations). Having two connectors (inlet and outlet) for both cell and sidewall enabled us to independently fill the two chambers with liquid.
3.4 Experimental procedure
The cell-filling procedure described by Narezo Guzman et al. (Reference Narezo Guzman, Xie, Chen, Fernandez Rivas, Sun, Lohse and Ahlers2015) for apparatus 1 was used also for apparatus 2. It consisted of heating the bottom plate to a temperature larger than the boiling temperature of the liquid by setting
 $T_{b}^{\star }=45\,^{\circ }\text{C}$
while the top plate was kept at
 $T_{t}^{\star }=15\,^{\circ }\text{C}$
. The reservoir bottle connected to the cell bottom and containing the liquid was then placed at a level above that of the top plate and the cell started filling. The superheated bottom plate assured that vapour would be trapped in the cavities, turning them into active nucleation sites. At the cold top plate most of the vapour condensed, preventing the loss of a large amount of fluid. Once the cell was filled, the 1.16 m tall liquid column in the tubing and reservoirs exerted a hydrostatic pressure of
 $P=117.6\pm 0.4$
kPa on the bottom plate.
In apparatus 2 the space between the cylindrical cell and the square sidewall was also filled with liquid. Once full, the same hydrostatic pressure was exerted on the bottom plastic sheet. The space between the cell and the sidewall, filled with liquid, helped to thermally isolate the flow inside the cell from temperature variations in the room.
The filling procedure was successful in apparatus 2 for the
 $l=0.60$
mm wafer, as the great majority of sites remained active once the cell was full. However, the same procedure led to the activation of only a few tens of sites (out of
 $N=1570$
) randomly located on the etched area of the
 $l=1.0$
mm wafer. In this case, when the cell filling started, all sites were active; but as the liquid level rose, more and more sites deactivated even after increasing
 $T_{b}^{\star }$
to 47 °C. This differs from apparatus 1, where this filling procedure was successful also for
 $l=1.0$
mm (Narezo Guzman et al.
Reference Narezo Guzman, Xie, Chen, Fernandez Rivas, Sun, Lohse and Ahlers2015). It is apparent that the vapour trapping in the cavities is a subtle procedure the success of which can be influenced by uncontrolled small details.
All measurements were made at a constant temperature difference
 $T_{b}^{\star }-T_{t}^{\star }=20$
K. A run with actively nucleating sites will be referred to as two-phase flow, while one with none of the sites nucleating will be called one-phase flow.
For the heat-flux measurements in apparatus 1 a sequence of measurements started with two-phase flow and typically
 $T_{b}^{\star }=45\,^{\circ }\text{C}$
and
 $T_{t}^{\star }=25\,^{\circ }\text{C}$
. The corresponding temperatures
 $T_{b}\simeq 41\,^{\circ }\text{C}$
and
 $T_{t}\simeq 25.1\,^{\circ }\text{C}$
at the interface with the liquid of the top and the bottom plates were obtained by applying corrections for estimates of the temperature drops in the plates. Once a statistically stationary flow was reached (typically after less than a day for one-phase flow and between a day or two for two-phase flow), the time-averaged heat current
 $Q$
was determined (typically over about 3–4 h). Also during this period a high-speed movie was taken from the top, focusing on the nucleation of bubbles at the bottom plate. Then both
 $T_{b}^{\star }$
and
 $T_{t}^{\star }$
were lowered (typically in steps of 1 K),
 $Q$
was acquired and a new movie was recorded. The process continued until none of the sites remained active and the system had entered the one-phase flow state. Thereafter
 $T_{b}^{\star }$
and
 $T_{t}^{\star }$
were increased (typically in steps of
 $2$
or
 $3$
K) and no sites reactivated; we measured
 $Q$
of the superheated one-phase flow.
The liquid in the cell was not fully degassed and thus the saturation temperature was reduced (this effect was reported also by Murphy & Bergles (Reference Murphy and Bergles1972) and by Steinke & Kandlikar (Reference Steinke and Kandlikar2004)). If the liquid had been fully degassed, the saturation temperature would have been
 $T_{{\it\phi}}=38.5\,^{\circ }\text{C}$
at the prevailing pressure. From seven sets of experiments (each set consisted of one- and two-phase flow measurements) in apparatus 1, Narezo Guzman et al. (Reference Narezo Guzman, Xie, Chen, Fernandez Rivas, Sun, Lohse and Ahlers2015) estimated the onset temperature of boiling to be
 $T_{on}=30.3\pm 1.1\,^{\circ }\text{C}$
. Based on
 $T_{on}$
and assuming no temperature dependence of Henry’s law constant, the dissolved air concentration in the liquid was estimated to be 20–25 % by volume.
We focused on one- and two-phase flow at
 $T_{b}^{\star }=45\,^{\circ }\text{C}$
and
 $T_{t}^{\star }=25\,^{\circ }\text{C}$
for flow visualization in apparatus 2. All movies were recorded when the system was in a statistically stationary state.
3.5 Imaging procedures
We used a high-speed camera (Photron Fastcam Mini UX100) with either one of two lenses (Micro Nikor 105 mm,
 $f/2.8$
and AF Nikkor 50 mm,
 $f/1.4$
) to obtain videos of the phenomenon of interest. Two methods of visualization were employed. One of them consisted of direct illumination and recording the scattered light with the camera. This method was well suited for the visualization of bubbles but did not reveal more subtle optical phenomena associated with the plumes and the LSC. The other was the shadowgraph method described in detail by de Bruyn et al. (Reference de Bruyn, Bodenschatz, Morris, Trainoff, Hu, Cannell and Ahlers1996). It produces an image of the two-dimensional Laplacian of the refractive index (proportional to that of the temperature) in a plane orthogonal to the light beam, averaged over the cell width in the direction of the beam. It provided excellent visualization of the plumes and any temperature variations associated with a prevailing LSC, albeit summed over the width of the sample.
3.5.1 Direct illumination method
Three desktop lamps (using 13 W, 800 lum bulbs each) were used simultaneously as the light source. In apparatus 1 only this method was used, with the camera looking and the lamps shining into the sample from above through the glass and sapphire windows as shown schematically in figure 1. The lamps remained on throughout all measurements, even for the one-phase flow where no visualization was needed, in order to not alter their small but not negligible heat input. Typically the camera was focused on the area of the bottom-plate wafer where the bubbles were nucleated. Typical examples of the resulting images are shown in figures 4(a) and 4(b). A typical video obtained by this method was provided by Narezo Guzman et al. (Reference Narezo Guzman, Xie, Chen, Fernandez Rivas, Sun, Lohse and Ahlers2015) in their supplementary material.
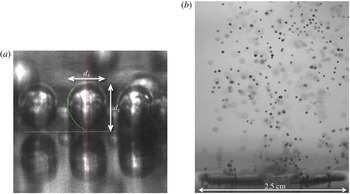
When visualizing from the side in apparatus 2, three sets of visualizations were made. In two of them, the light entered the apparatus from the side on which the camera was located and the camera recorded the back-scattered light. We shall refer to this as front illumination. The two sets differed only in the distance of the camera and lights from the apparatus, and thus in the size of the field that was recorded. They were used primarily for closeup studies of bubble nucleation and growth, as illustrated below in figure 5(a), and also to capture the rise of bubbles from the bottom to the top plate (see figure 8 d).
For closeup movies of the nucleation process, the camera was tilted by about 5° relative to horizontal in order to better capture the nucleation process. The effect of the tilt on the vertical size of the bubble was smaller than one pixel and smaller than other uncertainties. We focused on the front row of bubbles closest to the camera; nucleating sites further back were not visible as the front row blocked the view. At high enough bottom-plate temperatures (
 $T_{b}\gtrsim 38\,^{\circ }\text{C}$
) qualitative observation showed that the nucleating sites at the edge of the heated area behaved in the same way as other active site. For
 $T_{b}<38\,^{\circ }\text{C}$
bubbles nucleating at the edge of
 $A_{h}$
remained attached to the bottom surface for much longer times than bubbles nucleated farther away from the edge, restricting the study of the bubble-detachment process.
In the third set illumination was from the side opposite to where the camera was located, and we shall refer to it as back illumination. In that case, the light first passed through a translucent screen which gave a more diffused, uniform light field. The beam was directed toward the area of interest within the sample, and little if any of it entered the camera directly. This method worked well for the visualization of rising bubbles over a large part of the sample and yielded images such as that in figure 5(b) and in supplementary movie 2 available at http://dx.doi.org/10.1017/jfm.2016.178.
3.5.2 Shadowgraph method
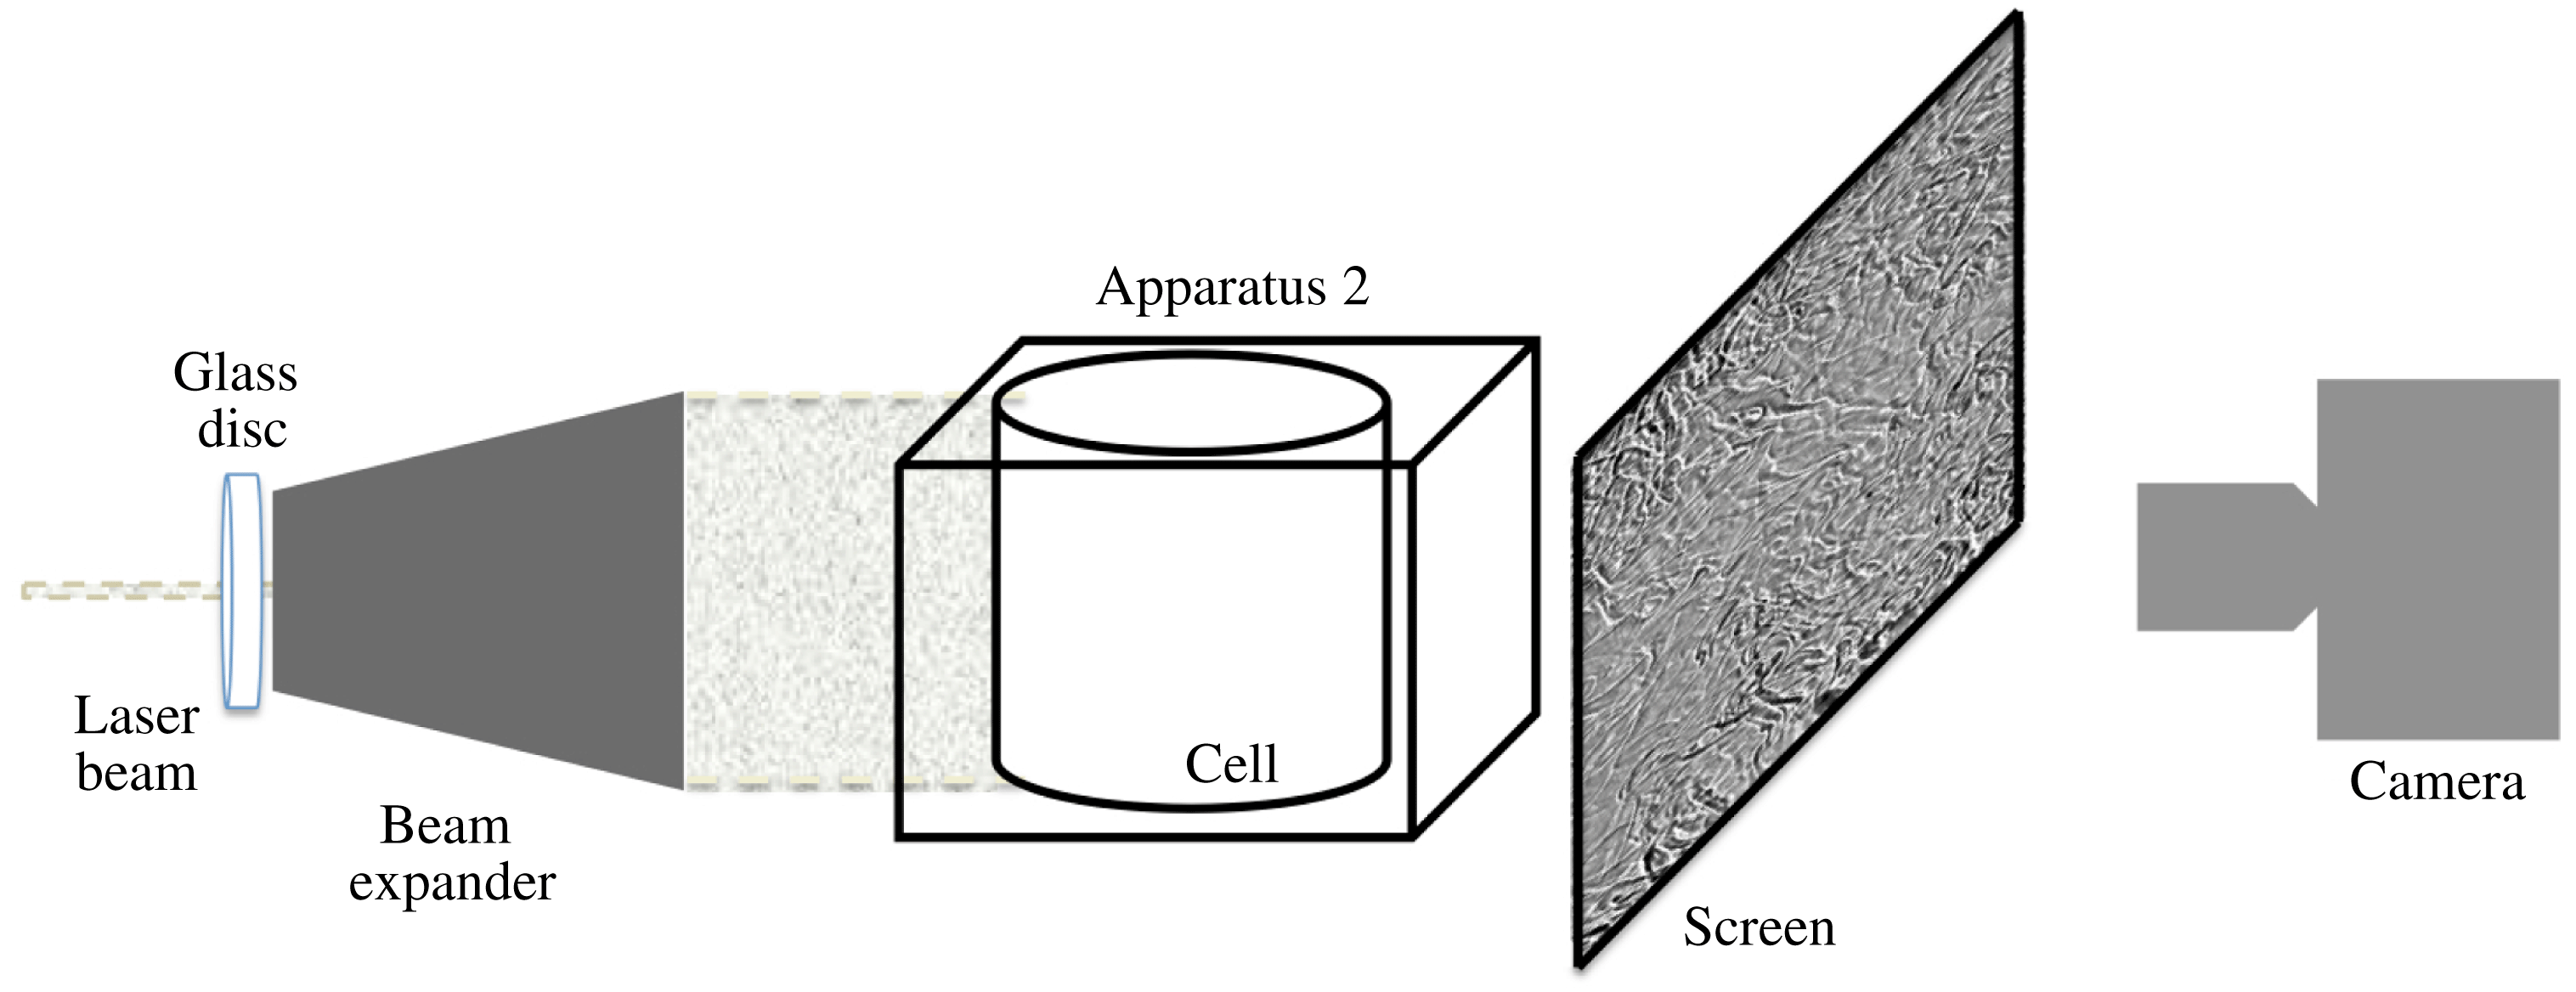
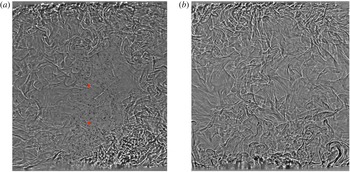
For shadowgraph visualization we used a procedure described by de Bruyn et al. (Reference de Bruyn, Bodenschatz, Morris, Trainoff, Hu, Cannell and Ahlers1996). A 5 mW helium–neon laser (Melles Griot, 633 nm) illuminated the flow. The beam first passed through a rotating sanded glass disk in order to destroy its coherence and prevent interference patterns due to light scattered from imperfections in the optics such as dust particles. It then passed through a beam expander (see figure 3). The expanded beam illuminated the entire cylindrical cell. A translucent screen was placed on the opposite side of the apparatus and the camera was focused on the screen from behind. The set-up was tilted by less than 1° in such a way that the LSC plane had a preferred orientation parallel to the visualization plane. The imaging area covered the cell from bottom to top. The vertical centreline of the image was aligned with the centre of the bottom plate. We visualized one- and two-phase flow by taking images at a rate of 50 f.p.s. Typical processed shadowgraph images (see § 3.6.1) are shown in figure 6(a) and (b).
Sketch of the shadowgraph technique used with apparatus 2 for side visualization.

3.6 Image analysis
3.6.1 Shadowgraph imaging
For all shadowgraph images the intensity of each pixel on every frame was divided by the intensity of the corresponding pixel from a background image. The background image was obtained by averaging the intensity of typically 1500 unprocessed frames. The ratio was rescaled to represent the appropriate grey levels.
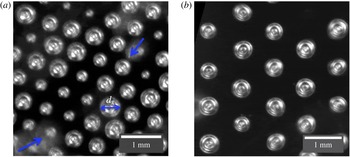
3.6.2 Nucleating bubbles: top visualization (apparatus 1)
Sections of two images showing nucleating vapour bubbles on wafers with
 $l=0.60$
mm and
 $l=1.0$
mm obtained in apparatus 1 are shown in figure 4. They are examples of images analysed to obtain the time series of the widths
 $d_{x}$
of the bubbles. From these time series we detected departure events, i.e. the time when a growing bubble reached a maximum size and detached from the nucleation site.
Bubbles, most of them attached to the wafer, viewed from the top in apparatus 1: (a)
 $l=0.60$
mm; (b)
 $l=1.0$
mm. The bright round shapes in focus are the attached bubbles; their diameters were defined as the widths
 $d_{x}$
as indicated by the double-headed arrow in (a). The cloud-like bright spots in (a) (see arrows) are bubbles that had departed from the surface and thus were out of focus. These departed bubbles blocked the view of the growing bubbles underneath them.

Detached bubbles were dragged horizontally by the LSC as they rose. They were out of focus and caused blurry bright spots. They blocked the view of attached growing bubbles below them as seen in the bottom left corner of figure 4(a), where the contours of two growing bubbles can not be identified very well.
We analysed high-speed image sequences for several
 $T_{b}$
for
 $l=2.0$
,
 $1.0$
and 0.60 mm. The various steps involved are described in appendix A. For wafers with
 $l=1.0$
and 0.60 mm and for most
 $T_{b}$
values we analysed more than 2500 departing bubbles. In the case of
 $l=2.0$
mm, very few sites were active, and in addition the rate of nucleation of each active site decreased with decreasing superheat. Therefore, for
 $T_{b}-T_{on}=11.85$
, 9.95 and 7.98 K, we were able to consider only 1637, 413 and 140 departing events, respectively.
Images to binary form were used to count the number of active sites
 $N_{a}$
for each
 $T_{b}$
and
 $l$
value. As
 $T_{b}$
was reduced,
 $N_{a}$
decreased. For the smaller superheats some sites behaved differently: they nucleated very small bubbles at a very high rate whereas other sites nucleated larger bubbles at a lower rate. For low
 $T_{b}$
some sites nucleated small and large bubbles intermittently. We considered all sites for the total count of
 $N_{a}$
, regardless of whether they nucleated larger or smaller bubbles or both.
3.6.3 Nucleating bubbles: side visualization (apparatus 2)
Images of vapour bubbles right before departure from the
 $l=0.60$
mm wafer were selected from high-speed movies recorded in runs for
 $T_{b}-T_{on}=9.8$
, 8.8, 7.8 K using the front-illumination method (see § 3.5.1). As will be seen below in § 4.2.1, the bubble sizes and shapes within our resolution did not depend on
 $T_{b}-T_{on}$
. We were able to select 70 images from the three runs with contours at time of departure that were discernible from the bubble cap down to
 $1/3$
of the vertical bubble length
 $d_{z}$
above the wafer or lower. We extracted
 $d_{z}$
and the horizontal widths
 $d_{x}$
and calculated the bubble aspect ratios
 ${\it\Gamma}_{b}=d_{x}/d_{z}$
. In figure 5(a)
 $d_{x}$
and
 $d_{z}$
are indicated for a bubble just before departure.
Bubbles for
 $l=0.60$
mm and
 $T_{b}=40.1\,^{\circ }\text{C}$
. (a) Closeup view of three bubbles obtained by the front-illumination method. The horizontal dashed line represents the liquid-wafer interface. The objects below it are the reflections of the bubbles in the wafer surface. The vertical and horizontal bubble lengths
 $d_{z}$
and
 $d_{x}$
are indicated. The contact angles between the bubbles and the wafer at departure were estimated from this and similar images (see supplementary movie 1). (b) A snapshot of two-phase flow obtained by the back-illumination method showing a region above the wafer that was 3.2 cm high and 2.5 cm wide. A time sequence of similar images (see supplementary movie 2) was used to estimate the velocity and volume of several bubbles from their departure time until they disappeared or were out of view.

The left half-contour for the bubble in the centre of figure 5(a) is shown as a dotted green line, together with a vertical solid line along the rotation axis of that bubble. Each half-contour with a clear shape was considered as a surface of revolution. The results of both half-contours of a given bubble were averaged and used to calculate the bubble volume
 $V$
at departure.
For
 $l=0.60$
mm, 31 of the 70 bubbles showed a clear contour all the way down to the attachment at the wafer at the time of departure. For those cases the contact angle between the bubble contour and the wafer surface could be measured and was found to be
 ${\it\beta}\simeq 40\pm 5^{\circ }$
.
For
 $l=1.0$
mm only a few sites, randomly distributed over
 $A_{h}$
, were active. For
 $T_{b}-T_{on}=10.6$
K we were able to use a total of 33 bubbles to obtain
 $d_{x}$
and
 $d_{z}$
. We found 19 bubbles that were sufficiently clearly visible at departure to obtain
 $V$
. For those, the contact angle was estimated as well and found to be
 ${\it\beta}\simeq 45\pm 5^{\circ }$
, equal to the result for
 $l=0.60$
mm within the uncertainties.
3.6.4 Bubbles rising from the wafer through the turbulent bulk
Movies capturing the bubbles rising across the cell from the bottom to the top plate (see figure 8
d) were recorded using the front-illumination method. Each of many bubbles was followed along its rising path until, due to both condensation and dissolution, it became too small to be resolved or until it reached the top plate. We tracked the horizontal and vertical bubble location
 $(x,z)$
in a sequence of images separated in time
 $t$
by intervals
 ${\rm\Delta}t$
, which were not necessarily equal along a single path. The horizontal and vertical velocity components
 $U_{x}$
and
 $U_{z}$
were obtained as a function of
 $t$
or
 $z(t)$
using finite differences:
 $$\begin{eqnarray}U_{x}(t_{i})=U_{x}(z(t_{i}))=\frac{x(t_{i}+{\rm\Delta}t_{i}/2)-x(t_{i}-{\rm\Delta}t_{i}/2)}{{\rm\Delta}t_{i}},\end{eqnarray}$$
where
 ${\rm\Delta}t_{i}=t_{i+1}-t_{i}$
was the time difference between consecutive analysed frames
 $i$
and
 $i+1$
. Here
 $U_{z}(t_{i})$
and
 $U_{z}(z(t_{i}))$
were similarly defined. The origins
 $t=0$
and
 $z=0$
were taken as the time and location of a bubble immediately after detaching from the surface. Therefore,
 $z/L=0$
had an uncertainty about equal to the original vertical size of a bubble. For the case in which the whole cell was captured in the images, the spatial resolution was such that the bubbles were nearly point-like objects, and thus the uncertainty in their spatial location was about the size of the bubble itself.
3.6.5 Departed bubbles close to the bottom plate
In order to obtain the time evolution of the velocity and diameter of a bubble right after it detached, we focused on the nucleating sites closest to the camera where the bubbles could be seen at the departure time. For
 $T_{b}-T_{on}\simeq 10$
K we recorded the range from
 $z/L=0$
and
 $z/L\simeq 0.36$
. The 2.54 cm diameter of the nucleating area (see figure 5
b) was used to calibrate the distance between pixels, which was found to be
 $0.025\pm 0.005$
mm. Only bubbles that did not merge with other bubbles were used. They were located near or at the periphery of the etched area closest to the camera because only those are observable with the method used, but they nucleated at many different azimuthal locations. The bubble-centre location was tracked in time; the uncertainty associated with the bubble location was less than
 $\pm 0.1$
mm. Both vertical and horizontal velocity components were calculated, as indicated by (3.1).
Shadowgraph images of turbulent Rayleigh–Bénard flow for a superheat
 $T_{b}-T_{on}\simeq 10$
K,
 $Ra\simeq 1.9\times 10^{10}$
(
 ${\rm\Delta}T\simeq 16$
K) and
 $l=0.60$
mm. The bottom and top plates can be seen at the very bottom and top of the images. The cell was very slightly tilted (the left side was lower than right). (a) Two-phase flow. Hot thermal plumes rise on the right and are diminished as they travel toward the top plate. Cold plumes generated at the top plate move laterally to the left, and travel towards the bottom plate along the left side. Vapour bubbles (dark small spots) that nucleated at the central area of the bottom plate detached and rose. The vertical location of thermistors inserted into the flow is indicated by slightly larger red circles. (b) One-phase flow. Hot plumes travelled mostly upwards and cold ones downwards without establishing a well-defined circulatory motion. See supplementary movies 3 and 4 corresponding to (a) and (b) respectively.

Bubbles that did not merge with other rising bubbles were (within our resolution) spherical at all times except for some bubbles that were ellipsoidal only briefly after departure. The eccentricity (major axis divided by minor axis assuming azimuthal invariance) of the ellipsoidal bubbles was typically smaller than 1.2. We fitted either a circle or an ellipsoid to each bubble and obtained the bubble diameters
 $d_{x}$
along their rising path. In the case of elliptic shapes, we used the equivalent diameter, i.e. the diameter of a spherical bubble of the same volume.
4 Results
4.1 Flow visualization from the side
4.1.1 Shadowgraph images
Figures 6(a) and 6(b) show shadowgraph images of two- and one-phase flow, respectively. They are for
 $T_{b}-T_{on}\simeq 10$
K, corresponding to
 $Ra\simeq 1.9\times 10^{10}$
. Corresponding movies can be found in the supplementary material. One can see that the thermal plumes and any large-scale flows had different structures and dynamics in the presence and absence of vapour bubbles. In the two-phase flow (figure 6
a and the corresponding supplementary movie 3) hot thermal plumes, mainly produced at the heated area of the bottom plate, drove and were carried by a LSC. They moved laterally to the right just above the bottom plate and then rose along the side of the cell that was higher due to the deliberately introduced small tilt of the cell. Due to thermal dissipation they became weaker along their path, with only a fraction reaching the top plate. Cold plumes were emitted along the entire top plate. They moved to the left under the influence of the tilt, and then descended along the left sidewall. They too were diminished along their path due to thermal dissipation, and very few reached the bottom plate. Only a small number of plumes were found near the sample centre. The structure of the LSC is qualitatively similar to that observed for classical RBC where both plates are heated or cooled over their entire area (Xi et al.
Reference Xi, Lam and Xia2004). There is, however, a quantitative difference in that the hot plumes generate a very intense rising flow near the cell wall while the cold ones produce a much weaker descending flow just inside the opposite part of the wall.
The rising bubbles (small black solid dots), which nucleated at the central heated area of the bottom plate where the nucleation sites were located, rose with a speed that was much larger than the characteristic LSC speed. Although near the plate they were dragged sideways a short distance by the LSC, over their entire path they moved more nearly in a vertical direction and did not follow the lateral motion of the plumes and the LSC. In this particular run a large number of bubbles reached the top plate. We present it here because the rising bubbles are clearly identifiable. Under our standard experimental conditions (air concentration between 20 % and 25 % by volume, see Narezo Guzman et al. (Reference Narezo Guzman, Xie, Chen, Fernandez Rivas, Sun, Lohse and Ahlers2015)) in both sets of apparatus, most bubbles fully vanished (condensed and/or dissolved) before they came close to the top plate. A longer lifetime was due to a higher concentration of dissolved air in the liquid, which nevertheless remained below the saturation concentration (see § 4.1.2). The air concentration did not affect the qualitative features of the LSC.
Although heating took place only over the central area
 $A_{h}$
, lateral heat flow through the silicon wafer and polycarbonate ring (see figures 1 and 2) assured that the temperature difference between the top plate and all lateral positions of the bottom plate was large enough to drive turbulent flow. Just below the sidewall this difference was measured to be about
 $0.6{\rm\Delta}T$
. Thus, especially in one-phase flow, we observed hot plumes emitted over the entire bottom plate, although their abundance was greater over the central area
 $A_{h}$
. This can be seen in figure 6(b) and the corresponding supplementary movie 4. In our experiment, where heating was localized over the central area
 $A_{h}$
, one-phase flow did not produce a well-defined LSC as can also be seen in the figure and the movie. This finding contrasts with the well-known single-roll structure of the LSC for classical
 ${\it\Gamma}\simeq 1$
RBC where the heat input is uniformly distributed over the bottom plate (see, for instance, Xi & Xia (Reference Xi and Xia2008) and Ahlers et al. (Reference Ahlers, Grossmann and Lohse2009)).
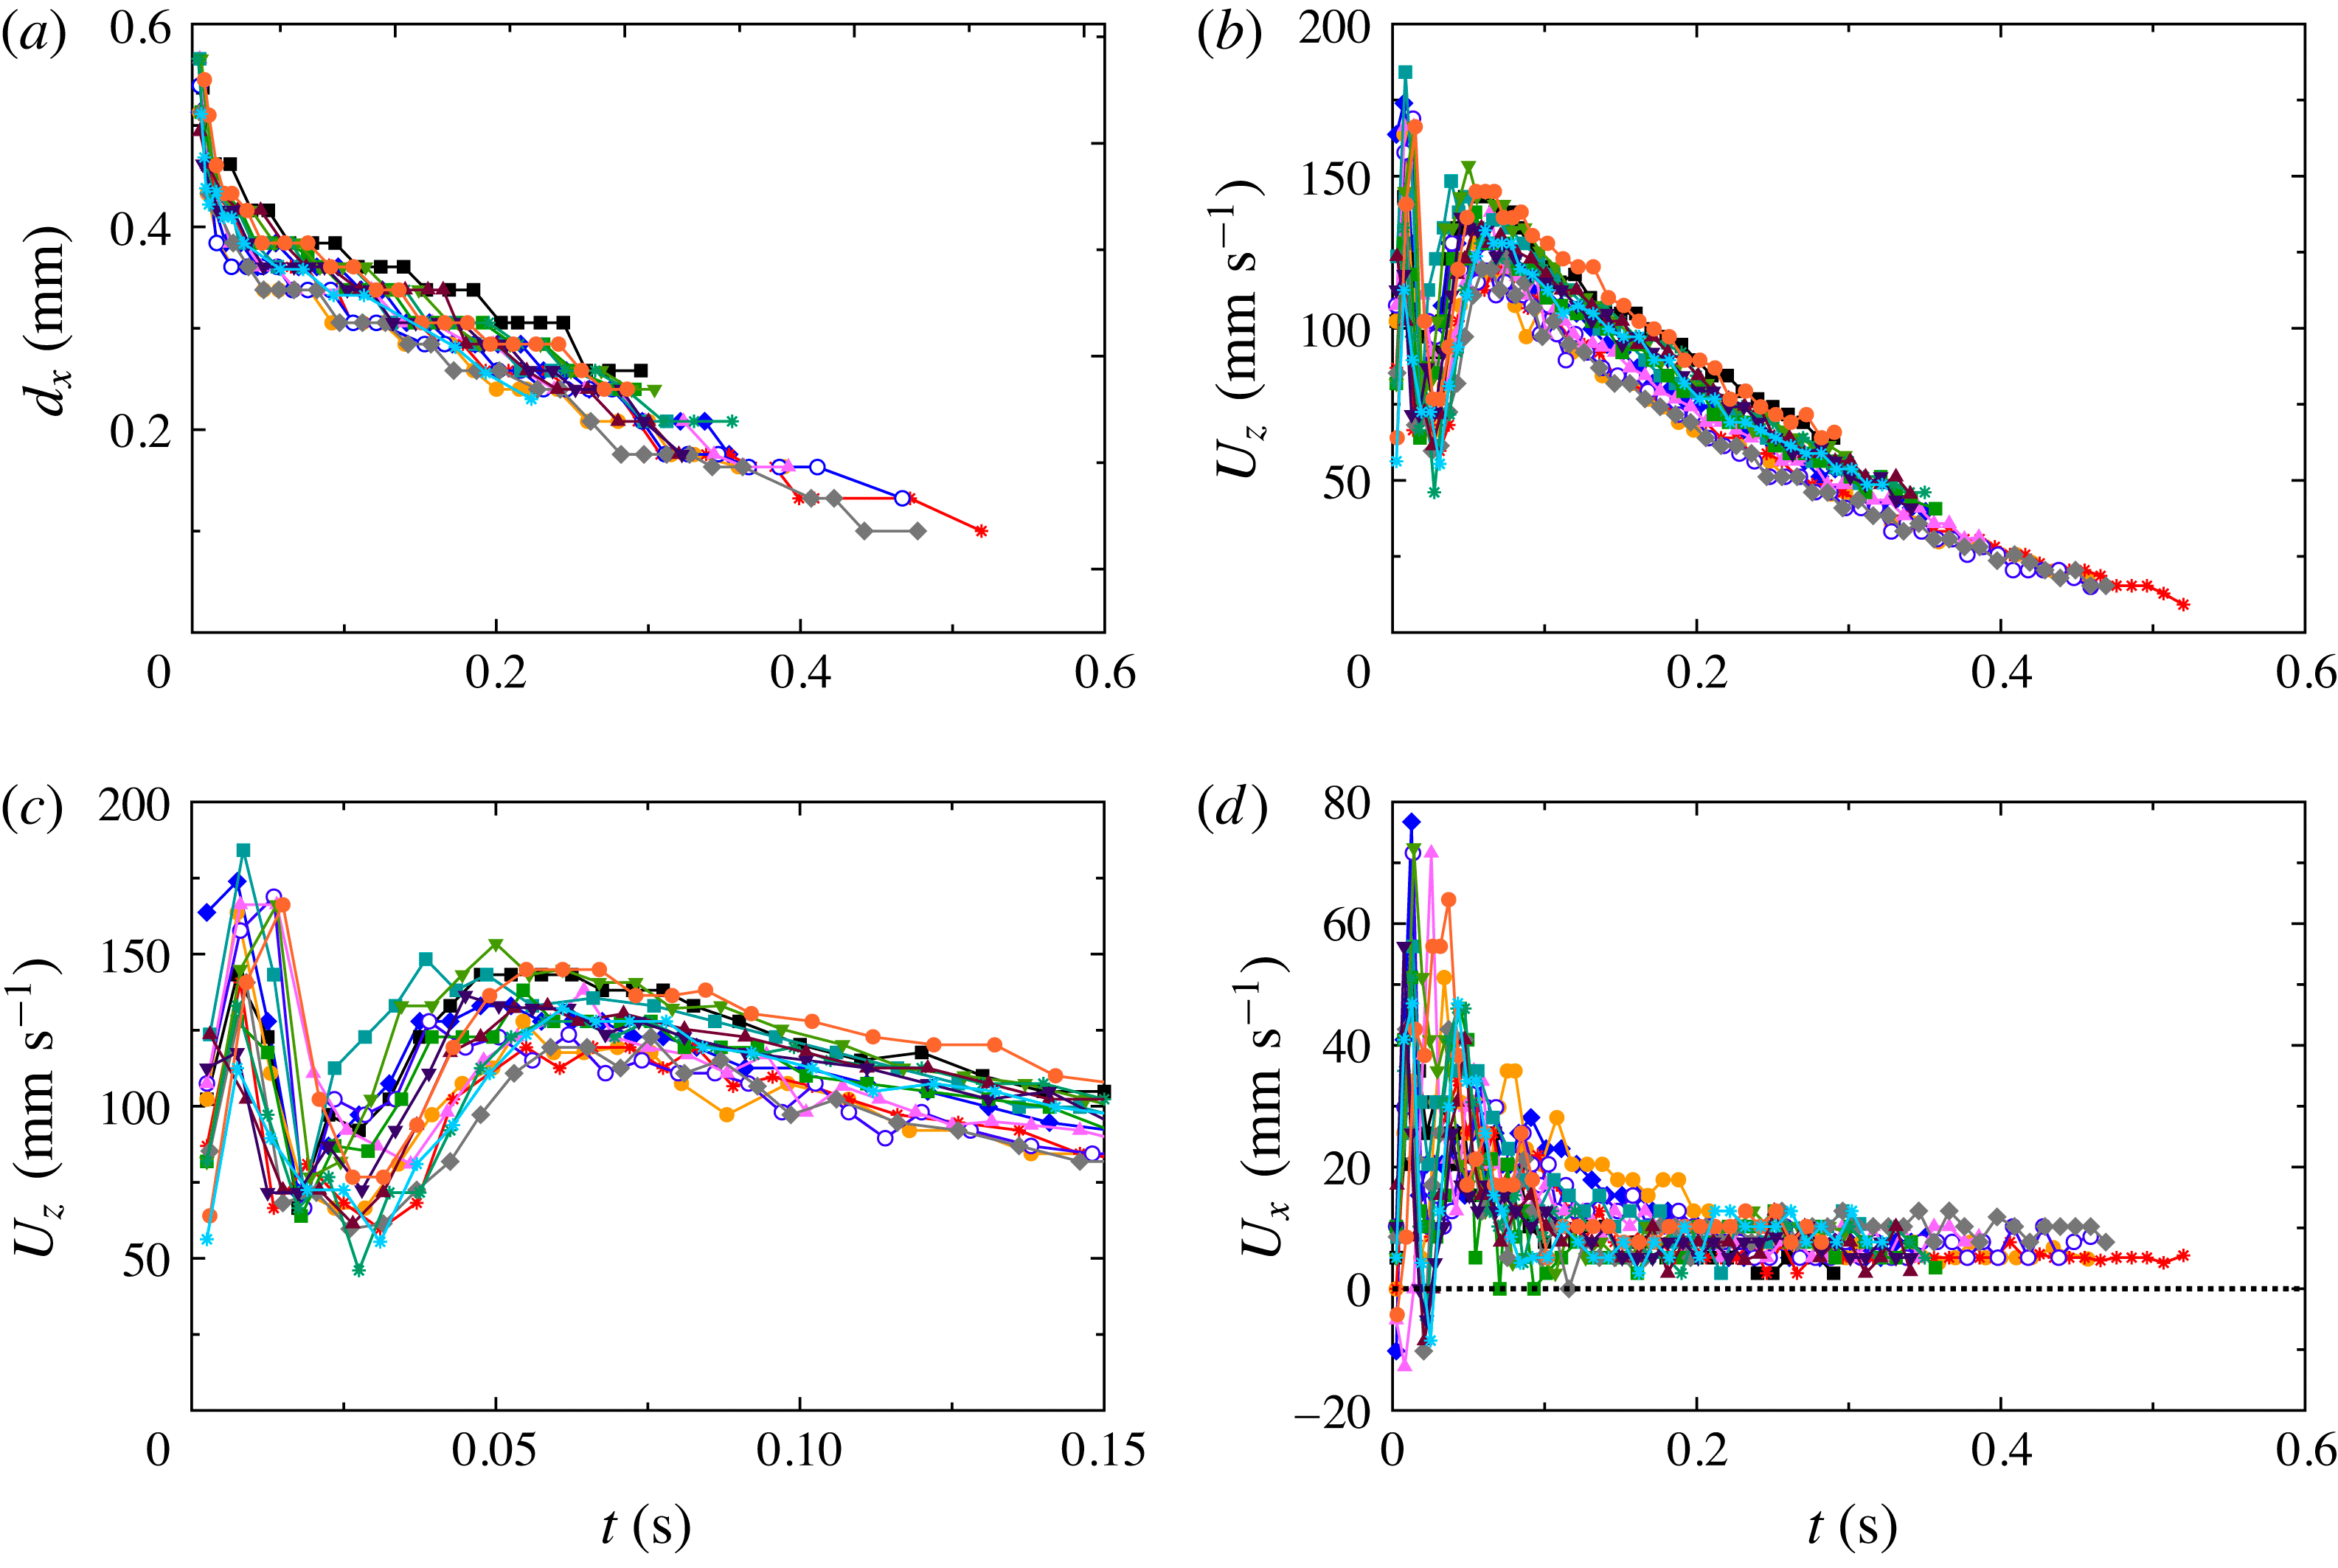
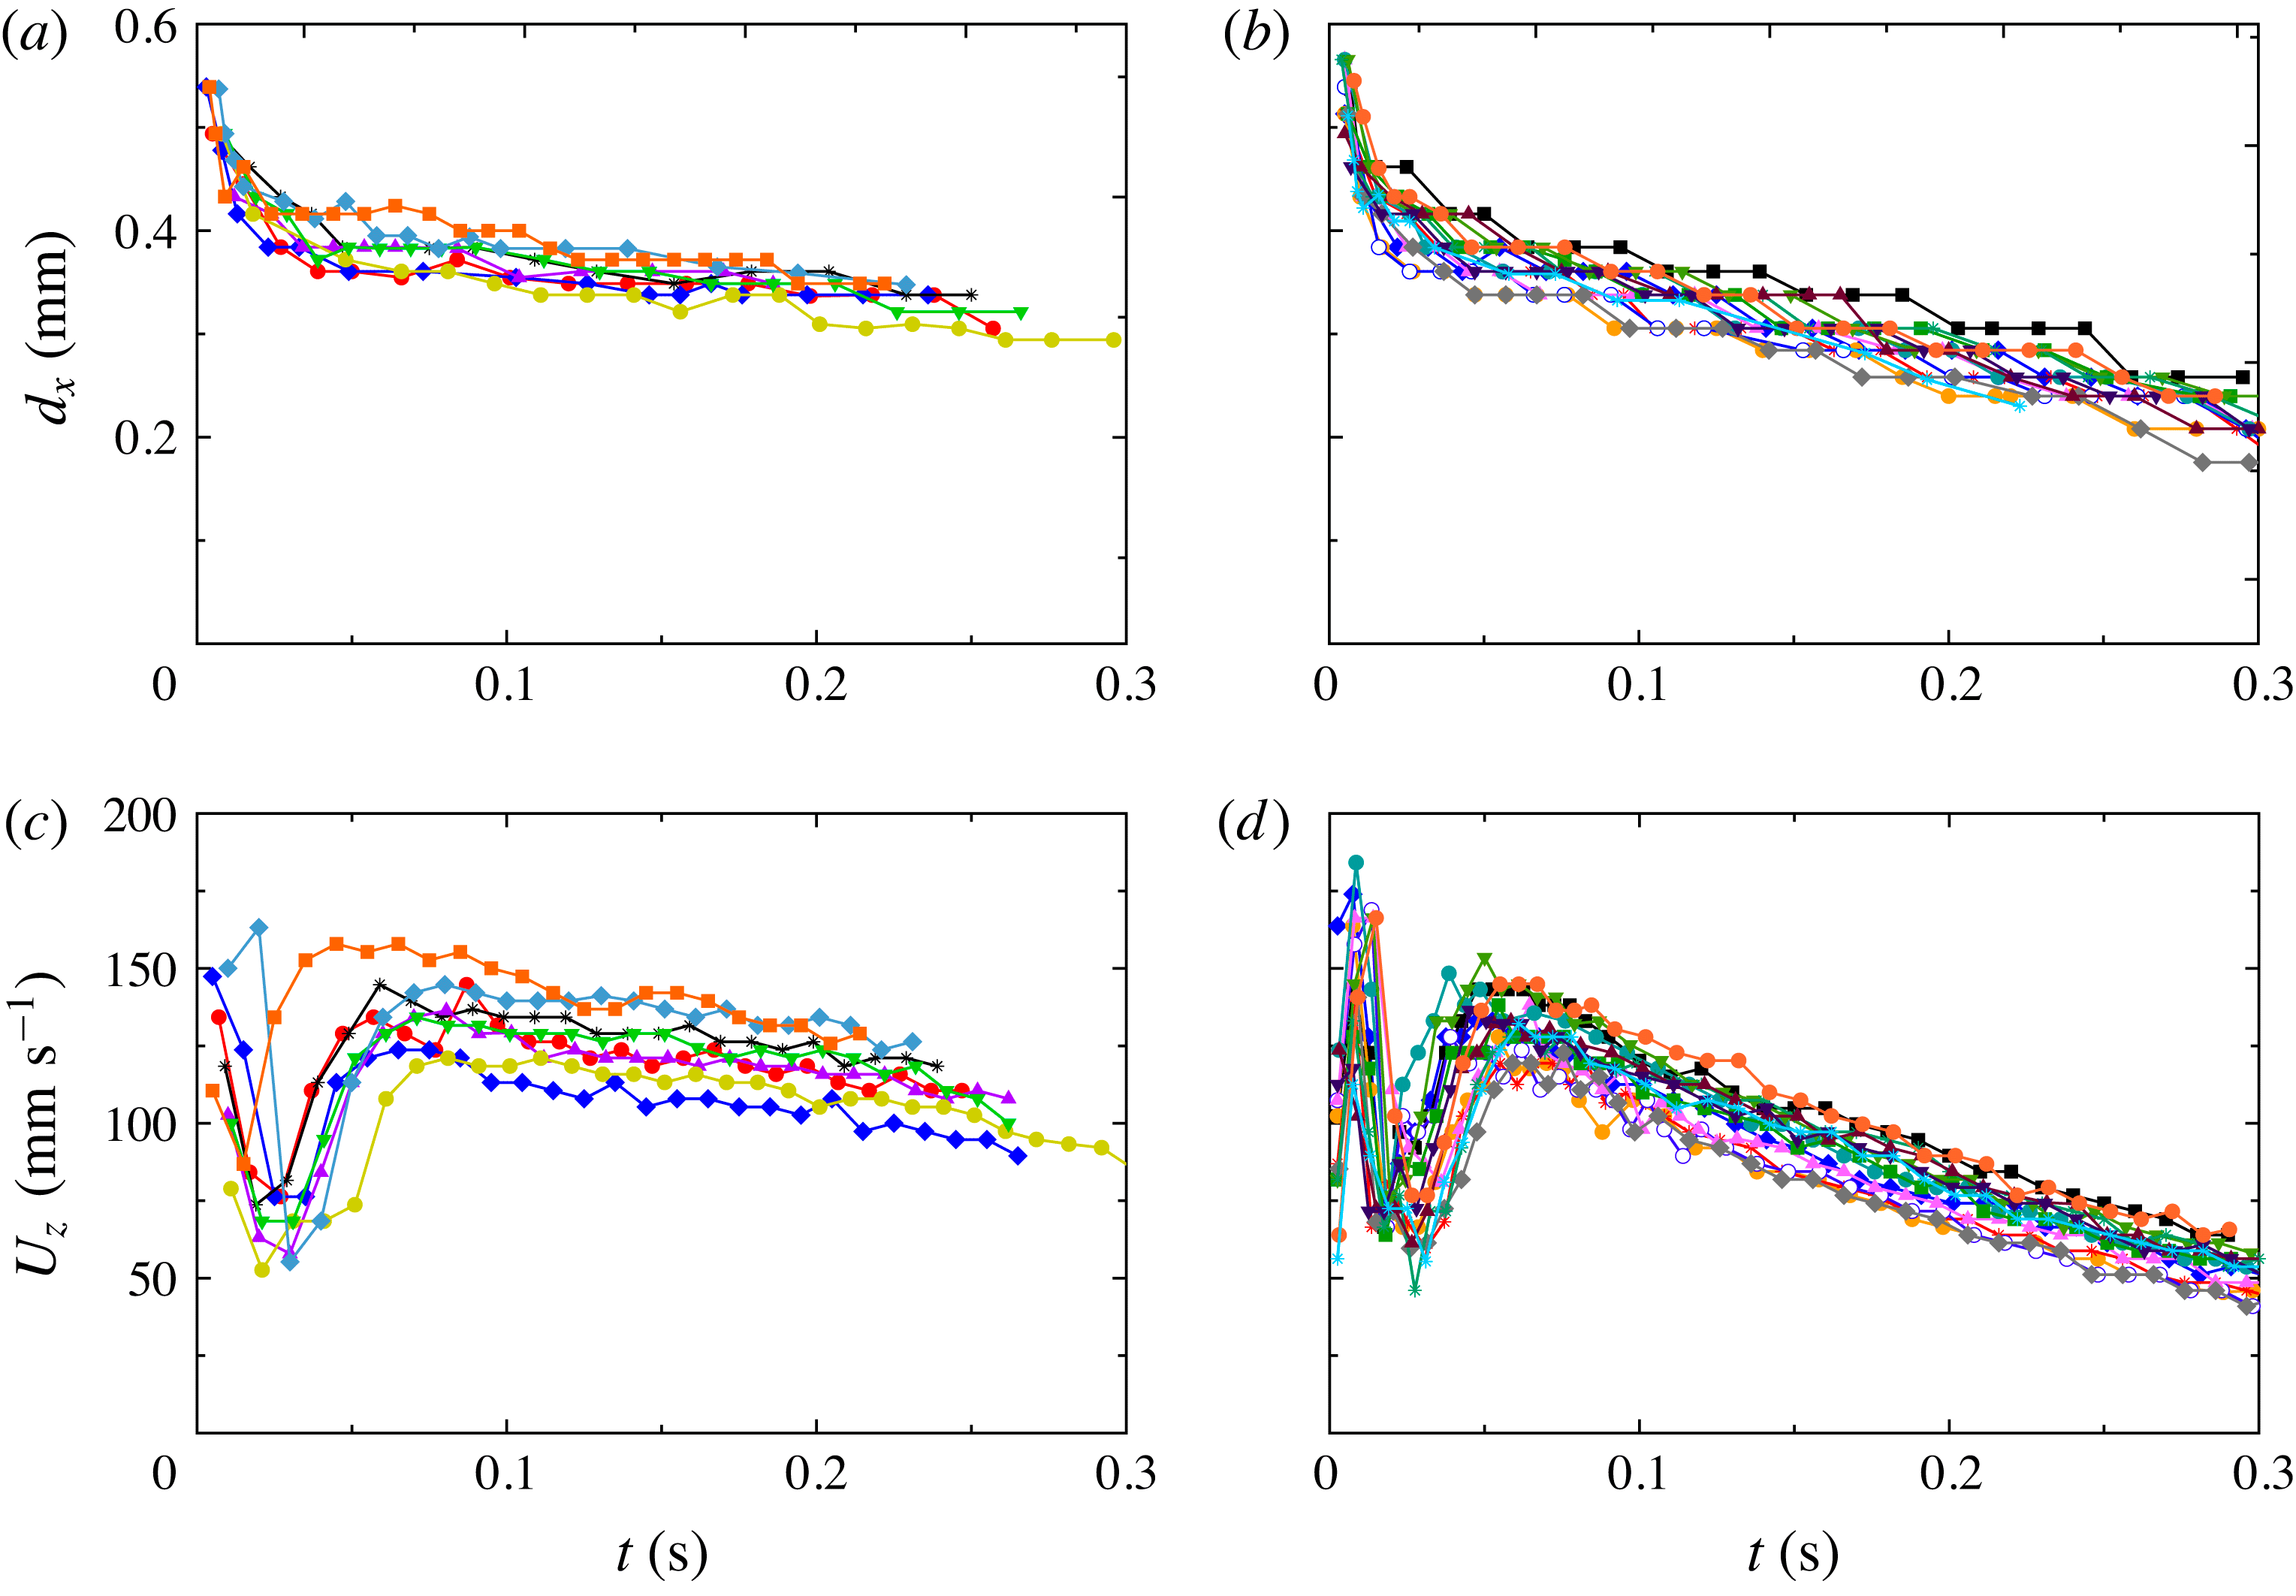
Dynamics of bubbles (
 $l=0.60$
mm) as they rose from
 $z/L=0$
to
 $z/L\simeq 0.4$
: (a) diameter
 $d_{x}$
as a function of time; (b) vertical velocity component
 $U_{z}$
(same colour and symbol represent the same bubble as in (a)) as a function of
 $t$
; (c) same as (b), but with the horizontal scale expanded; (d) horizontal velocity component
 $U_{x}$
as a function of
 $t$
.

Interestingly, for two-phase flow and a superheat of about 6 K or more a well-defined single-roll LSC was found (see figure 6
a and the supplementary movie 3), similar to that of classical RBC. The transition from disordered flow to a single-roll LSC in the two-phase case provides an explanation for relatively sharp changes in some other quantities reported previously by Narezo Guzman et al. (Reference Narezo Guzman, Xie, Chen, Fernandez Rivas, Sun, Lohse and Ahlers2015). These authors found that the skewness
 $S$
of the local temperature probability distribution measured at the two locations
 $z/L=0.28$
and
 $z/L=0.50$
along the vertical axis of the cell was modified by vapour bubbles. The skewness was positive for one-phase flow, being slightly larger closer to the bottom plate. For superheat values larger than about 6 K
 $S$
was reduced in two-phase flow relative to the single-phase value, with a larger reduction closer to the plate. For the largest superheat values
 $S$
became negative. Shadowgraph visualization provided insight into these results. The location of the thermistors used by Narezo Guzman et al. (Reference Narezo Guzman, Xie, Chen, Fernandez Rivas, Sun, Lohse and Ahlers2015) to measure local temperature time series is indicated in figure 6(a) (red dots). The shadowgraph movie for one-phase flow shows that the number of plumes passing by the thermistor at
 $z/L=0.28$
was larger than that passing
 $z/L=0.50$
. This explains the larger value of
 $S$
closer to the bottom plate. The shadowgraph movie for two-phase flow explains why
 $S$
was reduced in the presence of bubbles, as a LSC roll swept the hot plumes sideways close to the bottom plate and reduced the number of plumes rising vertically across the cell centre where the thermistors were located. In two-phase flow the probability of hot plumes passing by the thermistor at
 $z/L=0.28$
was larger than it was at
 $z/L=0.50$
. If only hot plumes determined
 $S$
in two-phase flow, one would expect a larger (positive)
 $S$
closer to the bottom plate than at mid-height, opposite to the results of Narezo Guzman et al. (Reference Narezo Guzman, Xie, Chen, Fernandez Rivas, Sun, Lohse and Ahlers2015). This supports their conclusion, based on the argument of Lakkaraju et al. (Reference Lakkaraju, Toschi and Lohse2014), that bubbles homogenized the temperature field in the bulk, especially close to the bottom plate where the bubbles are bigger (see § 4.1.2) and thus had a larger heat capacity.
4.1.2 Size of bubbles after departure
In figure 7(a) the temporal evolution of the bubble diameter
 $d_{x}$
of 15 non-merging bubbles after detaching from the bottom plate is shown. Note that the initial bubble-diameter values shown in figure 7(a) (
 $d_{x}(t=0)\sim 0.5$
mm) are consistent with the width
 $d_{x,max}$
right before departure obtained in § 4.2 below. Two of the tracked bubbles had vanished (condensed and dissolved) almost completely at
 $t\simeq 0.5$
s. The rest of the bubbles continued their rising motion outside of the viewed region. Within about 0.05 s after a bubble detached from the plate, its diameter
 $d_{x}$
typically was reduced by about
 $1/3$
of its initial value. The vertical location of bubbles at that point was between 4 and 5 mm above the surface. However, it was within about the first 0.01 s after departure and within about 1 mm above the surface that
 $d_{x}$
decreased at the highest rate. We estimated that the average volume rate of change of a bubble was about
 $3~\text{mm}^{3}~\text{s}^{-1}$
during the first 0.01 s. For
 $t>0.01$
s the bubbles volume continued to decrease, albeit more slowly, with a nearly linear dependence of their diameter on time. We estimated an average volume change rate during the time interval
 $t\geqslant 0.05$
s to be
 $0.06\pm 0.02~\text{mm}^{3}~\text{s}^{-1}$
per bubble.
The initial (
 $t\lesssim 0.05$
s and a vertical bubble location less than
 $z/L\simeq 0.05$
) and later (
 $t\gtrsim 0.05$
s and
 $0.05\lesssim z/L\lesssim 0.4$
) volume change rates differed from each other by nearly two orders of magnitude.
We believe that the initial volume change rate is largely due to the rapid vapour condensation, as the bubbles are subjected to a dramatic change of the thermal environment along their path. Initially, they reside in part in the thin thermal boundary layer where the temperature drops by about 70 % of
 ${\rm\Delta}T$
(Narezo Guzman et al.
Reference Narezo Guzman, Xie, Chen, Fernandez Rivas, Sun, Lohse and Ahlers2015). At later times the bubble experiences a nearly uniform thermal environment approximately at
 $T_{b}-0.7{\rm\Delta}T$
. We note that the locally defined Jakob number varies from
 $Ja\simeq 19$
at the bottom plate (
 $Ja\propto T_{b}-T_{on}$
) to about
 $-1$
(
 $Ja\propto (T_{b}-0.7{\rm\Delta}T)-T_{on}$
) in the bulk of the fluid above the thermal boundary layer. Theoretically (Okhotsimskii Reference Okhotsimskii1988) and experimentally (Chen & Mayinger Reference Chen and Mayinger1992)
 $Ja$
has been shown to be a relevant parameter in bubble condensation. A large decrease of the bubble diameter was also found in numerical simulations (Yang & Prosperetti Reference Yang and Prosperetti2008) of a bubble encountering a subcooled region of liquid, both of similar size. From their simulations Legendre, Borée & Magnaudet (Reference Legendre, Borée and Magnaudet1998) concluded that for a condensing bubble, the evolution of
 $d_{x}$
and the heat transfer rate crucially depend on the ratio between bubble surface radial velocity
 ${\dot{d}}_{x}=\text{d}(d_{x})/\text{d}t$
and the streamwise velocity
 $v$
(relative velocity between fluid and bubble). If
 $|{\dot{d}}_{x}/v|>1$
, then the bubble condenses at the same rate as if
 $v=0$
. However, when
 $|{\dot{d}}_{x}/v|<1$
, the thermal boundary layer around the bubble is controlled by the stream velocity and the bubble condenses faster than for a bubble at rest. Neither the thermal profile in our experiment nor the streamwise velocity are known and a more quantitative comparison with the simulations do not seem warranted.
Since some air will have diffused into the vapour bubble during its formation process, once the vapour closest to the bubble wall condenses right after departure, one may argue that any remaining vapour in the core of the bubble will be surrounded by an air layer or shell. However, the diffusion timescale
 ${\it\tau}_{g}$
in which air and vapour inside the bubble mix is
 $$\begin{eqnarray}{\it\tau}_{g}\sim (d_{x}/2)^{2}/D_{g},\end{eqnarray}$$
where
 $D_{g}$
is the binary diffusion coefficient of gases, which is typically of the order of
 $0.2\times 10^{-4}~\text{m}^{2}~\text{s}^{-1}$
. Comparing
 ${\it\tau}_{g}\sim 2\times 10^{-3}$
s with the time of the order of 0.05 s over which the volume changed at the largest rate, we conclude that vapour and air inside the bubble were well mixed.
Next to the condensation of the remaining vapour, we associate the later small volume change rate of the rising bubbles for
 $t\gtrsim 0.05$
s to the slow diffusion of air inside the bubble into the surrounding undersaturated liquid. The timescale for an air bubble to diffuse into an undersaturated still liquid around it is given by (see e.g. Lohse & Zhang Reference Lohse and Zhang2015)
 $$\begin{eqnarray}{\it\tau}_{l}\sim (d_{x}/2)^{2}{\it\rho}_{g}/((c_{s}-c_{\infty })D_{l}),\end{eqnarray}$$
where
 $D_{l}$
is the diffusion coefficient of air in the liquid (typical values are in the order of
 $D_{l}\sim 10^{-5}~\text{cm}^{2}~\text{s}^{-1}$
),
 ${\it\rho}_{g}$
is the density of the gaseous phase at the bubble boundary (with values around
 ${\it\rho}_{g}\sim 10^{-3}~\text{g cm}^{3}$
for nitrogen),
 $c_{s}$
is the air saturation concentration, and
 $c_{\infty }$
the air concentration far away from the bubble. If the bubble is moving with respect to the surrounding liquid, the concentration boundary layer around it is thinner than for the case of a bubble in a quiescent liquid, i.e. the diffusion rate is increased. Similarly as done by Zhang et al. (Reference Zhang, Lu, Tan, Bao, He, Sun and Lohse2015) for a drop, we assume that the concentration boundary layer around the bubble is of Prandtl–Blasius–Pohlhausen type (Grossmann & Lohse Reference Grossmann and Lohse2004). Then its thickness scales as
 ${\sim}d_{x}/\sqrt{Pe}$
, where the Péclet number of the moving bubble is given by
 $$\begin{eqnarray}Pe=\frac{U_{z}d_{x}}{D_{l}}.\end{eqnarray}$$
Here
 $U_{z}\simeq 10~\text{cm s}^{-1}$
is the vertical velocity component of the rising bubble (see § 4.1.3), resulting in a Péclet number in the order of
 $Pe\sim 4\times 10^{4}$
. For such a moving gas bubble the dissolution time scale is then given by
 $$\begin{eqnarray}{\it\tau}_{l}\sim (d_{x}/2)^{2}{\it\rho}_{g}/((c_{s}-c_{\infty })D_{l}\sqrt{Pe}).\end{eqnarray}$$
From (4.4) for our experimental data we find that the timescale for complete bubble dissolution should be of the order of 7 s, which is larger than the dissolution time of the order of about 1 s observed in figure 7(a), but it is of the same order of magnitude. In experiments with a larger air concentration in the liquid we found that the volume rate of change for
 $t\gtrsim 0.05$
s was smaller than that of figure 7(a) (see appendix B), which qualitatively is consistent with (4.4). For a more quantitative treatment of the role of dissolved air in bubble condensation we refer to the work of Shpak et al. (Reference Shpak, Stricker, Versluis and Lohse2013), who found a minimum amount of gas necessary in order to prevent the complete collapse of a bubble mostly filled with vapour when driven by ultrasound.
4.1.3 Velocity of bubbles after departure
In figure 7(b) the vertical velocity component
 $U_{z}$
(see (3.1)) of all 15 bubbles is plotted as function of time after departure. Figure 7(c) shows some of the same data, but on an expanded horizontal scale. All curves have a minimum in the range
 $0.01~\text{s}\lesssim t\lesssim 0.03$
s, which could be due to an interaction with the horizontal drag force exerted by the LSC (see the next paragraph) together with the fluid velocity gradient across the kinetic boundary layer adjacent to the bottom plate. At later times (
 $t\gtrsim 0.03$
s)
 $U_{z}$
increased again, reached a local maximum near
 $t\simeq 0.06$
s, and then decreased at a nearly constant (but perhaps very slowly decreasing) rate.
In figure 7(d) the corresponding horizontal velocity component
 $U_{x}$
is plotted. The horizontal motion implied by a non-zero
 $U_{x}$
is seen very well in the movies in the supplementary material of the paper by Narezo Guzman et al. (Reference Narezo Guzman, Xie, Chen, Fernandez Rivas, Sun, Lohse and Ahlers2015). In the range
 $0.01~\text{s}\lesssim t\lesssim 0.03$
s,
 $U_{x}$
reached a positive maximum. Given the angle of tilt (by less than
 $1^{\circ }$
) of the cell, a positive
 $U_{x}$
corresponded to bubble displacement in the same direction as that of the preferred LSC orientation right above the bottom plate. Thus, we associate the horizontal motion with the horizontal drag exerted on the bubbles by the LSC. This drag, and thus
 $U_{x}$
, are largest near the plate where the horizontal LSC velocity is largest (see, for instance, Qiu & Tong Reference Qiu and Tong2001). As the bubbles rose further, they encountered the bulk flow where the LSC was weaker (see § 4.1.1 and figure 6
a and the corresponding supplementary movie 3) and
 $U_{x}$
attained a nearly constant positive value near
 $7~\text{mm s}^{-1}$
. A small contribution to this value can be attributed to the small tilt of the cell relative to the horizontal camera alignment. With the tilt angle of
 $1^{\circ }$
and the typical vertical velocity of, say,
 $100~\text{mm s}^{-1}$
(see figure 7
b), a contribution to the measured
 $U_{x}$
of about 1 or 2
 $\text{mm s}^{-1}$
would be expected. This is smaller than the measured
 $U_{x}$
at large
 $t$
, indicating that a small lateral motion of the bubbles persists even well away from the bottom plate. This motion, we assume, is caused by the LSC which, although much weaker, does persist in the bulk with a velocity (in the time average) which vanishes only at one point on the vertical axis of the sample.
A detailed analysis of the forces acting on the rising bubbles with decreasing size, and in some cases with changing shape (mostly bubbles were spherical but some bubbles were ellipsoidal briefly after departure), would be desirable but, we believe, is too difficult to carry out reliably for our turbulent system. There is a very large body of work (Magnaudet & Eames Reference Magnaudet and Eames2000) on force-balance models which consider drag, added mass and buoyancy forces. They reproduce the experimentally observed dynamics of gas bubbles rising in quiescent liquids. Moore (Reference Moore1965) studied the drag of ellipsoidal bubbles, the work by de Vries, Luther & Lohse (Reference de Vries, Luther and Lohse2002) focused on the added-mass force of a rising bubble when it experiences shape oscillations and the study by Ohl, Tijink & Prosperetti (Reference Ohl, Tijink and Prosperetti2003) investigated the added mass of an expanding bubble. To carry out similar analyses for the present work, information about the turbulent fluid-velocity field around a bubble is necessary in order to quantify added-mass and drag forces. The contribution to the added-mass effect due to both the relative acceleration and the pressure gradient in the liquid, as well as the drag-force dependence on the relative velocity between liquid and bubble, would be needed. We lack most of this information for this complex turbulent system.
4.1.4 Velocity of bubbles across the whole cell
Similar to the results in § 4.1.2, we tracked 33 bubbles starting at a few frames after they detached from the surface and continuing until they condensed and dissolved, or reached the top plate (see figure 8
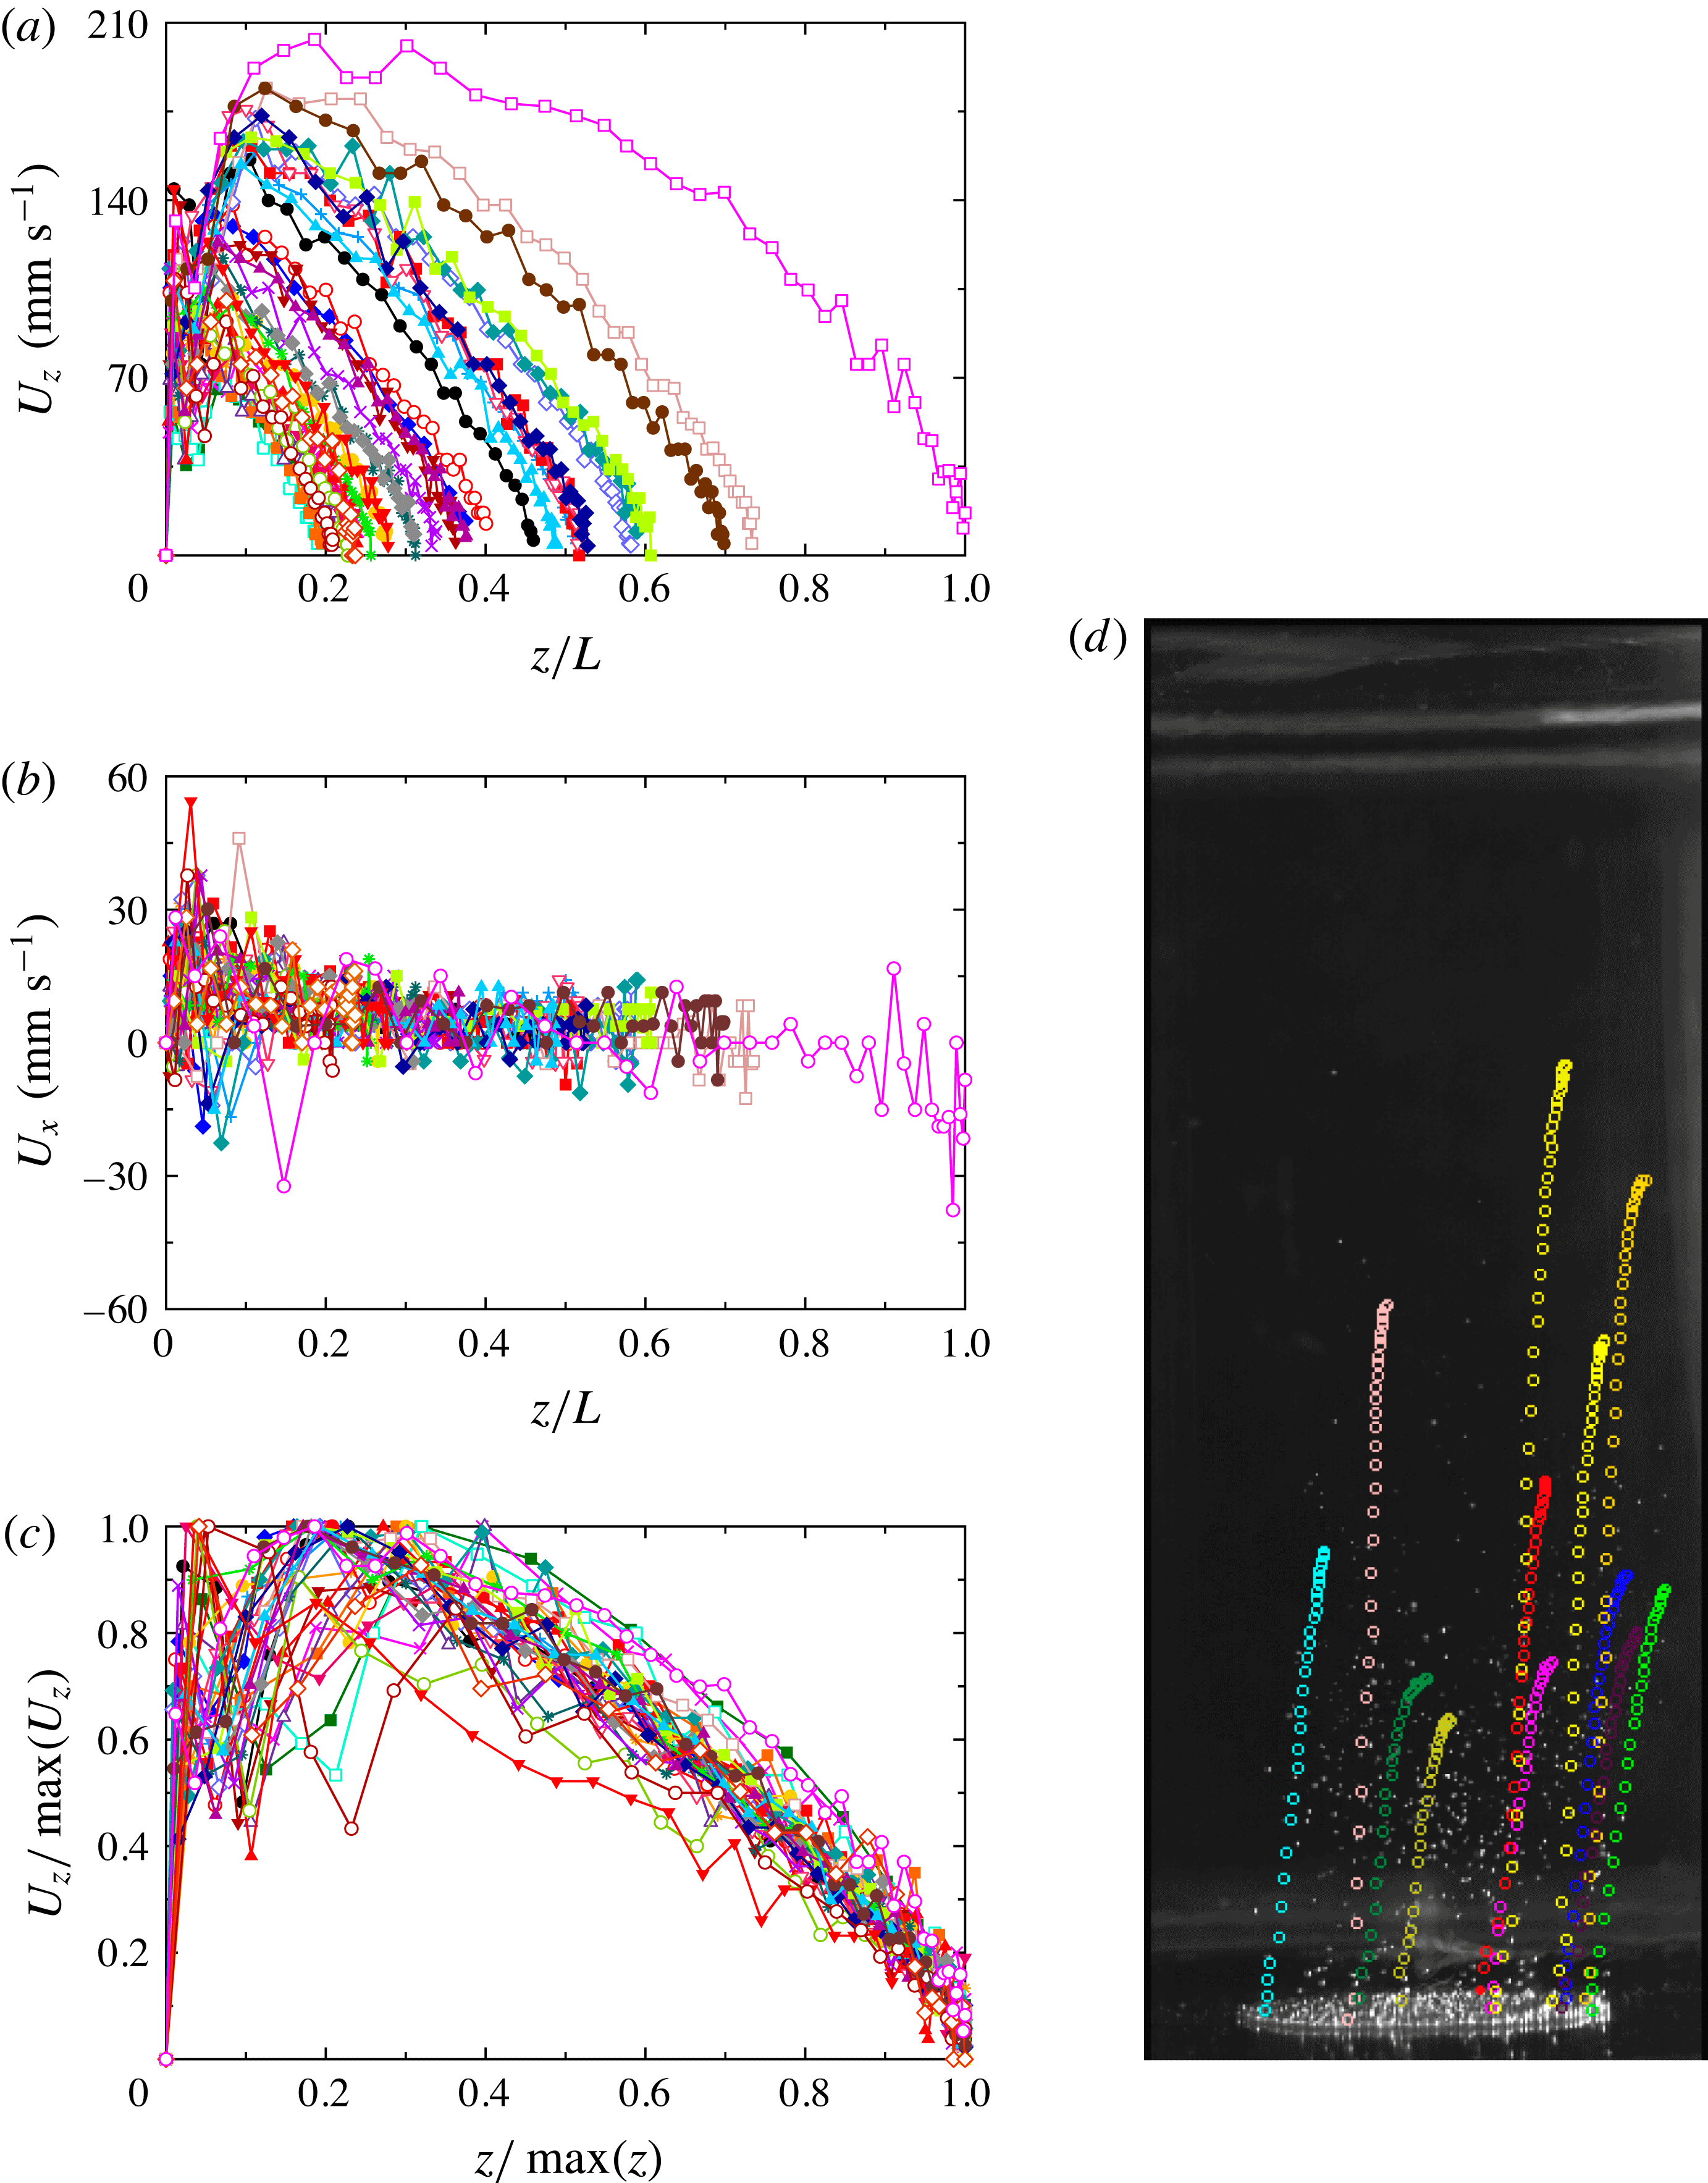
d). We tracked both bubbles which merged and others that did not. The vertical and horizontal velocity components are plotted as a function of the vertical coordinate
 $z/L$
in figures 8(a) and 8(b), respectively. The large majority of bubbles did not reach the top plate (
 $z/L=1$
). There was no common maximal value of
 $z/L$
where the bubbles vanished, and the value of
 $z/L$
where
 $U_{z}$
reached its largest value varied over a wide range. We believe that the large variation in the bubble paths is related to the occasional merging of bubbles, as well as to the random thermal and dynamical history along each path. Bubbles that merged did so right after departure most of the times, determining the bubble volume and thus its vertical speed from a very early stage on until they vanished.
(a) The vertical velocity component
 $U_{z}$
of the rising trajectories of 33 bubbles as a function of height
 $z/L$
. (b) The horizontal velocity component
 $U_{x}$
of the same bubbles as in (a) as a function of
 $z/L$
. (c) The vertical velocity component
 $U_{z}$
for all bubbles in (a) and (b), scaled by its maximal value
 $\max (U_{z})$
, as a function of
 $z$
scaled by the height
 $\max (z)$
at which the bubble condensed and dissolved completely. The data collapse fairly well onto a unique curve, especially for
 $z/\max (z)\gtrsim 0.3$
. (d) A snapshot of the two-phase flow with
 $l=0.60$
mm taken from the side. The etched area with nucleating cavities can be seen as the bright ellipse near the bottom of the image. Superimposed on the photograph are the trajectories (in the form of circles of different colour for different bubbles and of uniform size) of some of the tracked bubbles from the moment they detached until they vanished. See the corresponding supplementary movie 5.

It is interesting that figure 8(b) indicates a small positive value of
 $U_{x}$
for a large range of
 $z/L$
, but indicates for the one bubble that reached the top of the cell that
 $U_{x}$
became negative as it approached the top plate. This would be consistent with a lateral drag exerted by the LSC in our sample, which is toward positive
 $x$
in the bottom and toward negative
 $x$
in the top part of the cell (see supplementary movie 3).
The vertical trajectories of all bubbles had similar shapes. In figure 8(c) the
 $U_{z}$
values of a given bubble are scaled by their maximal value
 $\max (U_{z})$
and plotted as a function of height
 $z/\max (z)$
where
 $\max (z)$
is the vertical distance that each bubble travelled before it vanished or reached the top plate. The curves collapse onto a unique curve relatively well for
 $z/\max (z)>0.3$
, showing the correlation between the rising velocity and the lifetime of a bubble.
The characteristic speed of the bubbles at early times was much larger than that of any LSC or plume motion. For
 $t\simeq 0.07$
s for instance one sees in figure 7(c) that
 $U_{z}$
was near
 $120~\text{mm s}^{-1}$
. Inspection of the supplementary movies indicates that the LSC speed
 $U_{LSC}$
in the two-phase system was near
 $40~\text{mm s}^{-1}$
, about a factor of three smaller. The plume motion
 $U_{pl}$
in the one-phase system, where there was no LSC, was even slower, near
 $15~\text{mm s}^{-1}$
. The larger value of
 $U_{z}$
indicates that the bubbles significantly drive the fluid flow.
4.1.5 Bubble aspect-ratio before departure
The vertical (height) and horizontal (width) sizes of the bubbles
 $d_{z}$
and
 $d_{x}$
were measured for the
 $l=0.60$
mm wafer immediately before they departed from the plate. The results had no significant superheat dependence in the range from 7.8 to 9.8 K. This is consistent with the measurements of
 $d_{x}$
at departure obtained from top visualization over a wider superheat range from
 ${\sim}3$
to 10 K for the same cavity separation (see § 4.2.1). From the 70 departing bubbles selected for
 $T_{b}-T_{on}=9.8$
, 8.8 and 7.8 K we estimated the mean and standard deviation of the bubble sizes to be
 $d_{x}=45.0\pm 2.0$
pixels and
 $d_{z}=57.1\pm 3.5$
pixels, giving an aspect ratio
 ${\it\Gamma}_{b}\equiv d_{x}/d_{z}=0.79\pm 0.03$
. For the case with
 $l=1.0$
mm and
 $T_{b}-T_{on}=10.6$
K, based on 33 bubbles at departure, we similarly found
 ${\it\Gamma}_{b}=d_{x}/d_{z}=0.72\pm 0.03$
.
For a spherical bubble
 ${\it\Gamma}_{b}=1$
. We note that the departure of
 ${\it\Gamma}_{b}$
from unity is due to the extension, in the shape of a down-pointing triangle, of the bubbles toward their attachment point which can be seen in figure 5(a). Almost immediately after detachment the bubbles became essentially spherical, except for a few cases where the shape of the free bubbles was elliptical with a horizontal major axis and
 ${\it\Gamma}_{b}\simeq 1.2$
for a brief time after departure.
4.1.6 Bubble volume before departure
Bubble volumes right before departure were computed from their contours as described in § 3.6.3. Mean values
 $V$
of all selected bubbles with a clear contour were obtained for
 $l=0.60$
and
 $l=1.0$
mm (see § 3.6.3). They were compared with the theoretical maximal volume of a bubble growing at a wall under equilibrium conditions (slow growth)
 $V_{max}$
when only surface tension and buoyancy forces are considered (Fritz Reference Fritz1935). For a spherical bubble
 $V_{max}$
is given by
 $$\begin{eqnarray}\frac{V_{max}}{l_{c}^{3}}={\it\varphi}({\it\beta}),\end{eqnarray}$$
where
 ${\it\beta}$
is the contact angle between the surface and the bubble, and
 $l_{c}$
is the capillary length
 $$\begin{eqnarray}l_{c}=\sqrt{\frac{{\it\gamma}}{g({\it\rho}-{\it\rho}_{v})}}.\end{eqnarray}$$
Here
 ${\it\gamma}$
is the surface tension,
 ${\it\rho}$
was evaluated at
 $T_{b}$
and
 ${\it\rho}_{v}$
at the vapour partial pressure. Fritz (Reference Fritz1935) gave
 ${\it\varphi}({\it\beta})$
for nine
 ${\it\beta}$
values. For the working liquid in our experiments
 $l_{c}$
ranged from 0.97 to 0.95 mm because the surface tension decreased with increasing bottom-plate temperature. From side visualization we found
 ${\it\beta}=40^{\circ }\pm 5^{\circ }$
for
 $l=0.60$
mm and
 ${\it\beta}=45^{\circ }\pm 5^{\circ }$
for
 $l=1.0$
mm (see § 4.1.5), with corresponding values
 ${\it\varphi}(40^{\circ })=0.105$
and
 ${\it\varphi}(45^{\circ })=0.150$
, resulting in
 $V_{max}=0.26~\text{mm}^{3}$
and
 $V_{max}=0.36~\text{mm}^{3}$
, respectively, for
 $T_{b}=38.5\,^{\circ }\text{C}$
.
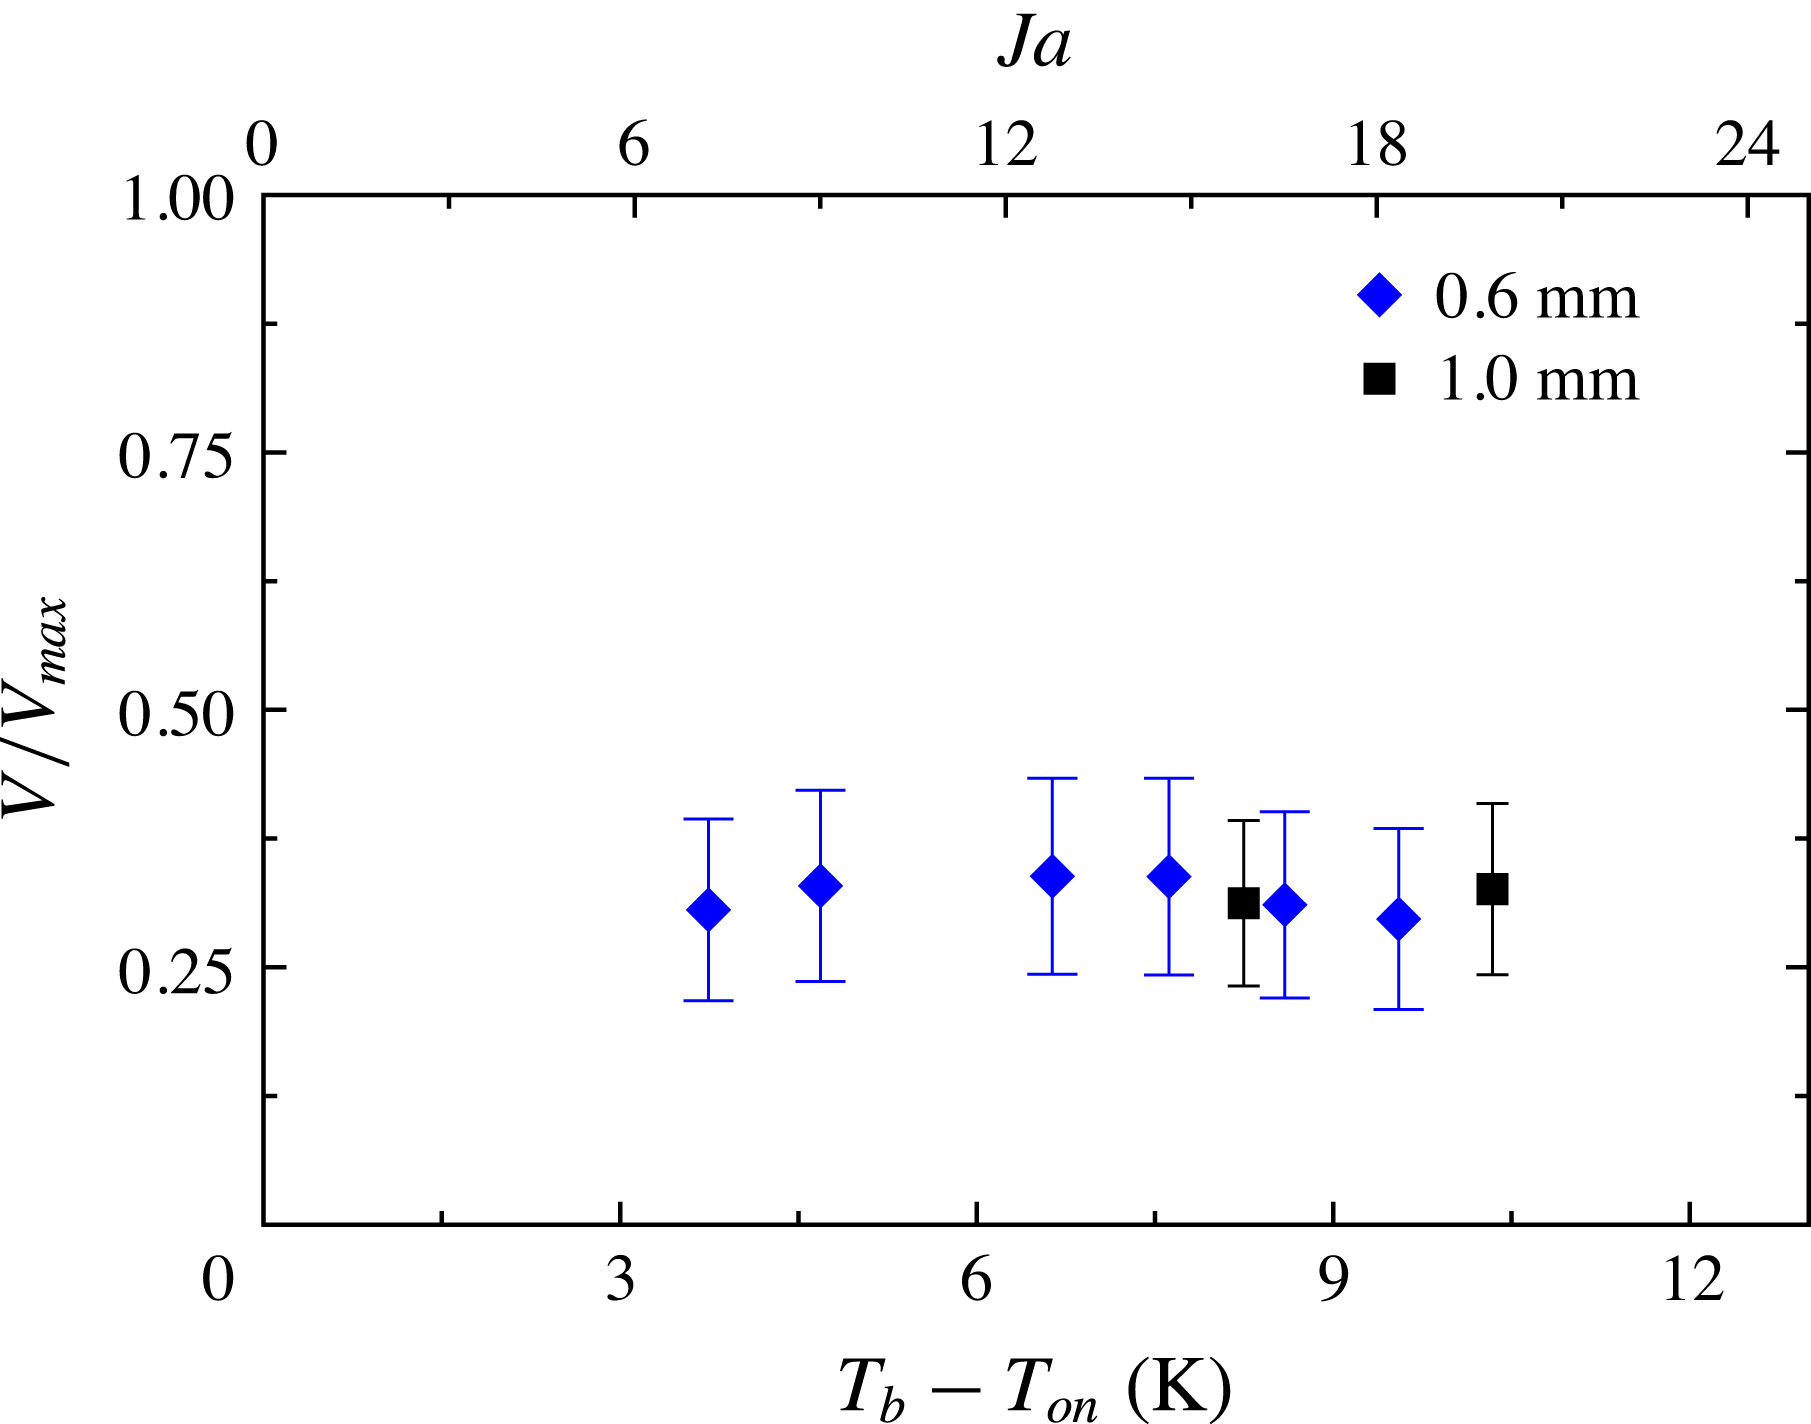
In figure 9 the ratio between
 $V$
and
 $V_{max}$
is presented as a function of both superheat and
 $Ja$
for the data obtained for the wafers with
 $l=0.60$
mm and
 $l=1.0$
mm. The vertical bars indicate the uncertainty of
 $V$
. One sees that there is only little variation with
 $T_{b}-T_{on}$
.
The ratio between estimated bubble volume
 $V$
and the maximal bubble volume
 $V_{max}$
of spherical bubbles in an equilibrium state balancing surface tension and buoyancy forces only, plotted as a function of superheat and
 $Ja$
. The vertical bars indicate the uncertainty of
 $V$
. Cavity separation shown in label.

Og̃uz & Prosperetti (Reference Og̃uz and Prosperetti1993) developed a model that predicted
 $V/V_{max}$
of detaching gas bubbles from a needle, expressed in terms of the gas flow rate through the needle and into the bubble. This process has some similarity to bubble departure in boiling, but also differs in many ways from our case. When the growth was dominated by the flow rate rather than by inertia, and for flow rates below a certain critical value, they found that the bubbles detached from the needle with a volume
 $V$
smaller than
 $V_{max}$
given by (4.5), with
 $V/V_{max}$
varying from 0.8, when the flux was two orders of magnitude smaller than the critical value, to
 $V/V_{max}\simeq 1$
at the flux critical value. They reported that the criterion for departure for flow rates below the critical value is met before
 $V_{max}$
is achieved and the bubble departure is limited by surface tension, which is overcome when
 $V\approx V_{max}$
in the case of a spherical bubble. However for small flow rates and slow bubble growth, sphericity is hardly met since the bubble surface is subjected to the effects of gravity and surface tension, thus deviations from this criterion (
 $V\approx V_{max}$
) need to be considered. The much smaller value
 $V/V_{max}\simeq 0.3$
displayed in figure 9 indicates that there are additional mechanisms at play in our system. Presumably the LSC exerts a drag on the attached bubbles, promoting an early detachment.
4.2 Flow visualization from the top
4.2.1 Bubble growth and detachment
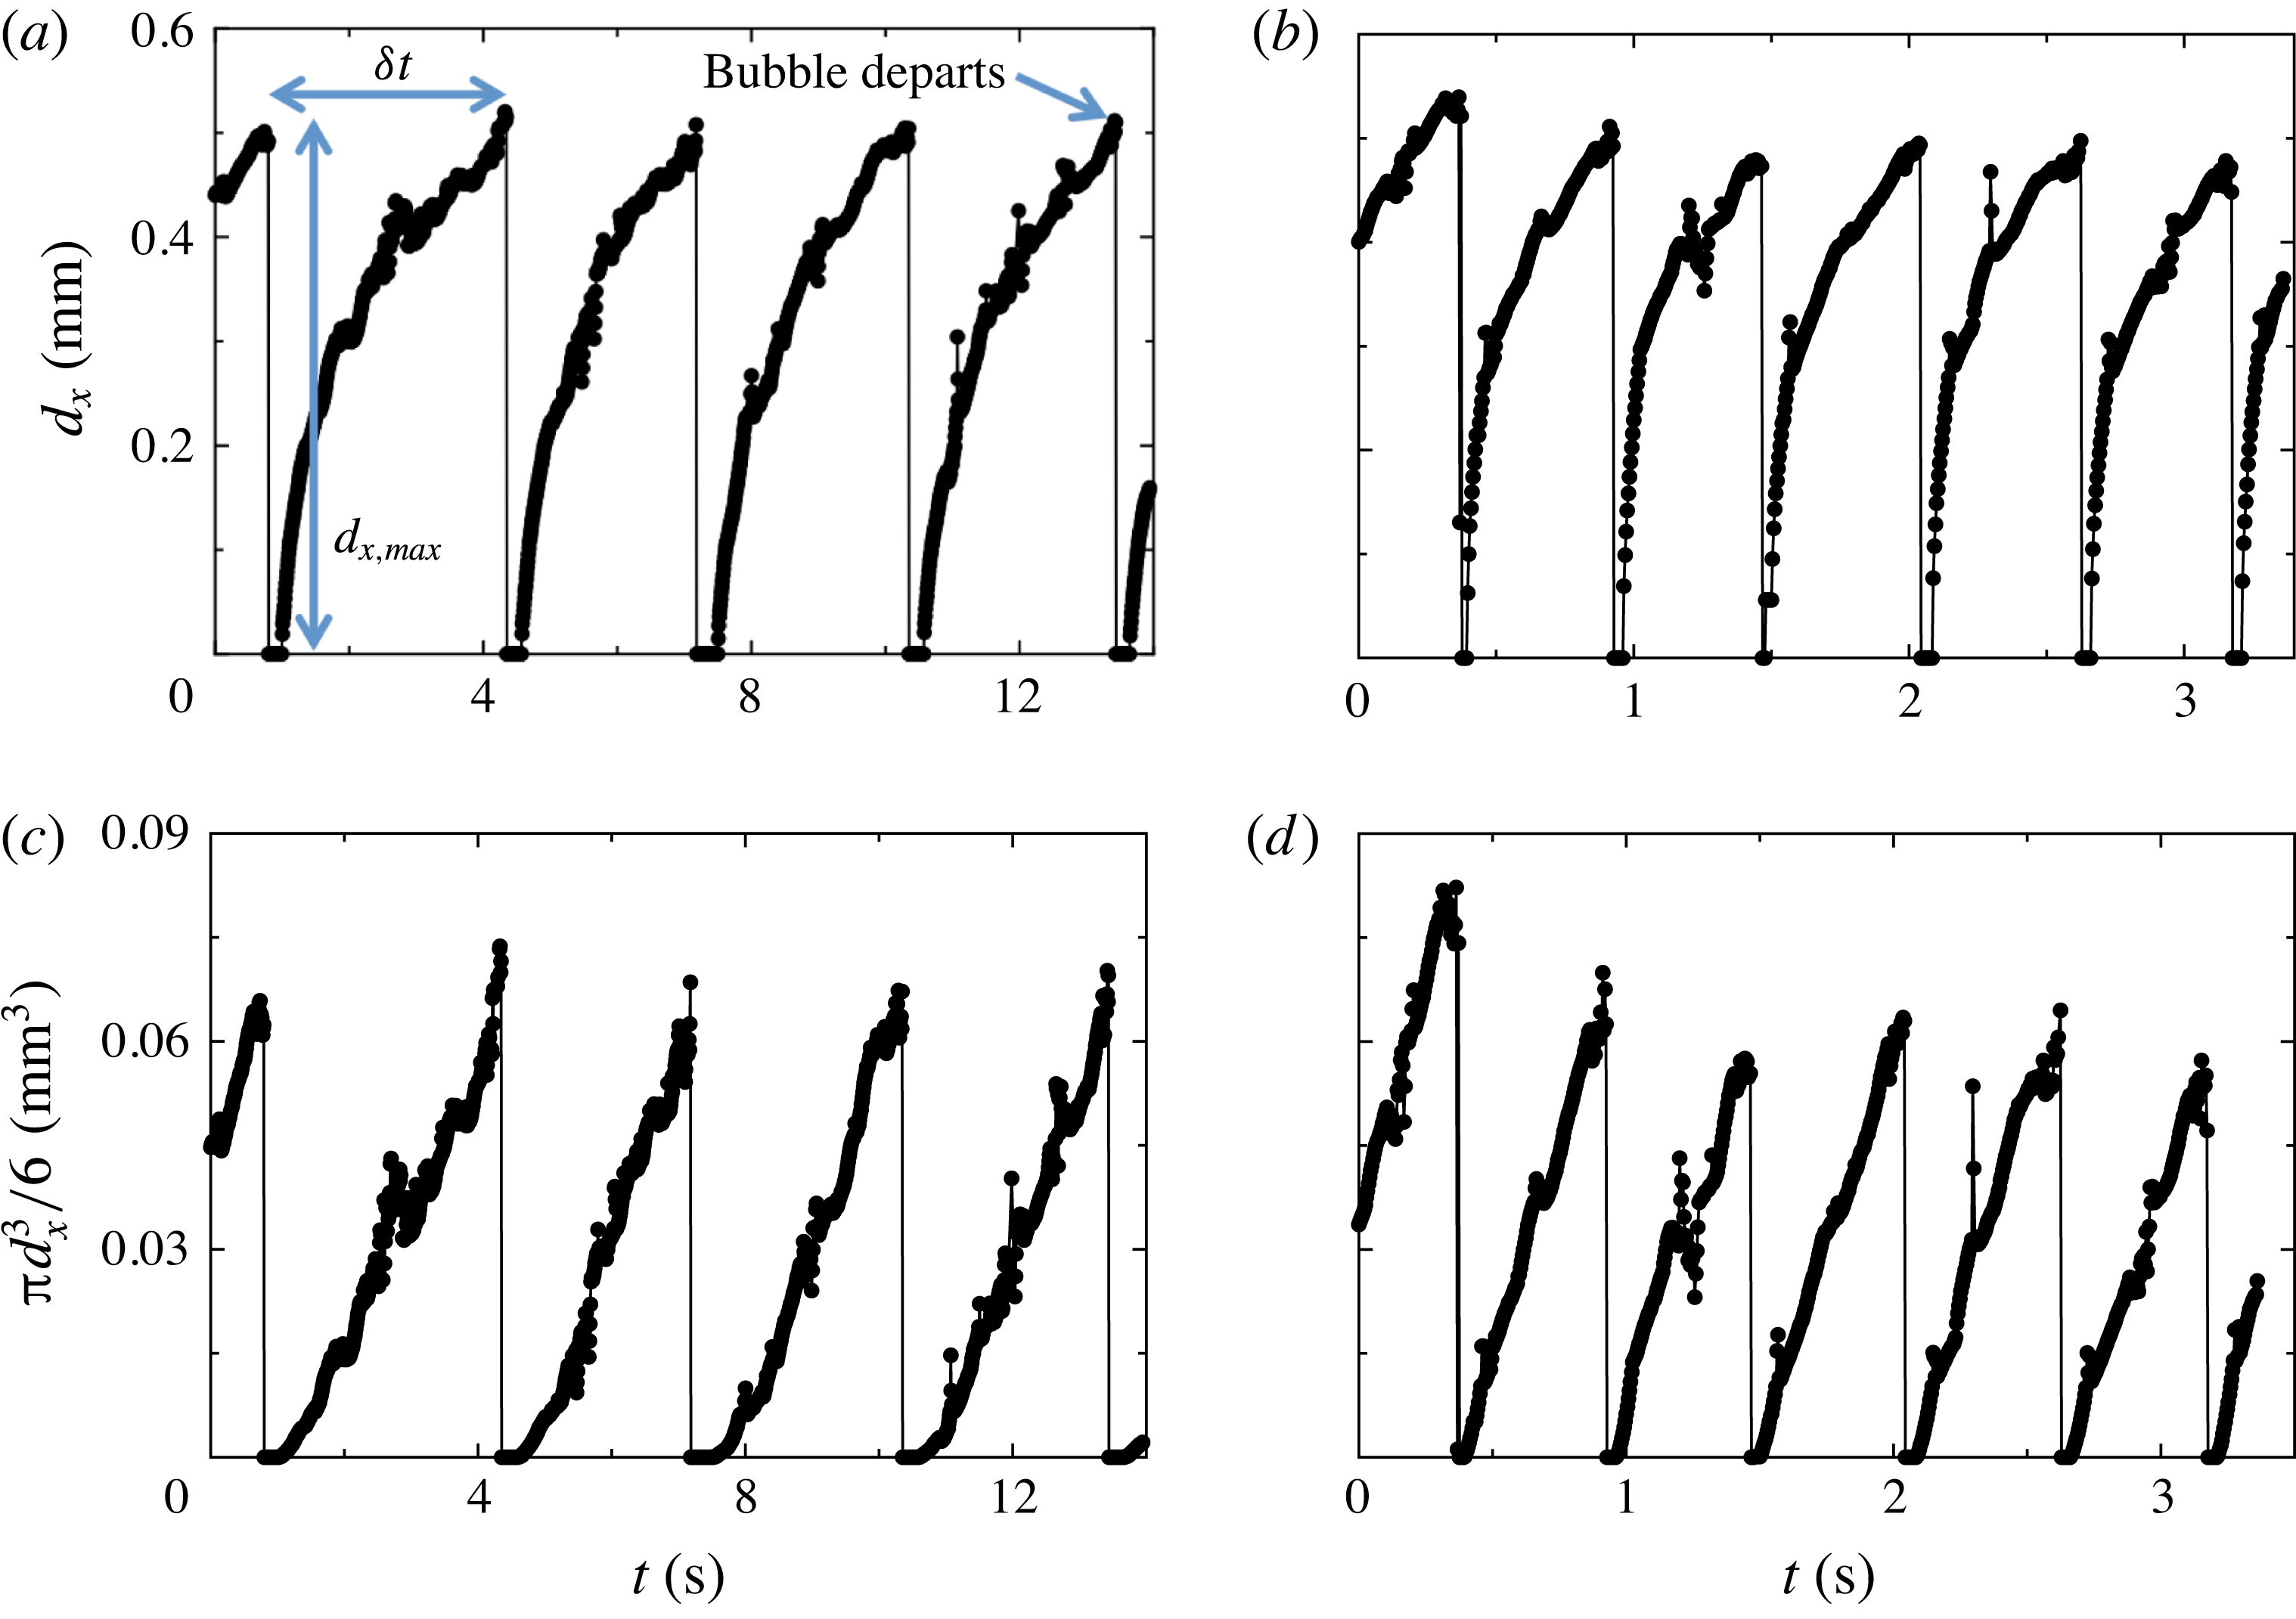
Time series of bubble widths
 $d_{x}$
for growing bubbles on single nucleation sites of the
 $l=0.60$
mm wafer (see § 3.6.2) at two different superheat values are shown in figure 10(a,b). They were obtained in apparatus 1 by viewing from above (see § 3.2). In figure 10(a), with
 $T_{b}-T_{on}=4.69$
K, five departure events, each followed by a short delay between departure and the beginning of the next bubble growth, and four full cycles (growth from
 $d_{x}=0$
to
 $d_{x,max}$
) are shown. Based on the imaging results (as in figure 10) we estimate the delay between departure and the onset of new growth to be about 0.5 s for
 $T_{b}-T_{on}=4.69$
K and about 0.05 s for
 $T_{b}-T_{on}=8.59$
K. All bubbles which grew and departed within the 14 s of the figure showed similar behaviour, reaching about the same
 $d_{x,max}$
right before departing from the surface. The vapour-bubble growth rate shown in figure 10(b) for the larger superheat
 $T_{b}-T_{on}=8.59$
K is much larger than that for figure 10(a) with
 $T_{b}-T_{on}=4.69$
K. Within the 3.5 s covered by the figure, six bubbles departed.
Time series of the width
 $d_{x}$
and approximate volume
 ${\rm\pi}d_{x}^{3}/6$
of growing bubbles obtained from high-speed movies of a single nucleating site (
 $l=0.60$
mm) viewed from the top using apparatus 1: (a,c)
 $T_{b}-T_{on}=4.69$
K; (b,d)
 $T_{b}-T_{on}=8.59$
K. (a,b) The width
 $d_{x}$
. (c,d) The approximation
 ${\rm\pi}d_{x}^{3}/6$
to the bubble volume. The maximal (departure) width
 $d_{x,max}$
and the time difference between consecutive bubble departures
 ${\it\delta}t$
are indicated in (a).

Visualization from the top cannot yield the precise bubble volume since the main deviation from a spherical shape occurs underneath the bubble (see § 4.1.5). Thus, in figures 10(c) and 10(d), we display the approximation
 ${\rm\pi}d_{x}^{3}/6$
to the bubble volume based on the assumption of a spherical shape that corresponds to the time series of
 $d_{x}$
shown in figures 10(a) and 10(b), respectively. This approximation serves well to illustrate the time evolution of the bubble volume. For both superheat values
 ${\rm\pi}d_{x}^{3}/6$
increased about linearly with time.
The linear growth of
 ${\rm\pi}d_{x}^{3}/6$
contrasted with existing models for the growth of vapour bubbles in a quiescent fluid (Forster & Zuber Reference Forster and Zuber1954; Plesset & Zwick Reference Plesset and Zwick1954), which predict that, for a spherical bubble, the volume should grow
 $\propto t^{3/2}$
. The models are valid in the asymptotic stage of large radius, when growth is controlled by thermal energy inflow and liquid inertia is not a limiting factor. The model assumes growth occurs in stagnant and uniformly superheated liquid, and is only valid for sufficiently large liquid superheats (Prosperetti & Plesset Reference Prosperetti and Plesset1978). It has successfully reproduced bubble growth in water and
 $\text{CCl}_{4}$
and at moderate and high pressures in ethanol and water (Sluyter et al.
Reference Sluyter, Slooten, Copraji and Chesters1991). In our experiments the growth conditions differ from those assumed in the models; here the temperature field around a growing bubble had a steep gradient across the thermal boundary layer at the bottom plate. An estimate of the boundary layer thickness in one-phase flow is
 ${\it\lambda}_{t}\simeq 90~{\rm\mu}\text{m}$
for
 $Ra=2\times 10^{10}$
and
 $L$
the same as here (Narezo Guzman et al.
Reference Narezo Guzman, Xie, Chen, Fernandez Rivas, Sun, Lohse and Ahlers2015). Thus, during the very early stage of the bubble growth
 $d_{x}<{\it\lambda}_{t}$
and the bubble is growing entirely within this steep temperature gradient, while at later times the bubble presumably becomes much larger than
 ${\it\lambda}_{t}$
and is exposed primarily to the turbulent fluid at the bulk temperature which is approximately
 $T_{b}-0.7{\rm\Delta}T$
and less that
 $T_{on}$
. To summarize, major differences between the models and our experiment included non-spherical bubbles (see § 4.1.5), bubble interactions with neighbours, growth in a varying temperature field and turbulent rather than quiescent flow. Thus, it is no surprise that the bubble growth rate is very different from that expected under the uniformly superheated conditions in a quiescent flow assumed in the models.
We calculated the probability density function (PDF) of the bubble widths
 $d_{x,max}$
at departure, as well as the PDF of
 ${\it\delta}t$
, for the departure events obtained for all active sites at a given
 $T_{b}-T_{on}$
and cavity separation
 $l$
. Since
 $d_{x,max}$
was smaller than the cavity separation
 $l$
for all cases, its PDF was calculated over the range 0 to
 $l$
. The bin size for the
 $d_{x,max}$
PDF equalled the pixel size of the images (0.016 mm). The bin size for the PDF of
 ${\it\delta}t$
was different for each PDF since the range between maximal and minimal values of
 ${\it\delta}t$
varied for each
 $l$
and superheat value.
In figure 11(a) the PDFs of
 $d_{x,max}$
for
 $l=0.60$
mm at different superheat values are shown. Each of them could be fitted well by a Gaussian function. In figure 11(b) the PDFs of
 ${\it\delta}t$
at different superheat values, also fitted by Gaussian functions, are shown. At small
 ${\it\delta}t$
there are significant deviations from these fits. Similarly, Gaussian distributions were fitted to the PDFs of both
 $d_{x,max}$
and
 ${\it\delta}t$
obtained for wafers with
 $l=1.0$
and 2.0 mm.
(a) PDF of bubble widths at departure
 $d_{x,max}$
. (b) PDF of the time difference between consecutive bubble departures
 ${\it\delta}t$
for various bottom-plate superheat values
 $T_{b}-T_{on}$
(see labels) and
 $l=0.60$
mm. Each PDF was fitted by a Gaussian distribution.

At the lowest superheat value
 $T_{b}-T_{on}=3.74$
K, the PDFs of
 $d_{x,max}$
and
 ${\it\delta}t$
for the
 $l=0.60$
mm wafer showed two peaks, indicating that some active nucleation sites behaved differently from others: some sites nucleated smaller bubbles at a higher rate, while others nucleated bubbles that reached approximately the same
 $d_{x,max}\simeq 0.51$
mm observed for larger superheat values. The widths of the small departing bubbles and the uncertainty associated with them were of the same order. For such small bubbles the departure frequency
 $f$
was so large that the corresponding peak in the PDF of
 ${\it\delta}t$
was an order of magnitude larger than the peak located at
 ${\it\delta}t\simeq 6$
s (see figure 13
a below) associated with the larger bubbles. In order to include the results from cavities nucleating larger bubbles at
 $T_{b}-T_{on}=3.74$
K, only departure diameters larger than 0.1 mm were considered for figure 11(a) and values for
 ${\it\delta}t>3$
s were used for figure 11(b). A similar behaviour was found in the measurements for the
 $l=1.0$
mm wafer at
 $T_{b}-T_{on}=4.28$
K; in this case we neglected
 $d_{x,max}$
values smaller than 0.25 mm (which represented less than 15 % of the 3408 departure events considered) and fitted a Gaussian distribution to the PDF of
 $d_{x,max}>0.25$
mm.
Means and standard deviations were computed from the Gaussian distributions such as those in figure 11. In figure 12 the mean departure diameter found for all cavity separations is plotted as a function of both superheat and
 $Ja$
. The vertical bars indicate the corresponding standard deviation of the distributions. One can see that for
 $l=0.60$
mm the bubble departure diameter remained nearly constant at
 $d_{x,max}\simeq 0.5$
mm in the entire superheat range. The results for
 $l=1.0$
mm show a weak dependance of
 $d_{x,max}$
on superheat;
 $d_{x,max}$
decreased with decreasing superheat for
 $T_{b}-T_{on}<8$
K. The results for
 $l=2.0$
mm are comparable with those obtained for
 $l=1.0$
mm at
 $T_{b}-T_{on}\simeq 10$
and 8 K; but at the largest superheat the bubbles detached from the surface with the largest
 $d_{x,max}$
.
The mean values of the Gaussian fits to the maximal bubble width at departure
 $d_{x,max}$
as a function of the bottom plate superheat
 $T_{b}-T_{on}$
and the Jakob number
 $Ja$
. The vertical bars indicate the standard deviations of the distributions. Cavity separation indicated in the label.

The time-averaged values
 $\langle {\it\delta}t\rangle$
of
 ${\it\delta}t$
are plotted on a double logarithmic scale as a function of the bottom-plate superheat and
 $Ja$
in figure 13(a) for all cavity separations
 $l$
. Within our resolution they were independent of
 $l$
. All data points shown (except that for
 $l=1.0$
mm at lowest superheat) were fitted by the exponential function
 $\langle {\it\delta}t\rangle ={\it\tau}_{0}\exp (-(T_{b}-T_{on})/C)$
. The fit gave
 ${\it\tau}_{0}=31.0$
s and
 $C=2.12$
K (dashed line in the figure).
(a) The mean values of the Gaussian fits to the time difference between consecutive bubble departures
 ${\it\delta}t$
as a function of the bottom-plate superheat
 $T_{b}-T_{on}$
and the Jakob number
 $Ja$
for different cavity separations
 $l$
. A fit of the exponential function
 $\langle {\it\delta}t\rangle ={\it\tau}_{0}\exp (-(T_{b}-T_{on})/C)$
to the data gave
 ${\it\tau}_{0}=31.0$
and
 $C=2.12$
K (dashed line). (b) The standard deviations divided by the corresponding mean value
 ${\it\sigma}_{{\it\delta}t}/\langle {\it\delta}t\rangle$
as a function of
 $T_{b}-T_{on}$
and
 $Ja$
. Cavity separation specified in label.

The bubble growth rate and departure frequency greatly increased with increasing superheat and
 $Ja$
, reflecting the larger rate at which heat was supplied to an active nucleation site and to the surrounding superheated liquid. A higher heat flux at the bottom plate did not strongly affect the volume at departure, suggesting that the heat flux into the bubbles remained below a certain critical value (Og̃uz & Prosperetti Reference Og̃uz and Prosperetti1993) in the studied superheat range.
The ratio of the standard deviation
 ${\it\sigma}_{{\it\delta}t}$
to the corresponding
 $\langle {\it\delta}t\rangle$
is plotted in figure 13(b) as a function of both superheat and
 $Ja$
. As
 $\langle {\it\delta}t\rangle$
increased for decreasing superheat values, it was also subjected to increasingly larger fluctuations around the mean. The result was that
 ${\it\sigma}_{{\it\delta}t}/\langle {\it\delta}t\rangle$
reached values up to 60 % at the lowest superheats. The fluctuations around the mean were stronger at the larger separations between active sites; that is, nucleating bubbles with closer neighbouring active sites departed the surface in a more regular manner in time than bubbles departing from wafers with larger cavity separation.
4.2.2 Bubble latent heat content
The heat per unit time
 $Q_{2ph}$
for two-phase flow was enhanced with respect to that for one-phase flow
 $Q_{1ph}$
in the entire superheat (and thus
 $Ja$
) range. The enhancement
 $Q_{2ph}-Q_{1ph}$
had three main contributions due to different mechanisms; here we quantify the contribution of the latent heat content of bubbles growing on the heated surface. Figure 14 shows, on a log-linear scale,
 $Q_{2ph}-Q_{1ph}$
divided by the corresponding number of active sites
 $N_{a}$
, i.e. the heat per unit time enhancement due to a single active site, as a function of superheat and
 $Ja$
(solid symbols) measured for both
 $l=0.60$
and
 $1.0$
mm wafers. Over the entire superheat range depicted,
 $(Q_{2ph}-Q_{1ph})/N_{a}$
was larger for the wafer with a larger cavity separation, and for a given cavity spacing
 $l$
it remained approximately constant for
 $T_{b}-T_{on}\gtrsim 5$
K and then declined slightly for decreasing superheat values smaller than about 5 K.
Left vertical axis: the enhancement
 $Q_{2ph}-Q_{1ph}$
of the heat per unit time due to the bubbles, divided by the number of active sites
 $N_{a}$
(solid symbols) on a logarithmic scale as a function of the bottom-plate superheat
 $T_{b}-T_{on}$
and the Jakob number
 $Ja$
. Right vertical axis: the ratio of the latent heat per unit time
 $Q_{bub}N_{a}$
to the enhancement
 $Q_{2ph}-Q_{1ph}$
(open symbols) as a function of
 $T_{b}-T_{on}$
and
 $Ja$
. The vertical error bars represent the uncertainty range. Labels indicate the cavity separation for each vertical axis.

Assuming that the entire heat absorbed by a bubble with volume
 $V$
was used to generate vapour at the saturation density and pressure (partial pressure of the vapour was 86 kPa), we estimated the latent heat content
 $H$
of a single bubble. Knowing the superheat dependence of the mean bubble departure frequency
 $1/\langle {\it\delta}t\rangle$
allowed us to compute the heat per unit time associated to the departing vapour bubbles of a single nucleation site:
 $$\begin{eqnarray}Q_{bub}=\frac{HV{\it\rho}_{v}}{\langle {\it\delta}t\rangle }.\end{eqnarray}$$
We note that there was a considerable amount of dissolved air in the liquid (see § 3.4) and that the bubble volume at departure was probably a mixture of vapour and air; however, the concentration of each inside the bubble is unknown. Therefore,
 $Q_{bub}$
was an upper bound to the actual latent heat absorbed by the growing bubbles from a single site. The contribution of bubble latent heat to the enhancement
 $Q_{bub}N_{a}/(Q_{2ph}-Q_{1ph})$
is plotted as a function of superheat and
 $Ja$
(open symbols) in figure 14 (right vertical axis) for both
 $l=0.60$
and
 $1.0$
mm. The vertical bars show the uncertainty range by taking into account the uncertainty of
 $V$
and
 ${\it\sigma}_{{\it\delta}t}$
. For both
 $l$
values, the ratio
 $Q_{bub}N_{a}/(Q_{2ph}-Q_{1ph})$
increased with superheat, mostly due to the exponential decrease of
 $\langle {\it\delta}t\rangle$
. For
 $l=0.60$
mm, at
 $T_{b}-T_{on}\simeq 4$
K the contribution
 $Q_{bub}N_{a}/(Q_{2ph}-Q_{1ph})\simeq 0$
and it reached a maximum value of 25 % at the largest superheat. The two points obtained for
 $l=1.0$
mm were smaller than
 $Q_{bub}N_{a}/(Q_{2ph}-Q_{1ph})$
obtained for
 $l=0.60$
mm. Considering that
 $Q_{2ph}-Q_{1ph}$
showed little dependence on
 $l$
(Narezo Guzman et al.
Reference Narezo Guzman, Xie, Chen, Fernandez Rivas, Sun, Lohse and Ahlers2015), that
 $d_{x,max}$
and
 $V$
were slightly larger for the
 $l=1.0$
mm case (for
 $T_{b}-T_{on}\gtrsim 8$
K) and that
 $\langle {\it\delta}t\rangle$
did not vary from one cavity separation to another, the smaller
 $Q_{bub}N_{a}/(Q_{2ph}-Q_{1ph})$
calculated for
 $l=1.0$
mm was a consequence of the smaller number of active sites
 $N_{a}$
.
The increasing relative contribution of bubble latent heat implied a smaller relative contribution from other mechanisms such as micro-convection, transient conduction, enhanced buoyancy and the advection of heat by the bubbles. However, the absolute contribution of the effective buoyancy to the total heat flux enhancement increased with superheat, similar as reported by Lakkaraju et al. (Reference Lakkaraju, Stevens, Oresta, Verzicco, Lohse and Prosperetti2013), as the number of bubbles per unit time rising across the flow increased and their volume either remained constant or increased with superheat.
5 Conclusions
We studied the nucleation and growth of vapour bubbles, as well as their detachment from the bottom plate and their rise dynamics through a cylindrical RBC sample with aspect ratio
 ${\it\Gamma}\simeq 1$
. While in the usual RBC studies the bottom plate is heated uniformly over its entire surface (which in our case has a diameter of 8.8 cm), we introduced a heat current only over a central circular area of 2.54 cm diameter. This same central area contained a triangular lattice of cavities in a silicon substrate, with each cavity
 $30~{\rm\mu}\text{m}$
in diameter and
 $100~{\rm\mu}\text{m}$
in depth. The work covered a range of lattice spacings
 $l$
, ranging from 0.60 to 2.00 mm. The cavities, when vapour was trapped in them, served as bubble-nucleation centres; when they were filled with liquid they did not nucleate bubbles. Thus, we could compare the properties of the one-phase bubble-free system with the two-phase case with bubbles.
We used two different experimental set-ups. One enabled flow visualization from the top and the other from the side. The bubble shapes and flow dynamics were studied using high-speed movies. The movies recorded either the light scattered directly from the bubbles or the images obtained by a shadowgraph technique. Measurements for one- and two-phase flow were compared.
In the usual RBC system with aspect ratio near one the sample contains a well-defined LSC, with up-flow near the wall at some azimuthal location and down-flow near the wall at a location which differs by
 ${\rm\pi}$
. Boundary layers adjacent to the top and bottom plate emit thermal plumes over their entire area which are carried by, and by virtue of their buoyancy drive the LSC. In our geometry with only the central area of the bottom plate heated, we found no evidence of a LSC for
 $Ra\simeq 1.9\times 10^{10}$
, and hot plumes rose primarily from the heated area and more or less randomly ascended through the sample to the top plate. Cold plumes emanated from the entire surface of the top plate and moved downward through the sample following an irregular course.
In the presence of rising vapour bubbles a circulatory motion of the LSC, similar to that of the usual RBC case, was re-established. The thermal plumes mostly rose and descended near the sidewalls, and together with the heat carried by the bubbles (which homogenized the thermal field in the bulk flow) reduced the skewness of the locally measured temperature in the bulk (Narezo Guzman et al.
Reference Narezo Guzman, Xie, Chen, Fernandez Rivas, Sun, Lohse and Ahlers2015). The detached bubbles moved more nearly vertically across the bulk flow with a speed that could reach values near
 $200~\text{mm s}^{-1}$
. This is much larger than the speed of rising or falling plumes (which is about the same as that of the LSC when it exists), which in the one-phase system was near
 $15~\text{mm s}^{-1}$
but in the two-phase case was enhanced by the rising bubbles and close to
 $40~\text{mm s}^{-1}$
. Although qualitative, this result suggests that vapour bubbles are very efficient heat carriers not only because of the latent heat carried by them, but even more so by virtue of the enhanced buoyancy that they induce.
The volume growth of a bubble depended closely to linearly on time. Right before departure from the surface, bubbles were not spherical; they had a conical extension pointing downward toward their point of attachment. For
 $l=0.60$
mm their maximal width (of about
 $0.5$
mm) just before departure was not significantly dependent on the bottom-plate superheat (between 3 and 12 K), while for
 $l=1.0$
and 2.0 mm there was a weak dependence. As the bubbles detached, almost all of them immediately assumed a spherical shape (a few were elliptical with a horizontal major axis). Their volume was only about one third of that predicted by assuming that buoyancy and surface tension are in equilibrium and the only relevant factors as a spherical bubble grows at and then departs from its attachment point (Fritz Reference Fritz1935). The time-averaged difference between consecutive departure times
 $\langle {\it\delta}t\rangle$
decreased exponentially with increasing superheat and was independent of
 $l$
. The departure frequencies
 $1/\langle {\it\delta}t\rangle$
had a wider statistical distribution at larger
 $l$
than they did at smaller
 $l$
. We expect that the reason for this is that, at the larger distances between cavities, bubbles were more exposed to the turbulent velocity and temperature field and less protected by their neighbours.
Bubbles experienced a large volume decrease during roughly the first
 $0.03$
s after departure as they moved across the region closest to the bottom plate. During this time they escaped from the influence of the strong thermal gradient near the plate associated with the boundary layer, and entered the bulk of the sample which has a lower and near-uniform temperature. The bubbles continued condensing and/or dissolving in the bulk at a rate that was about two orders of magnitude smaller than the initial condensation and/or dissolution rate. The rising bubbles experienced a strong vertical deceleration for
 $t\lesssim 0.03$
s when they were only a few millimetres above the bottom plate. This may be related to their interaction with the horizontal drag force exerted by the LSC which increased the bubble velocity in that direction.
Assuming that the bubbles right before departure consisted of pure vapour, an upper bound to the contribution of the latent heat carried by the bubbles per unit time was estimated. Its contribution to the measured total enhancement of the heat current increased with superheat and reached up to 25 %. Therefore the relative contribution of the other heat-transport mechanisms, although always larger than the latent-heat contribution, became smaller as the superheat increased. As just noted, a second contribution to the enhancement of the heat current came from an enhanced buoyancy induced by the bubbles. Although there are no direct measurements of this effect, we assume that it grows strongly with superheat since the bubble emission rate grows exponentially with superheat.
The results found here open several questions that can be answered through further experiments. An interesting issue is how the vertical flow (or plume) velocity changes when vapour-bubble nucleation takes place. How does this change depend on bottom-plate superheat and thus on the Jakob number? Another interesting issue is the nature of the LSC in two-phase flow. Does it have features which are similar to those found in classical one-phase RBC such as cessations, sloshing and twisting? No doubt many other issues will arise in this complex and interesting system as further studies are undertaken.
Acknowledgements
This work was supported by the US National Science Foundation through grant DMR11-58514 and by an ERC-Advanced Grant.
Supplementary movies
Supplementary movies are available at http://dx.doi.org/10.1017/jfm.2016.178.
Appendix A. Bubble detection algorithm
Step 1. Locate active sites: We obtained the average intensity of the whole set of images to be analysed. After imposing an intensity threshold on the average intensity image, active sites were identified with regions that appeared bright (due to all bubbles that nucleated there) and were surrounded by a dark background. The centre of mass of each bright region was identified as the cavity location of the corresponding active site. About 150 active cavities were analysed for each temperature.
Step 2. Calibrate images: We took average intensity images acquired for very low
 $T_{b}$
values for which
 $d_{x}$
and
 ${\it\delta}t$
were small in order to find the distance (in pixel numbers) between neighbouring active cavities. We used the known
 $l$
to calibrate all images acquired under the same circumstances.
Step 3. Analyse frames: Every frame of a given set was imposed the same intensity threshold value; bubbles then appeared bright and the background was dark. Each identified bubble with its centre of mass close to a cavity location was identified as a bubble growing at that specific cavity. A roundness threshold was applied to each identified bubble. The diameter of every bubble on a given frame that fulfilled these requirements was saved in a separate array for each cavity. The bubble width was defined as twice the maximal distance between cavity location (obtained in step 1) and the periphery of the detected bubble. If for a given frame there was no bubble identified for a particular cavity, the diameter value was set to zero. The outcome of step 3 was a time series of growing bubbles, which eventually departed from the surface, for each active cavity as shown in figure 15(a) (circles). These time series often needed further processing for several reasons. As explained earlier, passing bubbles could block the view and could lead to a non-representative diameter value of zero. In addition, when all imposed requirements were fulfilled by a passing bubble, spurious width values could appear in the time series.
Horizontal width
 $d_{x}$
as a function of time of growing bubbles at a single nucleating site. The time series shows different steps involved in the image analysis of nucleating bubbles visualized from the top. (a) Circles present the outcome of step 3. One spurious value larger than the actual
 $d_{x}$
is indicated by the arrow and spurious zero values are marked by dotted circles around them. The solid red line shows the moving average of the time series. It replaced non-representative zeros with a positive
 $d_{x}$
value, which became useful when finding a departing bubble (see figure 10
a). (b) Result obtained after step 4, which equals the time series in circles shown in (a) except for the frames when non-representative zeros were found. In such case non-representative zero values were substituted by the moving average corresponding
 $d_{x}$
value.

Step 4. Removing non-representative zero-diameter values: A moving average was applied to the original time series (outcome of step 3) to obtain a smoother time series as shown in figure 15(a). Close to bubble departure the moving-average time series was smaller than the original time series. This was due to the definition of a moving average and the fact that at times near departure large values of
 $d_{x}$
were averaged with
 $d_{x}=0$
right after departure. Thus the bubble size at departure was underestimated by the moving-average time series. Because the moving average corrected some aspects of the original time series but at the same time underestimated bubble size at departure, the outcome of step 4 was a combination of both original and moving average time series. If for a given frame the original time-series value was smaller than the moving-average time-series value, then at that frame the value in the original time series was replaced by the moving average value, resulting in a time series as shown in figure 15(b). After applying step 4, the time series became more suitable for further analysis.
Step 5. Detection of departing bubbles: Departure was detected when from one frame
 $i$
to the next
 $i+1$
the bubble width decreased and was below a certain threshold at frame
 $i+1$
. This was when step 4 was useful; otherwise departure would have been wrongly detected at one frame before a non-representative zero value. The bubble departure diameter
 $d_{x,max}$
was saved as the value in the time series at frame
 $i$
. The corresponding departure time was recorded, and differences between consecutive departure times
 ${\it\delta}t$
were obtained.
Step 6. Manual correction: The algorithm was not successful in all cases. Thus, time series acquired for all
 $T_{b}$
and
 $l$
values were inspected and departing events were corrected manually when necessary. For example, out-of-focus passing bubbles could appear as very large diameters in the time series. When such a spurious bubble spatially coincided with a cavity in the departure frame, then a non-physical bubble width could be wrongly detected as a departing bubble.
Appendix B. The role of dissolved air
Visualization of two-phase flow from above in apparatus 1 showed that bubbles did not reach the top plate, independent on the elapsed time and superheat value. In apparatus 2 the same behaviour was observed within the first day or so after filling the cell. However, after a few days and with the same temperatures
 $T_{b}^{\star }$
and
 $T_{t}^{\star }$
, an increasing number of bubbles departing from the bottom plate reached the top plate and vanished there. We attribute this slow time evolution of the flow to a gradually increasing air concentration in the liquid for apparatus 2.
The liquid inside the cylindrical cell initially (after filling the cell) had a smaller air concentration than the liquid outside it. The initial air concentration in the (apparatus 2) cylindrical cell was the same as that which led to reproducible and time-independent results in apparatus 1 since the same procedure to fill it was followed. However, the liquid filling the space between cell and the sidewall of square cross-section could not be boiled in situ and degassing by boiling was not possible, leading to a larger amount of air dissolved in it. A small leak between the inside and outside of the cell (needed for pressure equalization) allowed dissolved air to diffuse into the liquid inside the cell. In § 4.1.2 results from experiments performed directly after the cell had been filled and once the system had reached a steady state were reported. Here we discuss the effect of a larger amount of dissolved air in two-phase flow based on images acquired four days after filling the cell and compare the results on bubble size and velocity after departure with those reported in § 4.1.2.
A closeup movie of the nucleation process was captured without changing the camera and the lens focus in order to compare
 $d_{x}$
,
 $d_{z}$
and
 ${\it\Gamma}_{b}$
with values reported in § 4.1.5:
 $d_{x}=45.0\pm 2.0$
pixels,
 $d_{z}=57.1\pm 3.5$
pixels and
 ${\it\Gamma}_{b}=0.79\pm 0.03$
. We analysed 25 bubbles right before detaching from the surface and obtained
 $d_{x}=45.9\pm 1.5$
pixels,
 $d_{z}=57.5\pm 2.2$
pixels and
 ${\it\Gamma}_{b}=0.79\pm 0.03$
. Thus, a larger air concentration in the liquid did not affect the bubble size and aspect ratio right before departure.
(a,b) The bubble diameter
 $d_{x}$
as a function of time. (c,d) The vertical bubble velocity
 $U_{z}$
as a function of time. For all data
 $l=0.60$
mm with
 $T_{b}-T_{on}\simeq 10$
K. (a,c) Correspond to a larger (unknown) air concentration in the liquid and (b,d) to an air concentration of about 20–25 % by volume determined by the filling procedure.

We obtained the time evolution of the bubble radius
 $d_{x}$
and of the vertical velocity
 $U_{z}$
of eight non-merging bubbles. In figures 16(a) and 16(b)
 $d_{x}$
is shown as a function of time for bubbles rising in liquid with different air concentrations, with figure 16(b) corresponding to less dissolved air. Bubbles rising through a liquid with less dissolved air condensed and/or dissolved at a higher rate. Bubbles condensing and/or dissolving slower in an environment with more air let to a larger instantaneous buoyancy and, as observed in figure 16(c), to larger vertical velocities than those in figure 16(d). The heat flux was increased by about 1.5 % in the flow with larger air concentration, also reflecting the larger buoyancy of the bubbles due to their smaller condensation and/or dissolution rate.