1. Introduction
The study of velocity gradient tensor characteristics is of great importance in understanding the behaviour of turbulent flows (Cantwell Reference Cantwell1992; Wallace Reference Wallace2009). Analysing the velocity gradient tensor can reveal important information about the small-scale dynamics in turbulence, such as intermittency, vortex stretching and dissipation of kinetic energy (Tsinober Reference Tsinober2009; Meneveau Reference Meneveau2011). Invariants of velocity gradient tensor, which are scalar quantities and independent of the coordinate system orientation, facilitate the study of kinematics and dynamics of turbulent motions. These invariants can be employed to classify the local topology of the flow (Perry & Chong Reference Perry and Chong1987).
Chong, Perry & Cantwell (Reference Chong, Perry and Cantwell1990) proposed a general method for characterizing flow topology in three-dimensional flow fields based on the critical point theory. They showed that local topology at any point in both compressible and incompressible turbulent fields can be described by three invariants (
 $P,Q,R$
) of the velocity gradient tensor. In incompressible flows, since the first invariant is zero, the local topology can be described by the second and third invariants. In this case, the joint probability density function (JPDF) of
 $Q$
and
 $R$
exhibits a universal teardrop shape. Such a universal shape is reproduced analytically (Cantwell Reference Cantwell1993), and has been observed in numerical simulation of incompressible turbulence for the plane mixing layer (Soria et al.
Reference Soria, Sondergaard, Cantwell, Chong and Perry1994), channel flow (Blackburn, Mansour & Cantwell Reference Blackburn, Mansour and Cantwell1996; Chacín, Cantwell & Kline Reference Chacín, Cantwell and Kline1996), boundary layer (Chong et al.
Reference Chong, Soria, Perry, Chacín, Cantwell and Na1998), forced and decaying isotropic turbulence (Ooi et al.
Reference Ooi, Martin, Soria and Chong1999; Suman & Girimaji Reference Suman and Girimaji2010) and plane jet (da Silva & Pereira Reference da Silva and Pereira2008). The existence of the teardrop shape of the JPDF was also confirmed experimentally in turbulent boundary layers (Andreopoulos & Honkan Reference Andreopoulos and Honkan2001; Elsinga & Marusic Reference Elsinga and Marusic2010). It indicates that although the large-scale motions of these flows are different due to the different global geometries, the small-scale motions of turbulence shows a universal behaviour. In addition to the topological behaviour of the flow, tensorial invariants have been used by several researchers to better understand some aspects of turbulent flows such as generation of Reynolds stress, turbulent kinetic energy, and dissipation (Chacín & Cantwell Reference Chacín and Cantwell2000), subgrid-scale closures (Chertkov, Pumir & Shraiman Reference Chertkov, Pumir and Shraiman1999; van der Bos et al.
Reference van der Bos, Tao, Meneveau and Katz2002; Wang et al.
Reference Wang, Bergstrom, Yin and Yee2006; Kobayashi, Ham & Wu Reference Kobayashi, Ham and Wu2008; Li et al.
Reference Li, Chevillard, Eyink and Meneveau2009) and intermittency (Li & Meneveau Reference Li and Meneveau2005, Reference Li and Meneveau2006).
Compared with the extensive works for analysing the flow topology in incompressible turbulence, fewer works have been done for compressible flows. Pirozzoli & Grasso (Reference Pirozzoli and Grasso2004) conducted numerical simulation of decaying compressible isotropic turbulence at various initial turbulent Mach numbers to examine the effect of compressibility on the time evolution of mean turbulence properties, to characterize the statistical properties of the turbulent structures, and to quantify their dynamics and similarities with the incompressible case. They showed that the JPDF of the second and third invariants of the anisotropic part of the deformation rate tensor demonstrates a universal tear-drop shape as in the incompressible turbulence. Lee, Girimaji & Kerimo (Reference Lee, Girimaji and Kerimo2009) and Suman & Girimaji (Reference Suman and Girimaji2009) showed that the strain-rate tensor statistics are highly dependent on the normalized dilatation in compressible turbulence. Suman & Girimaji (Reference Suman and Girimaji2010) studied the dependence of flow topology and velocity gradients on dilatation in compressible decaying isotropic turbulence. They demonstrated that the flow field topological statistics are almost independent of Reynolds and Mach numbers. They also showed that in compressible turbulence, when the invariant statistics are conditioned based on zero dilatation, results are very similar to the incompressible turbulence. Wang & Lu (Reference Wang and Lu2012) analysed the flow topology of compressible boundary layer at Mach number
 $M=2.0$
using direct numerical simulation (DNS) data. They found that the conditional mean of enstrophy, dissipation and their productions depend on the various topologies in incompressible, compressed and expanded regions of the flow and found that locally compressed regions are more stable and locally expanded regions are more dissipative.
It has been shown that the flow characteristics near the turbulent/non-turbulent interface (TNTI), separating the turbulent region from the irrotational region, differs from inside the turbulent field (Bisset, Hunt & Rogers Reference Bisset, Hunt and Rogers2002; Hunt, Eames & Westerweel Reference Hunt, Eames and Westerweel2006; Westerweel et al. Reference Westerweel, Fukushima, Pedersen and Hunt2009). Analysing velocity gradient tensor near the TNTI is very useful in illuminating the topology and dynamics of the turbulent structures during the entrainment (Chauhan et al. Reference Chauhan, Philip, de Silva, Hutchins and Marusic2014). The turbulent entrainment takes place across the TNTI which is highly convoluted and very thin with the thickness of the order of the Taylor microscale for the flows with mean shear (da Silva & Taveira Reference da Silva and Taveira2010). da Silva & Pereira (Reference da Silva and Pereira2008, Reference da Silva and Pereira2009) studied the invariants of the velocity gradient tensor across the TNTI in incompressible plane jets. They analysed the statistics of invariants in the coordinate system normal to the TNTI and showed that all of the invariants rapidly change once the interface is crossed into the turbulent region. They also showed that irrotational viscous dissipation of kinetic energy exists outside the turbulent region which was further analysed by da Silva & dos Reis (Reference da Silva and dos Reis2011). To the best of the authors’ knowledge, the study of the topological characteristics of the flow close to the TNTI in compressible turbulence has never been done.
In this paper, a detailed statistical depiction of the turbulence structures for the compressible turbulent mixing layer is presented. A comparative study of the invariants and the local flow topology in the core of the turbulent flow and near the TNTI is performed, and when similar data is available in the literature, the presented results are compared with the other types of turbulent flows (isotropic, jet and boundary layer) to highlight the similarities and differences of the findings. The main objective of this work is to gain a better understanding of the small-scale features in compressible turbulence, especially in the regions close to the TNTI. The current paper is organized as follows: in § 2 a brief description of DNS is given. In § 3 the tensorial invariants and local flow topologies are explained. The procedures used to detect the TNTI and to compute the statistics in interface coordinate system are described in § 4. The main results are presented in § 5 and concluding remarks are presented in § 6.
2. DNS of compressible mixing layer
DNS of temporally evolving compressible turbulent mixing layer is performed by solving conservation equations for mass, momentum and sensible energy. A range of convective Mach numbers, from 0.2 to 1.8, is considered. The most compressible case (
 $M_{c}=1.8$
) is selected to be studied for this paper. The criteria for this selection is to have the broadest range of dilatation values, since it has been shown by Suman & Girimaji (Reference Suman and Girimaji2010) that the local flow topology and the behaviour of velocity gradients are highly dependent on the dilatation. A brief description of the DNS is provided in this section while a detailed description can be found in the previous works by Vaghefi et al. (Reference Vaghefi, Nik, Pisciuneri and Madnia2013) and Vaghefi (Reference Vaghefi2014).
Computational domain lengths in streamwise (
 $x$
), transverse (
 $y$
) and spanwise (
 $z$
) directions are
 $300{\it\delta}_{{\it\theta}_{0}}$
,
 $250{\it\delta}_{{\it\theta}_{0}}$
and
 $100{\it\delta}_{{\it\theta}_{0}}$
respectively, where
 ${\it\delta}_{{\it\theta}_{0}}$
is the initial momentum thickness. This domain is discretized on uniform finite difference grid points with size of
 $(N_{x}=1261,~N_{y}=1051,~N_{z}=421)$
. DNS is conducted with a parallel implementation of the two–four finite difference method of Gottlieb & Turkel (Reference Gottlieb and Turkel1976). Boundary conditions are periodic in homogeneous directions (
 $x$
and
 $z$
), and in transverse direction (
 $y$
) the boundaries are characteristic slip walls. The mean flow in streamwise direction is initialized with hyperbolic tangent profile and the mean vertical and spanwise velocities are zero. The pressure field is initially uniform, initial temperature is obtained from the Busemann–Crocco relationship (Ragab & Wu Reference Ragab and Wu1989), and the initial density is calculated from the equation of state for an ideal gas. The convective Mach number,
 $M_{c}={\rm\Delta}U/(c_{1}+c_{2})$
, is 1.8 where
 ${\rm\Delta}U=2U_{1}$
is the velocity difference between upper and lower streams,
 $U_{1}$
is the reference velocity, and
 $c_{1}$
and
 $c_{2}$
are speed of sound in upper and lower streams, respectively. The dynamic viscosity, specific heats and thermal conductivity are constant during the simulations. To initiate turbulence, three-dimensional perturbations obtained by digital filter method (Klein, Sadiki & Janicka Reference Klein, Sadiki and Janicka2003) are imposed on mean velocities.
Results from the DNS validation study (Vaghefi Reference Vaghefi2014) show that the present simulation has sufficient spatial resolution to capture the smallest scales in the flow (Kolmogorov’s scale), and the domain size is large enough compared to the integral scales of the flow. It is also observed that flow reaches a self-similar state in which the shear layer growth rate approaches a constant value, and the turbulent statistics become self-similar. The self-similar stage starts at
 $t/t_{r}=1300$
, where
 $t_{r}={\it\delta}_{{\it\theta}_{0}}/{\rm\Delta}U$
is the reference time. During this stage, the Reynolds number based on vorticity thickness and the free stream velocity, density and viscosity is
 $\mathit{Re}_{{\it\omega}}=13\,000{-}16\,800$
. The Reynolds number based on the Taylor microscale (Pope Reference Pope2000) is
 $\mathit{Re}_{{\it\lambda}}\approx 175$
, and the maximum turbulent Mach number is
 $M_{t}\approx 0.6$
.
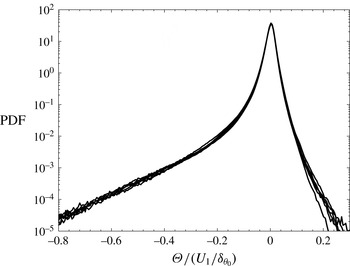
Figure 1 shows the probability density function (PDF) of the velocity divergence or dilatation,
 ${\it\Theta}=\partial u_{i}/\partial x_{i}$
, where
 $u_{i}$
is the velocity component in
 $x_{i}$
direction. Results are shown for six instantaneous times during
 $t/t_{r}=1300{-}1400$
in increment of
 $t/t_{r}=20$
in the turbulent region. It can be seen that PDFs overlap during the self-similar times and they are strongly skewed towards the negative values. The power-law tail for large negative dilatations is qualitatively similar to that observed in compressible isotropic turbulence (Wang et al.
Reference Wang, Shi, Wang, Xiao, He and Chen2012b
). It has been seen in previous works (Pirozzoli & Grasso Reference Pirozzoli and Grasso2004; Wang et al.
Reference Wang, Shi, Wang, Xiao, He and Chen2012a
) that the PDF of dilatation is skewed towards the negative values and as the turbulent Mach number is increased, the PDF becomes more skewed towards the negative dilatation. In order to have sufficient statistical points for extreme values of dilatations for the analysis provided in the rest of this paper, all of the analyses for regions with negative or positive dilatations are done with 26 instantaneous times during the self-similar regime from
 $t/t_{r}=1300$
to 1400 with increment of
 $t/t_{r}=4$
, but for the analysis in regions with small dilatation, six instantaneous times in the above range with increment of
 $t/t_{r}=20$
are used since it is observed that increasing the data samples does not change the results.
PDF of dilatation in the turbulent region for six instantaneous times during the self-similar state between
 $t/t_{r}=1300{-}1400$
in increments of
 $t/t_{r}=20$
.

3. Invariants of velocity gradient tensor and local flow topology
The local topology of a three-dimensional flow field can be obtained by invariants of the velocity gradient tensor,
 $\unicode[STIX]{x1D608}_{ij}=\partial u_{i}/\partial x_{j}$
, using critical point theory (Chong et al.
Reference Chong, Perry and Cantwell1990). The eigenvalues of velocity gradient tensor,
 ${\it\lambda}_{i}$
have the following characteristic equation:
 $$\begin{eqnarray}{\it\lambda}_{i}^{3}+P{\it\lambda}_{i}^{2}+Q{\it\lambda}_{i}+R=0\end{eqnarray}$$
where the first, second and third invariants are
 $$\begin{eqnarray}\displaystyle & \displaystyle P=-\unicode[STIX]{x1D61A}_{ii}=-{\it\Theta}, & \displaystyle\end{eqnarray}$$
 $$\begin{eqnarray}\displaystyle & \displaystyle Q={\textstyle \frac{1}{2}}(P^{2}-\unicode[STIX]{x1D61A}_{ij}\unicode[STIX]{x1D61A}_{ji}-\unicode[STIX]{x1D61E}_{ij}\unicode[STIX]{x1D61E}_{ji}), & \displaystyle\end{eqnarray}$$
 $$\begin{eqnarray}R={\textstyle \frac{1}{3}}(-P^{3}+3PQ-\unicode[STIX]{x1D61A}_{ij}\unicode[STIX]{x1D61A}_{jk}\unicode[STIX]{x1D61A}_{ki}-3\unicode[STIX]{x1D61E}_{ij}\unicode[STIX]{x1D61E}_{jk}\unicode[STIX]{x1D61A}_{ki}),\end{eqnarray}$$
respectively. In the above equations, the strain-rate tensor,
 $\unicode[STIX]{x1D61A}_{ij}=1/2(\partial u_{i}/\partial x_{j}+\partial u_{j}/\partial x_{i})$
, and the rotation-rate tensor,
 $\unicode[STIX]{x1D61E}_{ij}=1/2(\partial u_{i}/\partial x_{j}-\partial u_{j}/\partial x_{i})$
, are the symmetric and antisymmetric parts of
 $\unicode[STIX]{x1D608}_{ij}$
, respectively. The invariants of
 $\unicode[STIX]{x1D61A}_{ij}$
are
 $$\begin{eqnarray}\displaystyle & \displaystyle P_{S}=P=-\unicode[STIX]{x1D61A}_{ii}, & \displaystyle\end{eqnarray}$$
 $$\begin{eqnarray}\displaystyle & \displaystyle Q_{S}={\textstyle \frac{1}{2}}(P_{S}^{2}-\unicode[STIX]{x1D61A}_{ij}\unicode[STIX]{x1D61A}_{ji}), & \displaystyle\end{eqnarray}$$
 $$\begin{eqnarray}\displaystyle & \displaystyle R_{S}={\textstyle \frac{1}{3}}(-P_{S}^{3}+3P_{S}Q_{S}-\unicode[STIX]{x1D61A}_{ij}\unicode[STIX]{x1D61A}_{jk}\unicode[STIX]{x1D61A}_{ki}). & \displaystyle\end{eqnarray}$$
 $\unicode[STIX]{x1D61E}_{ij}$
are zero and its second invariant is
 $$\begin{eqnarray}Q_{W}=-{\textstyle \frac{1}{2}}\unicode[STIX]{x1D61E}_{ij}\unicode[STIX]{x1D61E}_{ji}.\end{eqnarray}$$
Chong et al. (Reference Chong, Perry and Cantwell1990) showed that
 $P{-}Q{-}R$
space is divided into several regions, each region represents a particular flow topology. They showed that the discriminant surface of (3.1), which separates regions with real and complex eigenvalues, is
 $$\begin{eqnarray}\mathscr{S}_{1}=27R^{2}+(4P^{3}-18PQ)R+(4Q^{3}-P^{2}Q^{2})=0.\end{eqnarray}$$
In the focal region (
 $\mathscr{S}_{1}>0$
),
 $\unicode[STIX]{x1D608}_{ij}$
has one real and two complex-conjugate eigenvalues, and in the non-focal region (
 $\mathscr{S}_{1}<0$
),
 $\unicode[STIX]{x1D608}_{ij}$
has three real, distinct eigenvalues. Surface
 $\mathscr{S}_{1}$
can be split into two surfaces:
 $$\begin{eqnarray}\mathscr{S}_{1a}={\textstyle \frac{1}{3}}P\left(Q-{\textstyle \frac{2}{9}}P^{2}\right)-{\textstyle \frac{2}{27}}(-3Q+P^{2})^{3/2}-R=0,\end{eqnarray}$$
and
 $$\begin{eqnarray}\mathscr{S}_{1b}={\textstyle \frac{1}{3}}P\left(Q-{\textstyle \frac{2}{9}}P^{2}\right)+{\textstyle \frac{2}{27}}(-3Q+P^{2})^{3/2}-R=0.\end{eqnarray}$$
These surfaces osculate each other and form a cusp at which all of the eigenvalues are real and equal. In the region with
 $\mathscr{S}_{1}>0$
,
 $\unicode[STIX]{x1D608}_{ij}$
has purely imaginary eigenvalues on surface
 $\mathscr{S}_{2}$
which is
 $$\begin{eqnarray}\mathscr{S}_{2}=PQ-R=0.\end{eqnarray}$$
The surfaces
 $\mathscr{S}_{1a}$
,
 $\mathscr{S}_{1b}$
,
 $\mathscr{S}_{2}$
and
 $R=0$
divide
 $P{-}Q{-}R$
space into different zones with particular flow topology.
For compressible flows, due to the spatial complexity of different zones in
 $P{-}Q{-}R$
space, it is more convenient to analyse the flow topology in the
 $Q{-}R$
plane for a specific value of
 $P$
(Suman & Girimaji Reference Suman and Girimaji2010). Intersections of the planes
 $\mathscr{S}_{1a}$
,
 $\mathscr{S}_{1b}$
,
 $\mathscr{S}_{2}$
and
 $R=0$
with the
 $P$
-constant planes appear as curves dividing
 $Q{-}R$
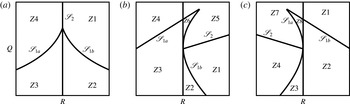
plane into various zones. Figure 2 shows these zones for
 $P=0$
,
 $P>0$
and
 $P<0$
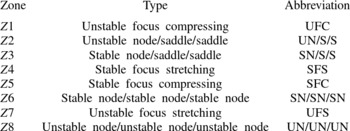
where the corresponding local flow topology for each zone is given in table 1. For
 $P=0$
, the curve
 $\mathscr{S}_{2}$
is coincident with
 $R=0$
and the curves
 $\mathscr{S}_{1a}$
and
 $\mathscr{S}_{1b}$
are symmetric with respect to
 $R=0$
. These curves divide
 $Q{-}R$
plane into four zones corresponding to two focal (UFC and SFS) and two non-focal (UN/S/S and SN/S/S) topologies. If
 $P\neq 0$
, intersection of
 $\mathscr{S}_{1a}$
and
 $\mathscr{S}_{1b}$
is not on
 $R=0$
and
 $\mathscr{S}_{2}$
intersects with
 $\mathscr{S}_{1b}$
and
 $\mathscr{S}_{1a}$
for
 $P>0$
and
 $P<0$
, respectively. For
 $P>0$
, three focal regions, (UFC, SFS and SFC), and three non-focal regions (UN/S/S, SN/S/S and SN/SN/SN) can exist, and for
 $P<0$
, six possible topologies are distinguished, three of them are focal (UFC, SFS and UFS), and three of them are non-focal (UN/S/S, SN/S/S and UN/UN/UN).
The local flow topologies in
 $Q{-}R$
plane for (a) incompressible,
 $P=0$
, (b) compressed,
 $P>0$
, and (c) expanded,
 $P<0$
, regions. The description of acronyms is provided in table 1.

Description of the acronyms of various local topologies in
 $P{-}Q{-}R$
space.

4. Detection of turbulent/non-turbulent interface
The interface between turbulent and non-turbulent regions can be detected either with the vorticity norm (Bisset et al.
Reference Bisset, Hunt and Rogers2002; da Silva & Pereira Reference da Silva and Pereira2008),
 $|{\it\bf\Omega}|=({\it\bf\Omega}_{i}{\it\bf\Omega}_{i})^{0.5}$
where
 ${\it\bf\Omega}_{i}$
is the vorticity vector, or with the conserved scalar convected by the turbulent flow, as usually done in experimental studies (Westerweel et al.
Reference Westerweel, Fukushima, Pedersen and Hunt2009). In present work, a certain threshold for vorticity magnitude is chosen to determine the TNTI. In order to find this threshold, the same procedure as that explained in Bisset et al. (Reference Bisset, Hunt and Rogers2002) is followed. It is found that the threshold of
 $|{\it\bf\Omega}|=0.01U_{1}/{\it\delta}_{{\it\theta}_{0}}$
, which is 7 % of the mean vorticity norm in the centre plane, provides the best detection of the TNTI.
Conditional statistics with respect to the TNTI are calculated using a similar procedure as in previous works (Bisset et al.
Reference Bisset, Hunt and Rogers2002; da Silva & Pereira Reference da Silva and Pereira2008). Since the flow is homogenous in spanwise (
 $z$
) direction, the detection of the interface and calculation of the corresponding statistics are done in
 $x{-}y$
planes. In each plane, two interfaces are detected, for upper and lower streams, whose vorticity magnitudes are constant and equal to the predefined threshold. The location of each interface is found using linear interpolation for each grid point in
 $x$
direction. Since the shape of the interface can be quite complex, it is more common to use interface envelope rather than the interface (Bisset et al.
Reference Bisset, Hunt and Rogers2002; Westerweel et al.
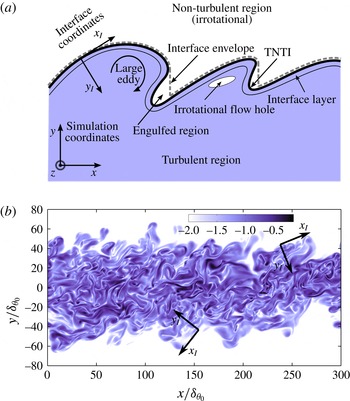
Reference Westerweel, Fukushima, Pedersen and Hunt2005). For each stream, the interface envelope is defined as the outermost point of the interface in vertical direction. It should be noted that in compressible mixing layers, the flow shocklets appear both inside and outside of the mixing layer. Strong flow shocklets produce vorticity, consequently, regions with high vorticity magnitude, higher than the threshold used to detect TNTI, may exist outside of the turbulent mixing region. Therefore, in the detection of the TNTI, it is ensured that the interface belongs to the edge of the turbulent mixing region not the high-vorticity regions corresponding to the flow shocklets outside of the mixing layer. Figure 3(a) shows schematic of the TNTI for upper stream, where the solid line represents the interface detected by vorticity norm and the broken line indicates the interface envelope.
(a) Schematic of the TNTI for upper stream. (b) Contours of vorticity norm in logarithmic scale for middle
 $x{-}y$
plane for
 $t/t_{r}=1372$
, along with interface coordinates for two arbitrary points in upper and lower streams.

In order to obtain the conditional statistics with respect to the distance from the TNTI, an interface coordinate system
 $(x_{I},y_{I})$
is defined. The origin of the new coordinate system is on the interface envelope and its axes,
 $x_{I}$
and
 $y_{I}$
, are tangent and normal to the interface envelope respectively. For both upper and lower interfaces, the direction of the axes are such that the points with
 $y_{I}>0$
and
 $y_{I}<0$
are located in turbulent and irrotational regions, respectively. Figure 3(b) shows the interface coordinates for two arbitrary points on upper and lower interfaces along with vorticity norm contours in logarithmic scale. The value of a flow variable at each
 $(x_{I},y_{I})$
point in interface coordinates in
 $z=Z$
plane at time
 $t=T$
,
 $\mathscr{F}(x_{I},y_{I},Z,T)$
, is calculated by the value of its neighbour points in simulation coordinates,
 $F(x,y,Z,T)$
, using bilinear interpolation. In order to obtain conditional statistics of any flow variable related to the normal distance
 $y_{I}$
from TNTI, the average value of all of the
 $(0,y_{I})$
points in interface coordinate system is calculated. For this procedure, first the irrotational holes and engulfed regions, shown in figure 3(a), are subtracted from statistical points which results in
 $N_{x}^{\mathit{up}}$
and
 $N_{x}^{\mathit{low}}$
statistical points in upper and lower interfaces for each
 $z$
-plane at each instantaneous time. Then, the value of statistical points for all the
 $z$
-planes for
 $N_{t}$
times during the self-similar regime are averaged. Therefore, conditional mean of a flow variable in interface coordinate system is calculated by
 $$\begin{eqnarray}\langle \,f(y_{I})\rangle _{I}=\frac{1}{N_{P}}\mathop{\sum }_{n=1}^{N_{t}}\mathop{\sum }_{k=1}^{N_{z}}\left(\left.\mathop{\sum }_{i=1}^{N_{x}^{\mathit{up}}}\mathscr{F}(0,y_{I},z,t)\right|_{\text{up}}+\left.\mathop{\sum }_{i=1}^{N_{x}^{\mathit{low}}}\mathscr{F}(0,y_{I},z,t)\right|_{\text{low}}\right)\end{eqnarray}$$
where
 $N_{P}=\sum _{n=1}^{N_{t}}\sum _{k=1}^{N_{z}}(N_{x}^{\mathit{up}}+N_{x}^{\mathit{low}})$
is the number of total statistical points at each location with respect to the interface. In order to obtain the statistics in interface coordinate system,
 $N_{t}=26$
instantaneous times from
 $t/t_{r}=1300$
to
 $t/t_{r}=1400$
with increment of
 $t/t_{r}=4$
are used.
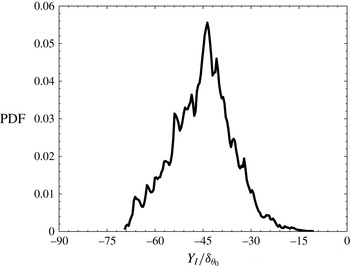
Figure 4 shows PDF of the vertical distance of the TNTI envelope from the mid-plane,
 $Y_{I}$
, for the lower stream. The mean, variance, skewness and kurtosis of PDF are
 $-45.22$
, 9.44,
 $-0.01$
and 2.98, respectively, which indicates that the PDF of interface location is close to the Gaussian, in agreement with previous studies for turbulent jets and wakes (Bisset et al.
Reference Bisset, Hunt and Rogers2002; Westerweel et al.
Reference Westerweel, Fukushima, Pedersen and Hunt2005; da Silva & Pereira Reference da Silva and Pereira2008). Interface location in the upper stream has the same behaviour except the mean value is positive.
PDF of the vertical distance of interface envelope from the mid-plane,
 $Y_{I}$
, for the lower stream corresponding to an instantaneous time in self-similar state.

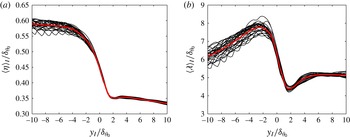
In the rest of this paper, for the analysis in interface coordinate system, the normal distance from the TNTI is normalized with the Kolmogorov or Taylor length scales. Figure 5(a) shows conditional mean profile of Kolmogorov length scale
 ${\it\eta}=({\it\nu}^{3}/{\it\varepsilon})^{1/4}$
, where
 ${\it\nu}$
is the kinematic viscosity and
 ${\it\varepsilon}$
is the turbulent dissipation. It can be seen that the conditional profiles are similar for 26 instantaneous times used for averaging process and the Kolmogorov length scale is approximately constant in turbulent region. Therefore, the value of
 ${\it\eta}=0.33{\it\delta}_{{\it\theta}_{0}}$
is chosen as the reference Kolmogorov length scale for the analysis in interface coordinate system.
Conditional average of (a) Kolmogorov and (b) Taylor length scales in interface coordinate system. Each thin black line represents the conditional profile for an instantaneous time and the thick (red online) line shows the conditional average profile for
 $N_{t}=26$
times.

The conditional mean profiles of the Taylor length scale are shown in figure 5(b). The Taylor length scale is defined as
 $\langle {\it\lambda}\rangle _{I}=\langle {\it\lambda}_{x}+{\it\lambda}_{y}+{\it\lambda}_{z}\rangle _{I}/3$
, where
 ${\it\lambda}_{i}$
is the Taylor length scale in
 $i$
direction:
 $$\begin{eqnarray}\langle {\it\lambda}_{i}\rangle _{I}=\left(\frac{\langle {u_{i}^{\prime }}^{2}\rangle _{I}}{\langle (\partial u_{i}^{\prime }/\partial x_{i})^{2}\rangle _{I}}\right)^{1/2},\end{eqnarray}$$
where
 $u_{i}^{\prime }$
is the fluctuating part of
 $u_{i}$
velocity. The conditional profiles of Taylor microscale are similar for the times used for averaging process, and
 $\langle {\it\lambda}\rangle _{I}$
is roughly constant inside the turbulent region. The reference value of
 ${\it\lambda}=5.13{\it\delta}_{{\it\theta}_{0}}$
is chosen for Taylor length scale for the analysis in interface coordinate system.
5. Results
5.1. Average of invariants
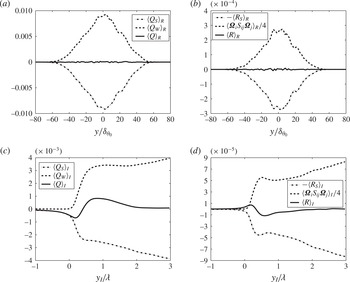
The variations of the mean invariants in the simulation coordinate system,
 $\langle .\rangle _{R}$
, and their conditional averages in interface coordinate system are shown in figure 6. The mean statistics in simulation coordinates are obtained by spatial averaging in periodic
 $x{-}z$
planes and time averaging in self-similar stage. Figure 6(a) shows that
 $\langle Q_{W}\rangle _{R}$
, which is proportional to the enstrophy, has its maximum value in the middle of the shear layer and decreases towards the free streams. Variation of
 $\langle Q_{S}\rangle _{R}$
, which is related to the local dissipation of kinetic energy per unit viscosity, is opposite to the
 $\langle Q_{W}\rangle _{R}$
. As a result, the sum of two,
 $\langle Q\rangle _{R}$
, is approximately zero in the mixing layer. Figure 6(b) shows that
 $\langle R_{S}\rangle _{R}$
, which is the production term in the dissipation transport equation, exhibits the same behaviour as
 $\langle Q_{W}\rangle _{R}$
, its maximum is in the middle of the layer and it approaches zero near the edge of the mixing layer. Figure 6(b) shows that
 $\langle R\rangle _{R}$
is nearly zero in the mixing layer, therefore,
 $\langle {\it\bf\Omega}_{i}\unicode[STIX]{x1D61A}_{ij}{\it\bf\Omega}_{j}\rangle _{R}/4=\langle R_{S}\rangle _{R}-\langle R\rangle _{R}$
, which is proportional to the vortex stretching (enstrophy production) has approximately the same profile as
 $\langle R_{S}\rangle _{R}$
. It should be noted that for more clarity,
 $\langle R_{S}\rangle _{R}$
is shown with the opposite sign.
(a,b) Average of invariants in simulation coordinate system; (c,d) conditional average of invariants in interface coordinate system. The second and the third invariants are normalized by
 $(U_{1}^{2}/{\it\delta}_{{\it\theta}_{0}}^{2})$
and
 $(U_{1}^{3}/{\it\delta}_{{\it\theta}_{0}}^{3})$
, respectively.

Figure 6(c,d) show the conditional mean of invariants with respect to the normal distance from the TNTI, which reveals some trends cannot be extracted from mean profiles in simulation coordinate system. In these figures, the distance from TNTI is normalized by the reference Taylor microscale,
 ${\it\lambda}$
. Figure 6(c) demonstrates that
 $\langle Q_{W}\rangle _{I}$
has a sharp jump near the TNTI. It has been shown in incompressible turbulence (da Silva & Taveira Reference da Silva and Taveira2010) that the sharp jump in vorticity magnitude corresponds to the interface layer with thickness close to one Taylor scale for the flows with presence of the mean shear. Figure 6(c) confirms that the thickness of the interface layer is also of the order of one Taylor scale for the compressible mixing layer. This figure also shows that
 $\langle Q_{S}\rangle _{I}$
has a sharp drop in proximity of the TNTI. For
 $y_{I}<0$
and far from the interface,
 $\langle Q_{S}\rangle _{I}$
is almost zero, but,
 $\langle Q_{S}\rangle _{I}$
starts to increase (in magnitude) before the interface
 $(y_{I}=0)$
in irrotational region. It indicates that viscous dissipation of kinetic energy exists in an irrotational flow region close to the TNTI, which is consistent with the observations for incompressible jets (da Silva & Pereira Reference da Silva and Pereira2008). The conditional mean of the second invariant
 $\langle Q\rangle _{I}$
has the same behaviour as
 $\langle Q_{S}\rangle _{I}$
for
 $y_{I}\leqslant 0$
since in irrotational region
 $Q_{W}$
(or enstrophy) is almost zero. By moving from the irrotational region into the turbulent region,
 $\langle Q\rangle$
increases and reaches a positive value. For
 $y_{I}>2{\it\lambda}$
,
 $\langle Q_{W}\rangle _{I}$
and
 $\langle Q_{S}\rangle _{I}$
have almost the same magnitude and
 $\langle Q\rangle _{I}\approx 0$
, which is similar to the observations for the plane jets (da Silva & Pereira Reference da Silva and Pereira2008). This behaviour of the
 $\langle Q\rangle _{I}$
will be further analysed in § 5.3.1.
Figure 6(d) shows that
 $\langle {\it\bf\Omega}_{i}\unicode[STIX]{x1D61A}_{ij}{\it\bf\Omega}_{j}\rangle _{I}/4$
and
 $\langle R_{S}\rangle _{I}$
are zero in irrotational flow and after a sharp rise in the interface layer, they become positive inside the turbulent region. For
 $0<y_{I}<0.24{\it\lambda}$
,
 $\langle R_{S}\rangle _{I}$
increases with higher rate than
 $\langle {\it\bf\Omega}_{i}\unicode[STIX]{x1D61A}_{ij}{\it\bf\Omega}_{j}\rangle _{I}/4$
, and
 $\langle R\rangle _{I}$
, which represents the competition between the production of enstrophy and the production of dissipation, has its maximum value at
 $y_{I}\approx 0.24{\it\lambda}$
. For
 $0.24{\it\lambda}<y_{I}<0.62{\it\lambda}$
,
 $\langle {\it\bf\Omega}_{i}\unicode[STIX]{x1D61A}_{ij}{\it\bf\Omega}_{j}\rangle _{I}/4$
increases more rapidly than
 $\langle R_{S}\rangle _{I}$
and at
 $y_{I}\approx 0.62{\it\lambda}$
,
 $\langle R\rangle _{I}$
reaches its minimum value. In the turbulent region and outside of the interface layer,
 $y_{I}>{\it\lambda}$
,
 $\langle R\rangle _{I}$
becomes approximately zero which is in agreement with the results found in the plane jets (da Silva & Pereira Reference da Silva and Pereira2008).
5.2. Local flow topology
In this section, statistics of invariants of the velocity gradient tensor are studied using JPDF. Because of the complexity of JPDFs in three-dimensional
 $P{-}Q{-}R$
space, statistics are shown in
 $P=\text{constant}$
planes. Different values of
 $P$
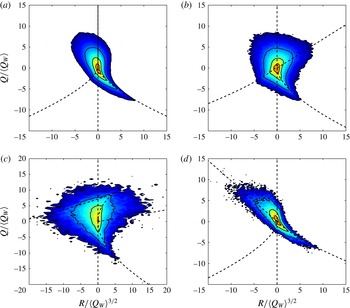
are chosen to compare the statistics in regions with zero, positive and negative dilatations. Figure 7 shows JPDFs of second and third invariants for
 $P=0$
, 0.1, 0.3 and
 $-0.1$
. Statistics are calculated for all of the points with
 $P\pm {\it\epsilon}$
around the above levels. The threshold of
 ${\it\epsilon}=0.005$
is chosen, and it is examined that using the smaller thresholds does not change the shape of JPDFs and other statistics of the flow. Unless otherwise stated, all of the values of
 $P$
presented in this work are based on the reference velocity and initial momentum thickness,
 $(U_{1}/{\it\delta}_{{\it\theta}_{0}})$
.
JPDFs of
 $R$
and
 $Q$
for four different dilatation levels: (a)
 $P=0.0$
, (b)
 $P=0.1$
, (c)
 $P=0.3$
, (d)
 $P=-0.1$
, with corresponding normalized first invariants of
 $P/\langle Q_{W}\rangle ^{1/2}=0.0$
, 1.78, 7.35 and
 $-1.07$
, respectively. Both colour and line contours are in logarithmic scale. The line contour levels from outer to inner are
 $-4$
,
 $-3$
,
 $-2$
and
 $-1$
.

For
 $P=0$
, data of 6 instantaneous times during the self-similar state are used but for other dilatation levels, in order to have sufficient statistical points, 26 times are used between
 $t/t_{r}=1300{-}1400$
. Statistical points are taken in turbulent region (between upper and lower TNTIs) and all the points with
 $|{\it\bf\Omega}|=(4Q_{W})^{1/2}<0.01$
are subtracted from statistics to exclude the effect of irrotational regions from results. In order to be able to make comparisons with the other works in the literature, invariants
 $Q$
and
 $R$
are normalized by
 $\langle Q_{W}\rangle$
and
 $\langle Q_{W}\rangle ^{3/2}$
respectively, where
 $\langle .\rangle$
denotes the mean of statistical samples.
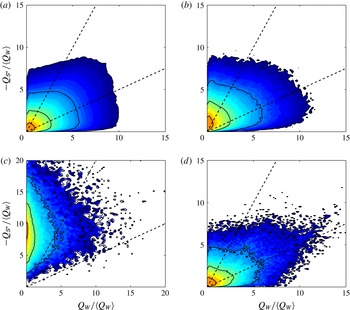
Figure 7(a) shows that the JPDFs of
 $Q$
and
 $R$
for
 $P=0$
have teardrop shape around the origin. It has been shown that for different flow configurations (Soria et al.
Reference Soria, Sondergaard, Cantwell, Chong and Perry1994; Blackburn et al.
Reference Blackburn, Mansour and Cantwell1996; Chacín et al.
Reference Chacín, Cantwell and Kline1996; Chong et al.
Reference Chong, Soria, Perry, Chacín, Cantwell and Na1998; Ooi et al.
Reference Ooi, Martin, Soria and Chong1999; da Silva & Pereira Reference da Silva and Pereira2008; Suman & Girimaji Reference Suman and Girimaji2010), the JPDF of second and third invariants has a universal teardrop shape in the
 $Q{-}R$
plane. It is also shown that for compressible isotropic turbulence and compressible turbulent boundary layer, the joint statistics between
 $R$
and
 $Q$
in
 $P=0$
plane has the same behaviour as the incompressible turbulence (Suman & Girimaji Reference Suman and Girimaji2010; Wang & Lu Reference Wang and Lu2012). These observations are confirmed here for the compressible mixing layer. It is inferred from figure 7(a) that for
 $P=0$
, focal structures (
 $\mathscr{S}_{1}>0$
) are more than non-focal structures (
 $\mathscr{S}_{1}<0$
) (64.3 %–35.7 %) which is in agreement with results reported for incompressible isotropic turbulence (Pirozzoli & Grasso Reference Pirozzoli and Grasso2004).
The contours of JPDF for
 $P=0.1$
is presented in figure 7(b) which corresponds to the compression region. Comparing figure 7(a,b) reveals that in compression regions, the JPDF is more symmetrical with respect to
 $R=0$
. Also, in contrast to
 $P=0$
, the focal structures are less than non-focal structures (48.4–51.6 %). As the level of compression is increased, figure 7(c), more area of JPDF is below the discriminant (
 $\mathscr{S}_{1}=0$
) and the ratio between focal and non-focal structures decreases (23.7–76.3 %). For the regions with expansion, figure 7(d), JPDFs are weakly skewed towards
 $\mathscr{S}_{2}$
and ratio of focal to non-focal structures are less than
 $P=0$
(59.2–40.8 %). As it has been shown in figure 1, in compressible mixing layer the majority of points with non-zero dilatation are in compression regions, therefore there are not enough points available to study the regions with extreme expansion. Figure 7 shows that both compression and expansion increase the probability of non-focal structures in the field, however this increase is more significant for compression regions.
In order to quantify the statistical properties of JPDFs in figure 7, the probability of occurrence of different topologies shown in table 1 (
 $Z1{-}Z8$
) is examined. The occurrence of each topology zone is calculated by volume ratio,
 $V_{r}$
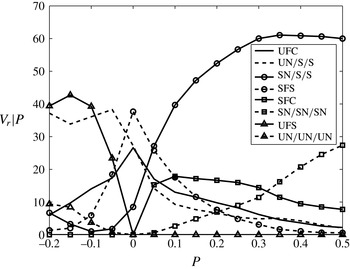
, which is the percentage of volume of each zone in total volume. To study the effect of compressibility, the probabilities are analysed for different levels of dilatation. Figure 8 shows conditional volume ratio of each zone,
 $V_{r}|P$
, based on different levels of the first invariant,
 $P$
. In order to calculate the conditional statistics, for each level of the first invariant,
 $P_{0}$
, all of the points with
 $P=P_{0}\pm {\it\epsilon}$
are chosen as data sample and the occurrence probability of different zones for each data sample is calculated.
Variation of the volume ratio occupied by different topological zones conditioned by the first invariant,
 $P$
.

It can be seen in figure 8 that for
 $P=0$
, which corresponds to the points with zero dilatation, the most probable topology is SFS (37.7 %), after that UN/S/S and UFC have the highest probabilities (27.2 % and 26.6 %), and the least probable topology is SN/S/S (8.5 %). The percentage of different topologies are very close to those reported by Suman & Girimaji (Reference Suman and Girimaji2010) for incompressible flow field. They observed that for incompressible isotropic turbulence, SFS, UN/S/S, UFC and SN/S/S topologies occupy 39.8 %, 25.4 %, 27.5 % and 7.3 % of the computational box, respectively. Similar results are also obtained for the DNS data for convective Mach numbers
 $M_{c}=0.2$
, 0.8 and 1.2. These agreements show that the regions in mixing layer with negligible dilatation have similar behaviour as the incompressible isotropic turbulence.
Figure 8 also shows that in compressed regions (
 $P>0$
), by increasing the compressibility level, occurrence of topology SN/S/S is increased and it becomes the dominant topology. Probability of the regions with SFS structures decreases significantly as the compression increases and for
 $P>0.3$
they occupy less than 5 % of the flow volume. In regions with moderate compression
 $0.1<P<0.3$
, SFC has the second highest probability, and for the regions with high compression
 $P>0.3$
, corresponding to shocklets, the SN/SN/SN structures are the most probable topology after SN/S/S. It can also be seen that in locally compressed regions the majority of structures are stable (more than 80 % for
 $P>0.1$
). In expansion regions,
 $P<0$
, the probability of unstable topologies UN/S/S and UFS is increased and they become the dominant topologies in these regions. By increasing the expansion level, the probability of unstable topology UN/UN/UN is increased, and it becomes the third most probable topology. The presented results show that in locally expanding regions, the majority of structures are unstable (more than 90 % for
 $P<-0.1$
).
In topological classification based on critical point theory, the local streamline in stable topologies are converged toward the critical point and in unstable topologies the local streamlines are diverged from the critical point. Therefore, in locally compressed regions, where the volume of the flow is decreased, structures are mostly stable and in locally expanding regions, where the volume of the flow is increased, the majority of structures are unstable. Similar observation is reported for compressible isotropic turbulence (Suman & Girimaji Reference Suman and Girimaji2010).
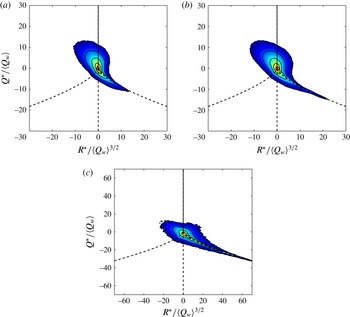
The statistics of the invariants of the velocity gradient tensor are further studied using the JPDF of the second and third invariants of the traceless part of the velocity gradient tensor (
 $Q^{\ast }$
,
 $R^{\ast }$
) in figure 9, where
 $$\begin{eqnarray}Q^{\ast }=-{\textstyle \frac{1}{2}}(\unicode[STIX]{x1D61A}_{ij}^{\ast }\unicode[STIX]{x1D61A}_{ij}^{\ast }-\unicode[STIX]{x1D61E}_{ij}\unicode[STIX]{x1D61E}_{ij})=Q-{\textstyle \frac{1}{3}}P^{2},\end{eqnarray}$$
and
 $$\begin{eqnarray}R^{\ast }=-{\textstyle \frac{1}{3}}(\unicode[STIX]{x1D61A}_{ij}^{\ast }\unicode[STIX]{x1D61A}_{jk}^{\ast }\unicode[STIX]{x1D61A}_{ki}^{\ast }+3\unicode[STIX]{x1D61E}_{ij}\unicode[STIX]{x1D61E}_{jk}\unicode[STIX]{x1D61A}_{ki}^{\ast })=R-{\textstyle \frac{1}{3}}PQ+{\textstyle \frac{2}{27}}P^{3}.\end{eqnarray}$$
In the above equations,
 $\unicode[STIX]{x1D61A}_{ij}^{\ast }$
is the anisotropic part of the strain-rate tensor,
 $\unicode[STIX]{x1D61A}_{ij}^{\ast }=\unicode[STIX]{x1D61A}_{ij}-(1/3)\unicode[STIX]{x1D61A}_{kk}{\it\delta}_{ij}$
.
JPDFs of
 $R^{\ast }$
and
 $Q^{\ast }$
: (a) incompressible region, (b) entire turbulent region and (c) compressed region with
 $P>0.15$
. Both colour and line contours are in logarithmic scale. The line contour levels from outer to inner are
 $-5$
,
 $-4$
,
 $-3$
,
 $-2$
and
 $-1$
.

Pirozzoli & Grasso (Reference Pirozzoli and Grasso2004) showed that the JPDF of the second and third invariants of the traceless part of the velocity gradient tensor (
 $Q^{\ast }$
,
 $R^{\ast }$
) has a universal teardrop shape similar to incompressible turbulence. However, in a more recent work by Wang et al. (Reference Wang, Shi, Wang, Xiao, He and Chen2012a
), it has been shown that the JPDFs of (
 $Q^{\ast }$
,
 $R^{\ast }$
) do not remain universal with the variation of the dilatation level. They showed that in compressible turbulence with high turbulent Mach number, the JPDF has a longer tail in the fourth quadrant compared with that observed in weakly and moderately compressible turbulence in Pirozzoli & Grasso (Reference Pirozzoli and Grasso2004) work. Wang et al. (Reference Wang, Shi, Wang, Xiao, He and Chen2012a
) showed that the shape of the JPDF in weak compression and expansion regions is similar to the tear-drop shape observed by Pirozzoli & Grasso (Reference Pirozzoli and Grasso2004). They also showed that the shape of the JPDF becomes sharp with an extended tail around the right branch of the discriminant curve in strong compression regions, leading to the longer tail of the JPDF of (
 $Q^{\ast }$
,
 $R^{\ast }$
) for the overall flow field when compared with incompressible turbulence. These findings are confirmed for a compressible mixing layer in figure 9. This figure shows that the JPDF has universal tear-drop shape in incompressible regions of the flow. In figure 9(b) JPDF of (
 $Q^{\ast }$
,
 $R^{\ast }$
) is shown for the entire turbulent region. It can be seen that this JPDF has a longer tail in fourth quadrant compared with the incompressible turbulence which is in agreement with the results found by Wang et al. (Reference Wang, Shi, Wang, Xiao, He and Chen2012a
). Figure 9(c) shows that in the regions under strong compression,
 $P>0.15$
, the JPDF is skewed towards the discriminant line and does not have the universal tear-drop shape, which again is in agreement with the results found by Wang et al. (Reference Wang, Shi, Wang, Xiao, He and Chen2012a
) for compressible isotropic turbulence.
5.2.1. Local flow topology near the TNTI
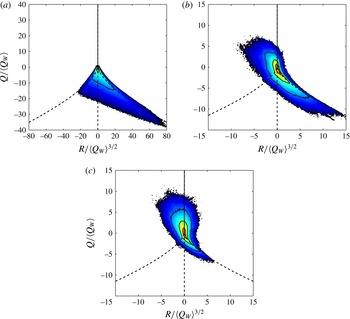
In order to examine the local flow topology in the proximity of the TNTI, the analysis presented in the previous section is extended to the interface coordinate system. Figure 10 shows JPDFs of
 $R$
and
 $Q$
at three locations on interface coordinates:
 $y_{I}=0$
(TNTI),
 $y_{I}\approx 4{\it\eta}$
(near the TNTI) and
 $y_{I}={\it\lambda}$
(inside the turbulent region) for the data points with zero dilatation. Figure 10(a) shows that at the TNTI, the JPDF does not have the characteristic tear-drop shape, and it is mainly found in non-focal region (
 $\mathscr{S}_{1}<0$
). This means that for almost all of the points on TNTI, the strain regions dominate the enstrophy regions and
 $Q<0$
, which is consistent with the previous results for average statistics presented in figure 6(c). It can also be seen that the JPDF is stretched in zone
 $Z2$
and the majority of the points have UN/S/S topology.
JPDFs of
 $R$
and
 $Q$
for incompressible regions of the flow for three different locations in interface coordinates: (a)
 $y_{I}=0$
, (b)
 $y_{I}/\approx 4{\it\eta}$
and (c)
 $y_{I}={\it\lambda}$
. The contour levels are the same as in figure 7.

It is depicted in figure 10(b) that at a small distance from the TNTI,
 $y_{I}\approx 4{\it\eta}$
, JPDF extends towards the zone
 $Z4$
in the focal region but it does not have the self-similar shape observed in turbulent regions. Figure 10(c) shows that at the distance of one Taylor scale from the TNTI,
 $y_{I}={\it\lambda}$
, the JPDF demonstrates the self-similar tear-drop shape. It indicates that, in the mixing layer, the invariants of the velocity gradients in turbulent flow (outside of the interface layer) exhibit a similar behaviour as the isotropic turbulence.
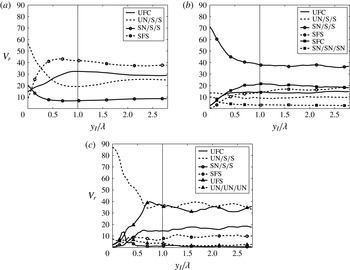
To examine the local flow topology in regions close to the TNTI, the volume ratio of different zones are calculated in interface coordinate system. In order to observe the effect of local compression and expansion, the variation of different topologies for incompressible (
 $P=0$
), compressed (
 $P\geqslant 0.05$
) and expanded (
 $P\leqslant -0.05$
) regions is represented in figure 11. The thresholds for the compressed and expanded regions are chosen such that the points with very small dilatation, which have the similar statistics as the incompressible region, do not affect the results. It is examined that the results presented in this paper are not significantly altered by changing this threshold as long as the threshold is not very small, which results in having many points with incompressible behaviour in compression or expansion regions, or very large, which confines the results to the strong shocklets. This figure indicates that the TNTI affects the local topology of the turbulent flow. It can be seen in figure 11(a) that the probability of different topologies changes significantly in the regions close to the TNTI. At,
 $y_{I}=0$
, the dominant topology is UN/S/S, as it can be inferred from JPDF in figure 10(a). By moving from the TNTI to the inner turbulent flow, the probability of topology SFS is increased. At
 $y_{I}\approx 0.24{\it\lambda}\approx 4{\it\eta}$
, this topology has the same probability as UN/S/S and farther away from TNTI, it becomes the dominant topology in the flow. For
 $y_{I}>{\it\lambda}$
, the probability of different topologies becomes constant and equal to the values reported for
 $P=0$
in figure 8 for the turbulent region.
Variation of the volume ratio occupied by different topological zones in interface coordinates for (a) incompressible, (b) compressed and (c) expanded structures.

Variation of topological zones in an interface coordinate system for locally compressed regions is shown in figure 11(b). It can be seen that in turbulent flow outside of the TNTI thickness,
 $y_{I}>{\it\lambda}$
, the probability of different zones is almost constant and SN/S/S is the dominant topology in the flow, followed by SFC, SFS and UFC zones, respectively. This is consistent with the results shown in figure 8. It should be noted that since regions with
 $P>0.3$
occupy very small volume of the flow, their topological characteristics, i.e. increased probability of SN/SN/SN structures, do not affect the average statistics of the compressed regions represented in figure 11(b). In compression zones, as is observed for incompressible and expansion zones, the probability of focal structures (SFC, SFS and UFC) close to the interface decreases and is almost zero on TNTI, and topologies become non-focal with domination of SN/S/S.
Figure 11(c) shows that the probability of different topologies for the structures under expansion changes near the TNTI. For
 $y_{I}>{\it\lambda}$
inside the turbulent region, the structures with topologies UN/S/S and UFS have the highest probabilities. This is in agreement with the results reported in figure 8 for expanded zones. In regions close to the TNTI,
 $y_{I}<0.5{\it\lambda}$
, the probability of the focal zone UFS decreases and UN/S/S becomes the dominant topology in the flow. It shows that locally expanding structures close to the TNTI, have non-focal topology, similar to the incompressible structures.
Figure 12 represents the distribution of the various flow topologies in turbulent regions. It can be seen that the majority of the structures are focal; however, in the regions close to the TNTI, the non-focal topologies are dominant.
Local flow topology in turbulent regions between TNTIs.

5.3. Relationship between the second invariants
For compressible flows, the dissipation rate of kinetic energy is (Batchelor Reference Batchelor1967)
 $$\begin{eqnarray}{\it\epsilon}=2{\it\nu}\left(\unicode[STIX]{x1D61A}_{ij}\unicode[STIX]{x1D61A}_{ij}-{\textstyle \frac{1}{3}}P^{2}\right)=-4{\it\nu}\left(Q_{S}-{\textstyle \frac{1}{3}}P^{2}\right).\end{eqnarray}$$
It can be shown that the dissipation rate of kinetic energy is proportional to the second invariant of anisotropic part of the strain-rate tensor,
 ${\it\epsilon}=-4{\it\nu}Q_{\unicode[STIX]{x1D61A}^{\ast }}$
, where
 $Q_{\unicode[STIX]{x1D61A}^{\ast }}=-\unicode[STIX]{x1D61A}_{ij}^{\ast }\unicode[STIX]{x1D61A}_{ij}^{\ast }/2$
. Kevlahan, Mahesh & Lee (Reference Kevlahan, Mahesh and Lee1992) introduced three different flow regions based on enstrophy and dissipation: (i) convergence region,
 $Q_{W}<-Q_{\unicode[STIX]{x1D61A}^{\ast }}/2$
, where irrotational straining is high compared with the rotational straining, (ii) shear region,
 $-Q_{\unicode[STIX]{x1D61A}^{\ast }}/2\leqslant Q_{W}\leqslant -2Q_{\unicode[STIX]{x1D61A}^{\ast }}$
, where irrotational and rotational straining are approximately equal, and (iii) eddy region,
 $Q_{W}>-2Q_{\unicode[STIX]{x1D61A}^{\ast }}$
, where rotational straining is high compared with irrotational straining.
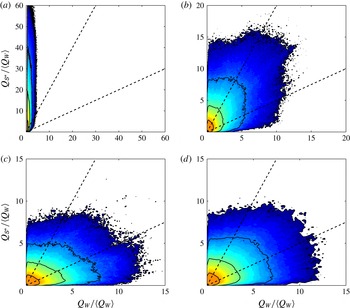
Figure 13 shows JPDFs of
 $Q_{\unicode[STIX]{x1D61A}^{\ast }}$
and
 $Q_{W}$
for several compressibility levels. In this figure, the convergence, shear and eddy regions are separated with broken lines. For the regions with zero dilatation, figure 13(a), the shape of JPDF is similar to the JPDF obtained for incompressible isotropic turbulence (Ooi et al.
Reference Ooi, Martin, Soria and Chong1999). In this region, 19.2 % of the flow volume is in eddy zone, 44.6 % is in shear zone and 36.2 % is in convergence zone. This is in agreement with the results obtained by Pirozzoli & Grasso (Reference Pirozzoli and Grasso2004) for decaying isotropic turbulence with low initial turbulent Mach number (eddy, 21 %; shear, 44 %; convergence, 35 %). In locally compressed regions, figure 13(b,c), as the dilatation level increases, JPDFs skew towards the
 $Q_{W}=0$
axis and the ratio of irrotational to rotational straining is increased. For moderate compression,
 $P=0.1$
, the percentage of eddy, shear and convergence zones are 7.6 %, 29.6 % and 62.8 %, respectively, and for high compression region,
 $P=0.3$
, these percentages are changed to 0.3 %, 5.4 % and 94.3 % indicating the domination of the convergence zone in high compression regions. For moderate expansion, figure 13(d), eddy, shear and convergence zones occupy 22.1 %, 43.9 % and 34.0 % of the flow respectively, close to the values obtained for incompressible region.
JPDFs of
 $Q_{W}$
and
 $Q_{\unicode[STIX]{x1D61A}^{\ast }}$
for four different dilatation levels: (a)
 $P=0.0$
, (b)
 $P=0.1$
, (c)
 $P=0.3$
and (d)
 $P=-0.1$
. The convergence, shear and eddy regions are separated by the broken lines. The contour levels are the same as in figure 7.

5.3.1. Relationship between the second invariants near the TNTI
In order to investigate the relationship between the second invariants in proximity of the TNTI, the JPDFs of (
 $Q_{W},Q_{\unicode[STIX]{x1D61A}^{\ast }}$
) are depicted in figure 14 for incompressible regions for four locations in interface coordinates:
 $y_{I}\approx 0.7{\it\eta}$
,
 $y_{I}\approx 4{\it\eta}$
,
 $y_{I}={\it\lambda}$
and
 $y_{I}=2{\it\lambda}$
. It can be seen in figure 14(a) that at
 $y_{I}\approx 0.7{\it\eta}$
, the JPDF tends to be aligned with
 $Q_{W}=0$
and is located in convergence zone which indicates the dominance of dissipation over the enstrophy on TNTI and regions close to the interface of the order of one Kolmogorov length scale. At
 $y_{I}\approx 4{\it\eta}$
(figure 14
b), since
 $Q_{W}$
starts to increase in interface layer, the JPDF has values in shear and eddy regions, but still a slight domination of strain product over enstrophy can be observed. Figure 14(c) shows that at
 $y_{I}={\it\lambda}$
, the JPDF is skewed towards the
 $Q_{\unicode[STIX]{x1D61A}^{\ast }}=0$
axis. Comparing this JPDF with that in figure 13(a), it can be seen that at
 $y_{I}={\it\lambda}$
the joint probability of (
 $Q_{W},Q_{\unicode[STIX]{x1D61A}^{\ast }}$
) does not have the same shape as that obtained in the turbulent region, contrary to the JPDF of (
 $Q,R$
). However, figure 14(d) shows that by moving deeper inside the turbulent region,
 $y_{I}>2{\it\lambda}$
, this JPDF is less skewed towards the
 $Q_{\unicode[STIX]{x1D61A}^{\ast }}=0$
axis and is more similar to the JPDF found for the turbulent region. The above observation suggests that from
 $y_{I}=0$
to
 $y_{I}={\it\lambda}$
,
 $Q_{W}$
increases with higher rate than
 $Q_{\unicode[STIX]{x1D61A}^{\ast }}$
, such that the behaviour of joint probabilities changes from convergence dominant to eddy dominant. After this point in
 ${\it\lambda}<y_{I}<2{\it\lambda}$
,
 $Q_{\unicode[STIX]{x1D61A}^{\ast }}$
increases with higher rate than
 $Q_{W}$
which makes the joint probabilities skewed towards the
 $Q_{\unicode[STIX]{x1D61A}^{\ast }}=0$
axis. For
 $y_{I}>2{\it\lambda}$
the variation of two invariants is almost the same and JPDF preserves the shape for the turbulent region.
JPDFs of
 $Q_{W}$
and
 $Q_{\unicode[STIX]{x1D61A}^{\ast }}$
for incompressible regions of the flow for four different locations in interface coordinates: (a)
 $y_{I}\approx 0.7{\it\eta}$
, (b)
 $y_{I}\approx 4{\it\eta}$
, (c)
 $y_{I}={\it\lambda}$
and (d)
 $y_{I}=2.5{\it\lambda}$
. The contour levels are the same as the figure 7.

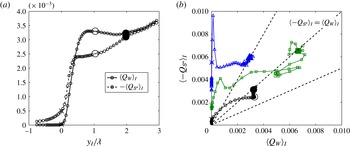
In order to further study the relationship between the second invariants, the trace of average values of
 $Q_{W}$
and
 $Q_{\unicode[STIX]{x1D61A}^{\ast }}$
in interface coordinates are shown in figure 15. For incompressible regions, figure 15(a) shows that
 $\langle Q_{W}\rangle _{I}$
increases more for
 $y_{I}<{\it\lambda}$
compared with
 $\langle Q_{\unicode[STIX]{x1D61A}^{\ast }}\rangle _{I}$
and for
 ${\it\lambda}<y_{I}<2{\it\lambda}$
,
 $\langle Q_{\unicode[STIX]{x1D61A}^{\ast }}\rangle _{I}$
increases at a higher rate until
 $y_{I}>2{\it\lambda}$
, where the values of the two invariants become the same. In figure 15(b) the traces of
 $\langle Q_{W}\rangle _{I}$
and
 $\langle Q_{\unicode[STIX]{x1D61A}^{\ast }}\rangle _{I}$
are depicted for incompressible, compressed and expanded regions in interface coordinates. It can be seen that in both compressed and expanded regions, for
 $y_{I}<{\it\lambda}$
,
 $\langle Q_{W}\rangle _{I}$
increases faster than
 $\langle Q_{\unicode[STIX]{x1D61A}^{\ast }}\rangle _{I}$
and by moving deeper into the turbulent region, both invariants vary with almost a constant rate. It is also observed that for incompressible, compressed and expanded regions, very close to the TNTI, dissipation dominates the enstrophy and the majority of the structures are in convergence zone. However, for
 $y_{I}>{\it\lambda}$
the structures in incompressible and expanded regions tend to be in the shear zone and in locally compressed regions, structures tend to be in the convergence zone.
(a) Average of
 $Q_{W}$
and
 $Q_{\unicode[STIX]{x1D61A}^{\ast }}$
in interface coordinates for incompressible regions. (b) Trace of
 $\langle Q_{W}\rangle _{I}$
and
 $\langle Q_{\unicode[STIX]{x1D61A}^{\ast }}\rangle _{I}$
as moving from the irrotational region to the inner turbulent region for incompressible (○), compressed (▵) and expanded (▫) points. The location of
 $y_{I}=0$
is shown by
 $\times$
. Big symbols and filled big symbols correspond to
 $y_{I}={\it\lambda}$
and
 $y_{I}=2{\it\lambda}$
, respectively. The second invariants are normalized by
 $(U_{1}^{2}/{\it\delta}_{{\it\theta}_{0}}^{2})$
.

5.4. Characteristics of topological zones
In this section some invariant-related features of topological zones (vorticity norm, kinetic energy dissipation and the rate of stretching and contraction) are studied by means of the PDF. In order to find the role of compression and expansion on invariants distribution in each zone, statistics are analysed in three different regions: incompressible (
 $P=0$
), compressed (
 $P\geqslant 0.05$
) and expanded (
 $P\leqslant -0.05$
) regions.
The vorticity norm,
 $|{\it\bf\Omega}|$
, is proportional to the invariant of the rate of rotation tensor,
 $|{\it\bf\Omega}|=(4Q_{W})^{1/2}$
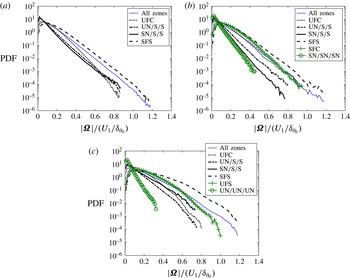
. The PDFs of
 $|{\it\bf\Omega}|$
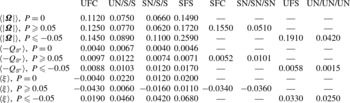
for different topological zones in incompressible, compressed and expanded regions are depicted in figure 16 while the mean values of the PDFs are provided in table 2. The PDF of all of the zones combined is also plotted as a reference for comparison. This figure shows that for all of the regions, the structures with SFS topology have the highest probability of having intense vorticity compared with the other topologies. It can be seen for incompressible regions, figure 16(a), SN/S/S and UN/S/S zones (non-focal zones) tend to have low vorticity magnitude. The PDF of SFS decays at a slower rate compared with the other zones, and for moderate and high values of vorticity, the SFS structures are predominant.
PDFs of vorticity magnitude in different topological zones for (a) incompressible, (b) compressed and (c) expanded regions.

Conditional mean of
 $|{\it\bf\Omega}|$
,
 $-Q_{\unicode[STIX]{x1D61A}^{\ast }}$
, and
 ${\it\xi}$
in different topological zones.

In locally compressed regions, figure 16(b), the non-focal zones (UN/S/S, SN/S/S and SN/SN/SN) have weak vorticity. Considering the mean values and shape of the PDFs, it can be seen that among the focal zones, structures with SFS and SFC topologies, which are stable, have higher vorticity, and extreme values of vorticity correspond to the SFS topology. In locally expanded regions, figure 16(c), as is expected, the non-focal zones (UN/S/S, SN/S/S and UN/UN/UN) have weak vorticity and their PDF decay at a higher rate than other topologies. The focal structures SFS and UFS, have higher values of vorticity and similar to the incompressible and compressed structures, in locally expanded structures the extreme values of vorticity occur in SFS topological zone.
Results shown above suggest that the most probable topology for the structures with intense vorticity in incompressible regions is SFS, in locally compressed regions the most probable topologies are SFS and SFC, and in locally expanded regions the most probable topologies are SFS and UFS. In order to further quantify this result, the structures with intense vorticity are detected and the probability of different topological zones is calculated for them. Jiménez et al. (Reference Jiménez, Wray, Saffman and Rogallo1993) suggested that the structures with intense vorticity in the flow field can be defined as the points with vorticity greater than a specific high threshold. They defined this threshold such that intense vorticity structures cover 1 % of the total fluid volume. These structures are found in the turbulent region and the probability of different topological zones for them is provided in table 3. It can be seen that SFS is the dominant topology for structures with intense vorticity, and for the compressed and expanded regions, SFC and UFS have the second highest probability, respectively.
PDFs of
 $Q_{\unicode[STIX]{x1D61A}^{\ast }}$
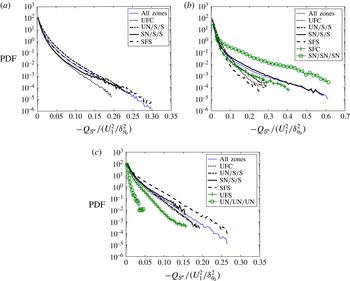
in different topological zones: (a) incompressible, (b) compressed and (c) expanded regions.

The occurrence probability of various flow topologies in structures with intense vorticity.

Figure 17 shows the PDF of
 $-Q_{\unicode[STIX]{x1D61A}^{\ast }}$
, which is related to the rate of dissipation of kinetic energy, for different topologies in incompressible, compressed and expanded regions. The mean values of the PDFs are given in table 2. It can be seen that for the incompressible regions, figure 17(a), the non-focal structures with topology UN/S/S have the highest mechanical dissipation. In locally compressed regions, UN/S/S structures have the highest dissipation on the average. It can be seen in figure 17(b) that these structures have the highest probability among the other topologies for moderate dissipation,
 $-Q_{\unicode[STIX]{x1D61A}^{\ast }}<0.05$
, however, the most probable topologies for the extreme values of dissipation are SN/SN/SN followed by SN/S/S. It is already shown in § 5.2 that these topologies are the dominant topologies in high compression regions, therefore, the extreme values of kinetic energy dissipation in non-focal stable structures, may correspond to shocklets. In locally expanding regions, figure 17(c), the focal structures with SFS topology are the dominant structures for dissipation, unlike the incompressible and compressed regions for which the non-focal structures play the dominant role for dissipation. Also, the extreme values of dissipation mostly occur for SFS structures. It shows that in expanding regions, the extreme kinetic energy dissipation takes place in structures with high enstrophy. This also can be inferred from joint probability distribution between
 $Q_{\unicode[STIX]{x1D61A}^{\ast }}$
and
 $Q_{W}$
in figure 13(d) around the border of the shear and eddy zones where the high enstrophy structures are highly dissipative. These structures also exist in incompressible regions, tail of the PDF in figure 17(a), with less probability.
The rate of vorticity stretching or contraction,
 ${\it\xi}$
, can be explained in terms of the invariants
 $Q_{W}$
,
 $R$
and
 $R_{S}$
as (Ooi et al.
Reference Ooi, Martin, Soria and Chong1999)
 $$\begin{eqnarray}{\it\xi}=\frac{{\it\bf\Omega}_{i}\unicode[STIX]{x1D61A}_{ij}{\it\bf\Omega}_{j}}{{\it\bf\Omega}_{k}{\it\bf\Omega}_{k}}=\frac{R_{S}-R}{Q_{W}}.\end{eqnarray}$$
The PDF of
 ${\it\xi}$
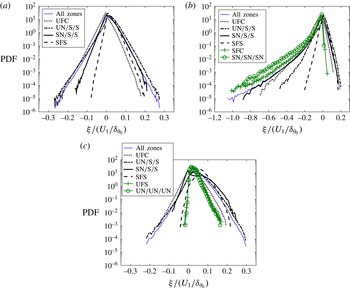
for various local topologies are shown in figure 18. The mean values of the PDFs are provided in table 2. The PDFs and the mean values of
 ${\it\xi}$
show that for the majority of the incompressible points the vorticity vectors are stretched. This is consistent with the results of Ooi et al. (Reference Ooi, Martin, Soria and Chong1999) for incompressible isotropic turbulence. Among the topological zones in incompressible regions, the non-focal structures with UN/S/S topology and focal structures with SFS topology have the maximum vortex stretching rate on the average. It is shown in figure 16 that UN/S/S structures have weak vorticity. This is in agreement with the previous studies (Jiménez et al.
Reference Jiménez, Wray, Saffman and Rogallo1993; Ooi et al.
Reference Ooi, Martin, Soria and Chong1999) showing that the regions with small enstrophy can be associated with high stretching rates.
PDFs of rate of stretching in different topological zones: (a) incompressible, (b) compressed and (c) expanded regions.

Figure 18(b) shows that for the majority of the points in locally compressed regions, vorticity vectors are being contracted. The positive tails of the PDFs for different topologies decay very fast which indicates that the rate of vortex stretching is small in compression regions. However, for the structure with topology SFS, which are undergoing radial contraction and axial stretching (Suman & Girimaji Reference Suman and Girimaji2010), the average of
 ${\it\xi}$
is positive. The UFC structures have the highest contraction rate on the average among the other topological zones. It indicates that in locally compressed regions, the focal structures undergoing compression–expansion in axial–radial directions (UFC) have higher contraction rate than the focal structures with compression in both directions (SFC). The PDFs also suggest that the probability of extreme contractions for topology SN/SN/SN is higher than the others.
It is shown in figure 18(c) that in locally expanding regions, vortex stretching is dominant. The rate of stretching for structures with SFS topology is the highest among the other topologies and UFC structures have the lowest stretching rate. It can also be inferred that in expanding regions, the rate of stretching for the focal structures undergoing expansion–compression in axial–radial directions (SFS) is higher than the rate of stretching for the focal structures with expansion in both directions (UFS).
6. Concluding remarks
DNS of a compressible temporally evolving turbulent mixing layer is performed to characterize the invariants of the velocity gradient tensor and the local flow topology in the flow. The topological and dissipating behaviours of the flow are studied in two different regions: inside the turbulent region, and in proximity of the TNTI, to provide a better understanding of differences in the small-scale motions between the core of turbulence and the regions close to the TNTI in compressible flows.
The flow behaviour is analysed in incompressible, compressed and expanded regions. It is shown that the shape of the JPDF between the second and third invariants of the velocity gradient tensor and the local flow topology in compressible mixing layers are highly dependent on the local dilatation level. In the regions with zero dilatation in compressible mixing layer, the JPDF between the second and third invariants of the velocity gradient tensor has the same characteristic tear-drop shape as that observed in previous numerical and experimental works for incompressible turbulent flows. It is also shown that in these regions, the occurrence probability of different topological zones is similar to the one observed for incompressible isotropic turbulence. In locally compressed regions, the irrotational straining dominates the rotational straining and it becomes more dominant as the level of compression is increased. These regions tend to have stable topology with domination of SN/S/S. In these regions, the second most probable topology in moderate compression is SFC and by increasing the compression level SN/SN/SN becomes the second dominant topology. The locally expanding regions tend to have unstable topologies with domination of UFS and UN/S/S.
It is observed that by crossing the TNTI from the irrotational flow towards the turbulent region, all of the velocity gradient invariants change rapidly. In the regions very close to the TNTI, dissipation dominates the enstrophy and the majority of the structures are in the convergence zone. In turbulent regions and outside of the interface layer, the values of enstrophy and dissipation become approximately equal for locally incompressible and expanded regions. However, in locally compressed regions, the irrotational straining dominates the rotational straining and it becomes more dominant as the level of compression is increased. The distribution of various flow topologies in regions close to the TNTI differs from inside the turbulent region. In proximity of the TNTI, the preeminent topologies are non-focal: UN/S/S in incompressible and expanded regions and SN/S/S in compressed regions. At the distances farther than one Taylor microscale from TNTI,
 $y_{I}>{\it\lambda}$
, the probability of various topologies is almost constant, and is equal to the values obtained for turbulent regions in mixing layer.
The distribution of the vorticity norm, kinetic energy dissipation and the rate of stretching and contraction for various flow topologies are studied. The results show that the structures with intense vorticity are mostly focal undergoing radial contraction and axial expansion (SFS). In the locally compressed or expanded regions, the focal structures with both radial and axial compression (SFC) and the focal structures undergoing expansion in both radial and axial directions (UFS) also contain high amount of vorticity. It is shown that in incompressible and compressed regions, the non-focal UN/S/S structures have the highest rate of mechanical dissipation, however, in locally expanded regions, the focal SFS structures have the maximum dissipation. In locally compressed regions, the focal structures undergoing compression–expansion in axial–radial directions (UFC) have higher contraction rate than the other structures and the rate of stretching for the focal structures undergoing expansion–compression in axial–radial directions (SFS) is higher among the other topological structures.
Acknowledgements
This work is supported by the National Center for Hypersonic Combined Cycle Propulsion sponsored by AFOSR and NASA under Grant FA-9550-09-1-0611, and by donors of the Petroleum Research Fund administrated by the American Chemical Society (ACS) under Grant 51834-ND9. Computational resources are provided by the Center for Computational Research (CCR) at the State University of New York at Buffalo.