1 Introduction
Many works on automatic identification of semantic term similarity exploit distributional similarity, assuming that terms that appear in similar contexts are semantically similar. This has been now an active research area for a couple of decades in which many measures were proposed for detecting lexical similarity (Hindle Reference Hindle1990; Jiang and Conrath Reference Jiang and Conrath1997; Lin Reference Lin1998a; Turney Reference Turney2001; Weeds and Weir Reference Weeds and Weir2003).
While distributional similarity is most prominently modeled by symmetric measures, quite a few semantic similarity relations are directional (asymmetric). For example, most of the ontological (WordNet-style) word-interrelationships, like hyponym/hypernym ({window, building}), and value/attribute ({slow, velocity}) are directional relations.
In addition to ontological relations between words, in many Natural Language Processing (NLP) applications, such as Question Answering (QA), Information Retrieval (IR), Information Extraction (IE), and Text Categorization (TC), it is crucial to recognize whether a specific target meaning can be inferred from a given text. For example, a QA system has to deduce that ‘John bought a boat’ can be inferred from ‘John bought a skiff’ to answer ‘Did John buy a boat?’. As another example, a TC system usually expands a target category with related words. Identifying directional inference relations between terms is often required as part of the inference process in these applications, e.g. that skiff entails boat in the above example. Typically, symmetric distributional similarity measures have been utilized in these applications to identify inferential relations (Jing and Croft Reference Jing and Croft1994; Xu and Croft Reference Xu and Croft1996; Mandala, Tokunaga and Tanaka Reference Mandala, Tokunaga and Tanaka1999; Zazo et al. Reference Zazo, Figuerola, Alonso Berrocal and Rodríguez2005). However, the required lexical relation is directional in nature. For example, an IR user looking for ‘sport events’ will be satisfied with documents about ‘baseball events’, since baseball is a subtype of sport, but not vice versa. Therefore, symmetric similarity measures might be less suitable for identifying inferential relationships.
Despite the evident need of directional similarity measures for lexical inference, their investigation counts, to the best of our knowledge, relatively few works (Dagan, Lee and Pereira Reference Dagan, Lee and Pereira1999; Lee Reference Lee1999; Weeds and Weir Reference Weeds and Weir2003; Geffet and Dagan Reference Geffet and Dagan2005; Bhagat, Pantel and Hovy Reference Bhagat, Pantel and Hovy2007; Szpektor and Dagan Reference Szpektor and Dagan2008; Clarke Reference Clarke2009). So far, existing research in this direction did not penetrate broadly to the common practice in NLP applications, in particular in applied inference, where symmetric association measures, namely LIN (Lin Reference Lin1998a) and cosine, are prominently used. Furthermore, most of these measures were not compared within the same experiment.
This paper aims to investigate the nature of directional similarity measures for applications that require lexical inference. We first conduct a thorough analysis of the behavior of current directional measures. Based on our analysis we identify several properties that directional measures should desirably follow. Since the state-of-the-art measures do not meet all of these properties, we design a novel directional measure that aims to satisfy these properties.
We demonstrate our measure's advantage over state-of-the-art measures in identifying directional similarity, as well as its empirical advantage under two distinct evaluation settings for lexical inference, Automatic Content Extraction (ACE) and Automatic Text Categorization (ATC). Our carefully designed measure significantly outperformed all other tested measures. In a broader prospect, we suggest that asymmetric measures might be more suitable than symmetric ones for many other settings as well.Footnote 1
2 Background
This section presents the background material necessary to understand the contributions of this paper in the area of directional distributional similarity. First, the Textual Entailment (TE) framework is presented, introducing lexical entailment, a prominent type of lexical inference utilized by many NLP applications.
Following, we describe related work on distributional similarity between terms. The distributional term similarity scheme follows two steps. First, a feature vector is constructed for each term by collecting context words as features. Each feature is assigned a weight indicating its ‘relevance’ to the given term. Then, term vectors are compared by some vector similarity measure. The main difference between symmetric and directional similarity measures lies in the manner in which the two vectors are compared. This step is the focus of our paper. We present an overview of both symmetric and directional state-of-the-art similarity measures along with the motivations behind their design.
Finally, we briefly describe an alternative approach, which suggests extracting similarities from the existing lexical resources created by humans.
2.1 Textual Entailment
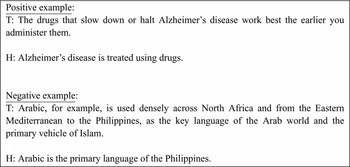
The applied inference required by many NLP applications, such as QA, IE and IR, may be addressed by the generic Textual Entailment paradigm (Dagan, Glickman and Magnini Reference Dagan, Glickman, Magnini, Quiñonero-Candela, Dagan, Magnini and d'Alché-Buc2006). The essence of the TE framework is a directional relation between two texts, termed text and hypothesis. The TE relation between a text t and a hypothesis h, denoted t → h, holds if a human reading the text would infer that the hypothesis is most likely true. An example for an entailing and a nonentailing text–hypothesis pairs is presented in Figure 1. Some recent papers showed that utilizing TE engines improves the performance of NLP systems (Harabagiu and Hickl Reference Harabagiu and Hickl2006; Harabagiu, Hickl and Lacatusu Reference Harabagiu, Hickl and Lacatusu2007; Lloret et al. Reference Lloret, Ferra'ndez, Munoz, Palomar, Sharp and Zock2008; Mirkin, Dagan and Shnarch Reference Mirkin, Dagan and Shnarch2009).
An example of a positive (entailing) text–hypothesis pair and a negative (nonentailing) pair, taken from the RTE-2 development dataset (Bar-Haim et al. Reference Bar-Haim, Dagan, Dolan, Ferro, Giampiccolo, Magnini and Szpektor2006).

Textual Entailment engines require knowledge resources for identifying entailment relationships between texts. One prominent type of knowledge representation needed for such inference is lexical entailment rules. A lexical entailment rule is a directional relation, ‘entailing-term → entailed-term’, between an entailing term (a.k.a left-hand side or LHS) and an entailed term (a.k.a right-hand side or RHS). A rule is considered correct if the meaning of the RHS term is implied from the meaning of the LHS term. Some rule examples are ‘chess → game’, ‘divorce → marriage’ and ‘government → state’. We note that synonyms and other symmetric inference relations may be viewed as bidirectional entailment rules, e.g. ‘car ↔ automobile’ and ‘buy ↔ purchase’.
2.2 Symmetric distributional similarity measures
To date, most distributional similarity research concentrated on symmetric measures. Most of these measures assess the relative amount of features common between the two vectors compared to the whole set of features within these vectors. Typical examples are the cosine measure (Salton and McGill Reference Salton and 1983; Ruge Reference Ruge1992; Caraballo Reference Caraballo1999; Gauch, Wang and Rachakonda Reference Gauch, Wang and Rachakonda1999; Pantel and Ravichandran Reference Pantel and Ravichandran2004) and Jaccard's coefficient (Gasperin et al. Reference Gasperin, Gamallo, Agustini, Lopes and Lima2001). Another such common symmetric measure is the widely cited and competitive (as shown in Weeds and Weir Reference Weeds and Weir2003) LIN measure (Lin Reference Lin1998a), defined as

where F x is the feature vector of a term x, w x(f) is the weight of the feature f in that term's vector, set to their pointwise mutual information (pmi) (Church and Hanks Reference Church and Hanks1990) and F u ∩ F v is a set of features that are common for the two vectors F u and F v.
In a different approach, Dagan et al. (Reference Dagan, Lee and Pereira1999) proposed to adopt the Jensen–Shannon divergence (JS) measure for feature vector similarity. Viewing each feature vector F as defining a probability distribution over the feature space, JS is the average of the Kullback–Leibler divergence (KL-divergence) of each of the two distributions to their average distribution:

2.3 Directional distributional similarity measures
Few works investigated a directional similarity approach for relations that capture some notion of lexical inference (e.g. lexical entailment). To present these measures, we adopt a ‘semantic expansion’ terminology, in analogy to a typical lexical expansion setting: given a pair of similar terms, we say that a term with a narrower common subcontext expands a related term with a broader common subcontext. For example, ‘baseball’ expands ‘sports’, but not necessarily vice versa, since typical baseball contexts are also sports contexts. In this paper, we refer to the term with a narrower subcontext as a narrower term and to the term with a broader subcontext as a broader term. We also denote the relation between a narrower term u and a broader term v by ‘u ≲ v’.
Lee (Reference Lee1999) investigated distributional similarity measures for improving likelihood estimation of unseen co-occurrences and noticed that substitutability of one term for another is not symmetric. To address this asymmetry, Lee (Reference Lee1999) proposed the α-skew divergence as a directional similarity measure based on KL-divergence. This measure was adopted from information theory, similarly to the JS measure. However, α-skew is directional, calculating the distance to the feature distribution of a narrower term u from the distribution of the broader term v:

α lies in the range of [0,1] and serves as a smoothing parameter. The best reported results were achieved for α = 0.99. We note that this measure is an approximation of the KL-divergence measure, which is itself directional, but is undefined for features present only in the first of the two vectors, but not in the second, and thus is not applicable without smoothing. The α-skew measure was shown to outperform all other symmetric measures that were examined in that study, as well as the KL-divergence measure itself applied to smoothed feature vectors as proposed by Chen and Goodman (Reference Chen and Goodman1996). As stated in Roberts (Reference Roberts and Chater2008), the α-skew measure naturally embodies the asymmetry of similarity argued by Tversky (Reference Tversky1977) in his work on psychological distance.
As a directional measure analogous to the symmetric LIN measure, the Precision measure, denoted here WeedsPrec, was proposed for identifying the hyponymy relation and other generalization/specification relations (Weeds and Weir Reference Weeds and Weir2003; Weeds, Weir and McCarthy Reference Weeds, Weir and McCarthy2004). WeedsPrec quantifies the weighted coverage (or inclusion) of the features of the candidate narrower term u by the features of the broader term v:

The assumption behind WeedsPrec is that if one term is indeed a generalization of the other then the features of the more specific term are likely to be included in those of the more general one (but not necessarily vice versa).
Geffet and Dagan (Reference Geffet and Dagan2005) extended the rationale of Weeds et al. (Reference Weeds, Weir and McCarthy2004) to the lexical entailment setting. They defined a lexical entailment relation in which the meaning of the broader term should be directly implied or entailed from the meaning of the narrower one. In this framework it is expected that if the meaning of a term u entails that of v, then all its prominent context features (under a certain notion of ‘prominence’) would be included in the feature vector of v as well. This approach is denoted here as feature inclusion. Their web-based experiments revealed a strong empirical correlation between such complete inclusion of prominent features and lexical entailment. Yet, such complete inclusion cannot be feasibly assessed using an off-line corpus, due to the huge amount of data needed to overcome the sparseness of word-feature co-occurrences.
Recently, Szpektor and Dagan (Reference Szpektor and Dagan2008) tried to identify the entailment relation between predicative lexical–syntactic templates using the WeedsPrec measure, but observed that it tends to promote unreliable relations involving infrequent entailing (narrower) templates. To remedy this, they proposed to balance the directional WeedsPrec measure by geometrically averaging it with the symmetric LIN measure, a measure denoted here as balPrec:

Effectively, this measure penalizes narrower templates having short feature vectors (vectors with relatively few features), as those usually yield low symmetric similarity with the longer vectors of more common templates.
Another work on lexical–syntactic templates (Bhagat et al. Reference Bhagat, Pantel and Hovy2007) suggested the learning directionality of inference rules (LEDIR) algorithm for defining the direction of valid similarities created by a symmetric measure. Given two semantically similar templates u and v, LEDIR measures the ratio between the number of features of u and v and applies a threshold to define the similarity direction. The underlying assumption is that if v occurs in significantly more contexts than u, then v most likely has a broader meaning. This assumption seems to conform with the idea of feature inclusion, yet Szpektor and Dagan (Reference Szpektor and Dagan2008) show that filtering with the directional LEDIR did not improve the performance of the original symmetric discovery of inference rules from text (DIRT) resource (Lin and Pantel Reference Lin and Pantel2001) in their evaluation. In addition, LEDIR learns thresholds using supervised techniques and thus cannot be considered completely unsupervised.
In a recent work of Clarke (Reference Clarke2009) the degree of entailment measure, denoted here as ClarkeDE, was proposed:

It quantifies weighted coverage of the features of the candidate narrower term u by the features of the broader term v and thus resembles the WeedsPrec measure.
Finally, we note that lexical similarity is not the only task in need of asymmetric approaches. Human word associations are asymmetric as well (Tversky Reference Tversky1977; Michelbacher, Evert and Schutze Reference Michelbacher, Evert and Schutze2007). For example, when hearing the word ‘mango’, ‘fruit’ is one of the first associations that come to mind. But when hearing ‘fruit’, we are more likely to come up with common fruits like ‘apple’ or ‘orange’ rather than the less frequent ‘mango’. We also note that research on directionality is not limited to developing directional similarity measures. Significant contributions were proposed in encoding directionality into the feature vectors in the past few years, including the holographic model (Jones and Mewhort Reference Jones and Mewhort2007) and permutation-based approaches (Sahlgren, Holst and Kanerva Reference Sahlgren, Holst and Kanerva2008). These approaches are beyond the scope of this paper and typically employ the symmetric cosine similarity between the vectors.
2.4 Extracting similarities from existing lexical resources
A different approach for lexical similarity proposes to utilize the existing knowledge resources, e.g. thesauri, semantic networks, taxonomies, or encyclopedias, instead of relying on distributional properties of words. The resource used is viewed as a network or directed graph and then terms are considered similar or dissimilar based on properties of paths in this graph.
The most prominently used measures of this kind utilize WordNet (Fellbaum Reference Fellbaum1998), a broad coverage lexical network of English words, organized into synonym sets (synsets). Synsets are connected with each other by variety of lexical relations, such as synonymy, antonymy, and hyponymy. Since in this paper we focus on the distributional approach, we do not go beyond listing several popular WordNet-based measures, implemented within the WordNet::Similarity package (Pedersen, Patwardhan and Michelizzi Reference Pedersen, Patwardhan and Michelizzi2004). This open source package is becoming very popular in different NLP fields and implements amongst others the following competitive measures: Lch by Leacock and Chodorow (Reference Leacock and Chodorow1998), Lesk by Banerjee and Pedersen (Reference Banerjee and Ted2002), Lin by Lin (Reference Lin1998c), Path by Pedersen et al. (Reference Pedersen, Patwardhan and Michelizzi2004), Res by Resnik (Reference Resnik1995), Vector by Patwardhan (Reference Patwardhan2003), Wup by Wu and Palmer (Reference Wu and Palmer1994), and Jcn by Jiang and Conrath (Reference Jiang and Conrath1997).
An overview of the existing measures can be found in Budanitsky and Hirst (Reference Budanitsky and Hirst2006). We note that, as argued in Budanitsky and Hirst (Reference Budanitsky and Hirst2006), all measures of this kind are symmetric.
3 Empirical observations and motivations
With lexical inference in mind, our research goal is to develop a directional similarity measure suitable for identifying asymmetric relations between narrower and broader terms. In the previous section, we surveyed several directional measures that were proposed for a variety of NLP tasks, such as language modeling, learning hyponymy, and entailment recognition. A common behavior is evident for most of these measures: they are based on feature inclusion. In some cases, the feature vectors of the related terms can mutually include each other to some extent, but usually the inclusion is stronger in one direction.
Aiming to quantify most effectively the above notion of feature inclusion, we performed a preliminary analysis of available annotated positive and negative examples for narrower-broader similarity relationships. The purpose of this examination was to identify statistical traits that can be used to distinguish the valid word pairs from the invalid ones. In this section, we summarize the findings of the analysis, which underlie the design of our proposed similarity measure described next in Section 4.
For a candidate pair ‘u ≲ v’ we will refer to the set of features of the narrower term u, which are those tested for inclusion, as tested features. Amongst these features, those found in the feature vector of the broader term v are denoted included features.
As can be seen from the formulae presented in Section 2, existing statistical inclusion measures aim to capture certain aspects of feature inclusion. The WeedsPrec measure attempts to: (i) reflect the proportion of included features amongst the tested ones (the core inclusion idea) and (ii) assign greater importance to included features which have higher weights within the vector of the narrower term. In addition, the balPrec measure penalizes unreliable pairs containing infrequent narrower terms. The ClarkeDE measure is similar to WeedsPrec, but it reduces the weight of included features if they have lower weight within the vector of the broader term.
In our preliminary analysis we aimed to
• verify the necessity of the aforesaid aspects in quantifying feature inclusion;
• detect additional properties that an inclusion measure should posess.
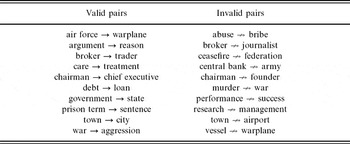
To that end we used an available manually annotated collection of valid and invalid lexical entailments (Zhitomirsky-Geffet and Dagan Reference Zhitomirsky-Geffet and Dagan2009), which contains 1067 valid and 2705 invalid directional pairs, produced by the LIN similarity measure for two different feature weighting schemes. Examples of valid and invalid pairs from this dataset are presented in Table 1. The entailed (right-hand side) term is the broader term having broader contexts than the narrower entailing (left-hand side) term. We note that lexical entailment subsumes most of the WordNet-style relationships between narrower and broader terms, as well as other directional relationships. We thus assumed that examining positive and negative examples for lexical entailment pairs would yield indicative observations relevant for most types of directional similarity for lexical inference.
Examples of valid and invalid entailment pairs analyzed for feature inclusion

We analyzed the feature vectors of the terms participating in a sample of this dataset. These vectors were created by parsing the Reuters RCV1 corpus using the Minipar dependency parser (Lin Reference Lin1998b) and taking as features the words related to each term through a dependency relation. Each feature was weighted by its pmi with the term.
A thorough examination of this data led us to hypothesize the following desired properties for a distributional inclusion measure, further referred as the desired properties. We thus hypothesize that a directional similarity measure should reflect:
(1) the relevance of included features to the narrower term
(2) the relevance of included features to the broader term
(3) that inclusion detection is less reliable if the number of features of either the narrower or the broader term is small
We note that all prior measures addressed the first property, while the second property was in some way addressed only by the ClarkeDE measure and the third property was addressed by the balPrec measure only regarding the narrower term. We next explain the rationale behind each of these properties and illustrate them using the analyzed data.
3.1 The relevance of included features to the narrower term
The features within each vector constitute a ranked list according to their weights. It is presumed that features at higher ranks are more important from the perspective of inclusion reliability. For example, inclusion of ten features from the highest ranking tested features (top features) is supposed to be of more importance compared to inclusion of ten features scattered along the tail of the feature list.
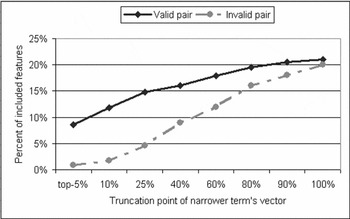
Indeed, the inclusion of top features of the narrower term was found in our analysis to be more meaningful than inclusion of lower-ranked features. As expected from using pmi as weight, many features at lower ranks are common features in the language that co-occur with many terms and are less indicative specifically for the narrower term. When taking these features into account, the feature inclusion ratios for valid and invalid pairs are becoming similar, making it harder to identify valid pairs. An example of this behavior, which was common to all sampled pairs, is illustrated in Figure 2. As can be seen, when only top features (up to top 30 per cent) of the narrower term are tested for inclusion, the ability to distinguish between valid and invalid pairs is much better, as shown by the larger gap between the inclusion ratios for a valid and an invalid pair.
A typical example of the influence of the tested features according to their rank in the vector of the narrower term. The graph presents the valid pair ‘election → vote’ compared to the invalid pair ‘election ↛ reform’. The x-axis shows different top-n per cents of narrower term's features tested for inclusion; the y-axis shows the corresponding percentage of included features.

An additional observation derived from our analysis is that it is preferable to estimate the importance of each included feature based on its rank in the narrower term's vector instead of its pmi weight, as was done in previous works. We observed that pmi-based feature weights demonstrate rather inconsistent behaviors. For example, two highly relevant features, with consecutive ranks, might have very different pmi weights; on the other hand, indicative and nonindicative features that have quite different ranks might have rather similar pmi scores. Moreover, features placed at the same ranks in different vectors typically have considerably different weights, making similarity scores for different pairs incomparable.
Thus, relying on feature weights (as in ClarkeDE, WeedsPrec and balPrec) might yield the following undesired effects:
• Accumulative contribution to the similarity score of many low-ranked, and hence nonindicative, included features might exceed the contribution of fewer but more indicative high-ranked features, thus affecting the ability of the measure to distinguish between valid and invalid pairs.
• Two pairs with exactly the same number of included features placed at exactly the same ranks could receive rather different similarity scores.
In our analysis we did not have a way to measure some quantitative difference between the two approaches, but a qualitative impression indicated that relying on ranking instead of absolute weight score is more stable. We thus expect that considering feature ranks of the narrower term, rather than absolute feature weights, may improve the performance of an inclusion measure. Furthermore, working with ranks is methodologically preferable as it makes the resulting measure applicable for feature vectors created by different feature weighting schemes.
3.2 The relevance of included features to the broader term
We next look at the features of the broader term. In analogy to the narrower term behavior discussed above, we expect to find a correlation between the relevance of the included features to the broader term and the validity of the directional similarity for the tested pair.
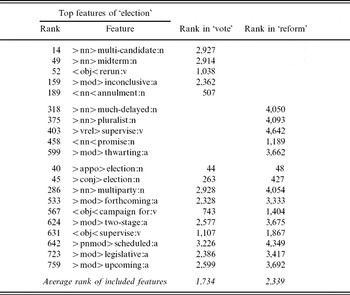
This expectation was confirmed by the analyzed data. We observed that ranks of the included features inside the vector of the broader term were usually consistently lower for invalid pairs than for valid ones. A typical example of such behavior is presented in Table 2. The table presents top features of the word ‘election’ that were included in the vectors of either the word ‘vote’ (a valid case), or the word ‘reform’ (an invalid case), or both. From the table we see that
• the features included only for the word ‘vote’ are ranked higher than the features included only for the word ‘reform’;
• the features that are included for both words are positioned higher in the vector of ‘vote’ as well.
This tendency remains the same for all the included features of the narrower term. We note that this distinctive behavior was observed for feature ranks but could not be observed for the inconsistent pmi feature weights, thus confirming the conclusion made in Section 3.1 of the advantage in considering feature ranks rather than pmi weights.
Comparison between the feature ranks inside the broader term's vector for the valid pair ‘election → vote’ and the invalid pair ‘election ↛ reform’. The upper part shows the top five features of ‘election’ that were included only in the vector of ‘vote’; the middle part shows the top 5 features of ‘election’ that were included only in the vector of ‘reform’; the lower part shows the top 10 features of ‘election’ that were included in both word vectors. The symbols ‘>. . .>’ and ‘<. . .<’ indicate the direction of the dependency relation between the term and a feature

We thus conclude that taking the position of included features in the broader term vector into account may improve the ability of an inclusion measure to identify valid similarity pairs.
3.3 Lower reliability of inclusion detection for short feature vectors
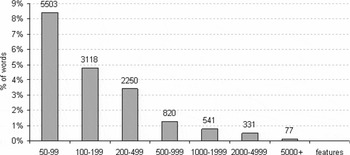
Short vectors, that is, vectors containing relatively few features, are typical for infrequent words in a corpus. With so few occurrences it is hard to collect meaningful statistics about their contexts. Short vectors constitute the majority of vectors in our database (see Figure 3), as expected from the Zipfian distribution of words. We examined about a hundred of such vectors and saw that most of their features are rather common words, which are not good indicators for a specific term meaning. For example, the vector of the term ‘birthweight’ counts only twenty-eight features, where the top features relate to quite general words like ‘face:n’ and ‘type:n’.
Distribution of vector lengths for the terms in the analyzed corpus. The diagram shows the number of feature vectors of different lengths out of 12,640 vectors that have more than 50 features each, which makes up 19.3 per cent of all the vectors in our database. Vectors shorter than 50 features constitute the other 80.7 per cent (52,895 vectors).

Another reason of lower reliability of infrequent narrower terms for inclusion testing is that inclusion-based measures calculate the proportion between the number of included features and the number of tested ones. Thus, if the number of features in the vector of a narrower term is relatively small, it becomes relatively easy to cover most of them and get a high inclusion rate. Consequently, some arbitrary terms with short feature vectors are likely to have higher inclusion rates in general than similar terms having longer vectors.
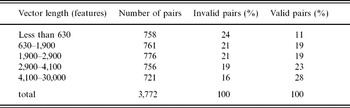
In a similar manner, the number of included features is limited by the number of the features of the candidate broader term. When a candidate broader term has a short vector, candidate narrower terms with longer vectors cannot yield high inclusion ratios, while some (often arbitrary) terms with shorter vectors might get promoted. We thus expect inclusion detection to be less reliable for broader terms with short vectors. Table 3 presents an analysis of this expected behavior on our entailment pairs collection. The table shows that the longer the vector of a broader term is, the lower is the number of invalid pairs extracted for this term, and vice versa.
Distribution of 1,067 valid and 2,705 invalid pairs in the entailment-annotated set according to the number of features in vectors of the candidate broader terms

Overall, our analysis of valid and invalid pairs reaffirmed our hypothesis that short vectors, both for narrower and broader terms, seem to be unreliable for detecting valid similarity pairs based on feature inclusion. It confirms the well-known fact that data sparseness is a problem when dealing with statistical measures. We note, however, that this issue is not addressed by standard distributional similarity measures, such as LIN, cosin, etc., widely used in the common practice. We also note that ignoring this problem is, in our opinion, the main reason of the LEDIR algorithm's failure, since more frequent terms have more features (contexts), but they do not necessarily have a broader meaning.
4 A proposed inclusion measure
As identified in Section 4, a directional similarity measure based on feature inclusion should desirably satisfy several properties when measuring the degree of feature inclusion:
(1) Promoting the similarity scores if included features are highly relevant for the narrower term; the estimation of feature relevance may be better based on feature ranks rather than on feature weights.
(2) Promoting the similarity scores when included features are placed higher in the vector of the broader term as well.
(3) Demoting similarities for short feature vectors.
As a starting point for designing our new directional measure for lexical inference, we suggest utilizing a common IR evaluation method, namely Average Precision (AP), adapted to our problem. The rest of the section is organized as follows: first, we discuss the AP evaluation method and its applicability to our problem, then we introduce several adaptations for this method, resulting in our new proposed similarity measure.
In IR evaluation the task is to compare different retrieval systems: given a query, each system returns a list of documents, ranked according to their relevance to the query. A good system should thus:
• Retrieve many relevant documents (high recall).
• Retrieve as few irrelevant documents as possible (high precision).
• Place relevant documents at the top of the ranked list (high relevance).
The common IR measure that captures these properties is the Average Precision (AP) metric (Voorhees and Harman Reference Voorhees and Harman1999):

where r is the rank of a retrieved document amongst the N retrieved, rel(r) is an indicator function for the relevance of that document, and P(r) is precision at the given cut-off rank r. Thus, AP combines precision, relevance ranking and overall recall.
We adapted AP for measuring lexical similarity. In our case the features of the broader term are analogous to the set of all relevant documents, while the tested features correspond to retrieved documents. Included features thus correspond to relevant retrieved documents, yielding the following measure under our terminology:
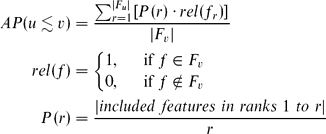
where F x is a feature vector of term x and f r is the feature at rank r in F u.
This new intermediate feature inclusion measure partly addresses our desired properties. Its score increases with a larger number of included features (the core inclusion principle), while giving higher weight to highly ranked features of the narrower term (1st desired property).
To further meet the desired properties, we introduce two modifications to the above measure. First, we use the number of tested features |F u| for normalization instead of |F v|. This captures better the notion of feature inclusion, which targets the proportion of included features relative to the tested ones.
Second, in the classical AP formula all relevant documents are of the same relevance to the input query. However, as suggested by our 2nd desired property, higher-ranking features of the broader term should have bigger influence on the final measure score. We thus reformulate rel(f) to reflect the feature rank in a simple linear manner:

where rank(f, F v) is the rank of f in F v.rel′(f) provides a real number in the range (0, 1) for relevance estimation, with higher values for higher ranking features. This modification also leads to some demotion of broader terms with short feature vectors, thus addressing also our third desired property: the ratio rank(f, F v)/(|F v|+1) will be higher for smaller denominators, thereby decreasing the value of rel′(f) for all included features, even when they are ranked highly in the vector.
Incorporating our two modifications yields the APinc measure:

Finally, we adopt the balancing approach in (Szpektor and Dagan Reference Szpektor and Dagan2008) to yield our proposed directional measure balAPinc:

As explained in Section 2, balancing penalizes similarities containing infrequent narrower terms. Hence, balAPinc addresses also the third inclusion measure property. We note that balancing actually penalizes infrequent broader terms as well, since the LIN measure is symmetric and yields lower scores if one of the two compared terms has a short vector. We note, however, that this approach does not demote similarities when both the narrower term and the broader term vectors are short.
5 Evaluation and results
In this section we present experiments for evaluating our novel directional measure, comparing it to state-of-the-art measures. We first evaluate the ability of the various measures to detect the direction of similarity relation between candidate word pairs. We then perform application-based evaluations for the tested measures.
5.1 Learning corpus
In all of our distributional similarity measure implementations we use feature vectors created by parsing the Reuters RCV1 corpus with Minipar and taking the words related to each term through a dependency relation as its features (coupled with the relation name and the corresponding feature role as head or modifier, as in Lin Reference Lin1998a).Footnote 2 We considered only terms that occur at least ten times in the corpus, and as features only words that occur at least twice.
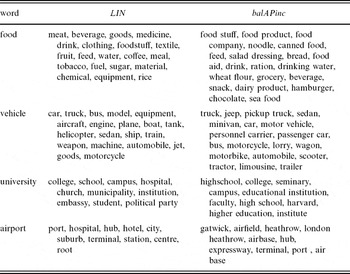
In Table 4, anticipating the subsequent quantitative evaluation, we present top similarities extracted by the LIN and balAPinc measures for several common words, taken as the broader terms for balAPinc. The table shows that the directional balAPinc generates more accurate similarity lists than the symmetric LIN measure.
Top similarities learned by LIN and balAPinc for exemplary common words

5.2 Detecting similarity direction
In our first evaluation, we would like to directly compare between the ability of various similarity measures to detect the direction of the similarity relation between candidate word pairs. To this end we used the same manually annotated collection of valid and invalid lexical entailments (Zhitomirsky-Geffet and Dagan Reference Zhitomirsky-Geffet and Dagan2009), which was used in our preliminary analysis in Section 3. The collection was generated by manually judging a sample of 1,886 term pairs, which were produced by the symmetric distributional similarity measure of LIN. Each pair was assessed in both directions for lexical entailment, resulting in 1,067 valid and 2,705 invalid directional pairs.
5.2.1 Evaluation setting
To compare between different similarity measures, we provided the above pair collection as input to each measure. For each pair {u, v}, two candidate directional pairs were provided as input: ‘u → v’ and ‘v → u’. Each measure provided a score for each candidate directional pair, quantifying its belief that the pair is valid. For each measure we then sorted the directional pairs by their scores and assessed the quality of the ordered list by calculating its Average Precision score, based on the gold-standard annotation.
As explained in Section 4, Average Precision (AP) combines precision, relevance ranking and overall recall. Thus, the AP score will be higher for measures that identify many valid rules by giving them a relatively high similarity score.
5.2.2 Results for distributional similarity measures
We evaluated our proposed balAPinc similarity measure as well as the following distributional similarity measures: LIN, Skew divergence with α = 0.99 (0.99-skew), Jensen-Shannon divergence (JS), WeedsPrecision (WeedsPrec), balPrecision (balPrec) and degree of entailment (ClarkeDE) (see Section 2).
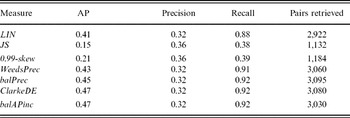
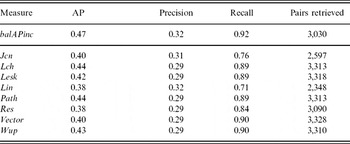
To obtain a clearer picture, in addition to the AP score we report the number of directional pairs retrieved by each of the measures as at least slightly similar (being included in the top 1,000 similarities), and the corresponding precision and recall values. Table 5 presents the results for the tested measures.
Results of the tested distributional measures on the directionality detection experiment

From the table we see that, overall, directional inclusion-based measures show better performance than symmetric ones (LIN and JS). In addition, our novel balAPinc measure outperforms all of the symmetric and directional baselines, excluding the ClarkeDE measure, which shows identical performance. The improvement over all other measures is statistically significant according to the two-sided Wilcoxon signed-rank test at the 0.01 level (Wilcoxon Reference Wilcoxon1945).Footnote 3
We note that the ClarkeDE and balAPinc measures are the only measures that comply with the second desired property presented in Section 3. Moreover, complying with this property is the only difference between the ClarkeDE measure and the WeedsPrec measure, which performs significantly worse.
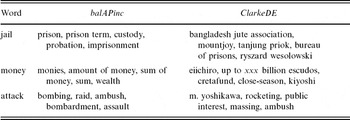
We also note that in this experiment similarity measures were used to grade pre-given term pairs that were already found sufficiently similar by the symmetric measure of LIN. As explained earlier in Sections 2 and 4, this measure promotes pairs with rather common terms and demotes those with infrequent terms. Thus, in this evaluation the influence of reflecting the third desired property, which suggests to demote similarities of short feature vectors, cannot be adequately shown. We note that the third property is addressed by the balAPinc measure and is not addressed by the ClarkeDE measure. To illustrate the importance of following this property, Table 6 presents the top five similarities produced by the two measures for exemplary common words. From the table we see that, unlike balAPinc, the ClarkeDE measure gives high scores to many incorrect similarities with infrequent terms. As will be shown later in our application-based evaluations, the ClarkeDE measure performs quite poorly when applied independently (rather than on the output of the LIN measure).
Top similarities learned by balAPinc and ClarkeDE for exemplary common words

We conclude thus, that in this evaluation we showed the validity of the inclusion-based approach and our identified desired properties for recognizing directionality of the distributional similarity relation, as well as the advantage of our novel balAPinc measure, designed according to all of these properties.
5.2.3 Results for wordNet-based measures
We also compared our balAPinc measure to state-of-the-art WordNet-based measures, using their implementations from the WordNet::Similarity package (see Section 2.4). In Table 7 we report the results of the WordNet-based measures. The results for balAPinc are shown for comparison.
Results of the balAPinc measure and the tested WordNet measures on the directionality detection experiment

The table shows that the results provided by the WordNet-based measures are lower than those of balAPinc under all evaluation metrics. In terms of the AP score, the advantage of balAPinc over the Jcn, Lin, Res, and Vector measures is statistically significant. Thus, we may conclude that our proposed distributional measure performs not worse and sometimes even better than state-of-the-art WordNet-based measures, not only in terms of relevance ranking (AP), but also when directly measuring recall and precision. This is an interesting result, since distributional measures are typically known to yield high recall while having low precision, while WordNet-based similarities are considered precise, but suffering from insufficient recall (Mirkin et al. Reference Mirkin, Specia, Cancedda, Dagan, Dymetman and Szpektor2009).
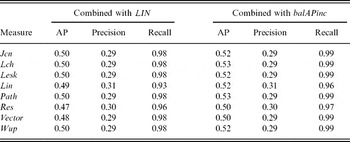
In recent research, Agirre et al. (Reference Agirre, Enrique, Keith, Jana, Marius and Aitor2009) showed that combination with symmetric distributional similarity improves the performance of WordNet-based methods. In a further evaluation we checked whether this conclusion can be confirmed for our proposed directional measure as well. For this purpose we combined the output of either balAPinc or the symmetric LIN measure with each of the WordNet-based methods.
We combined the output of any two measures by first ranking the pairs based on each measure alone. Then, each pair was re-ranked according to its average rank in the two lists. If a pair was not present in one of the lists, it was treated as if placed at the end of that list. We chose to combine pairs based on ranks rather than scores because many WordNet-based measures assign unnormalized scores, which are not comparable to distributional similarity scores. Table 8 summarizes the results of this evaluation.
Results of combining the balAPinc measure and the LIN measure with each of the tested WordNet measures on the directionality detection experiment

As can be seen from the table, combining distributional similarity with WordNet-based measures yielded considerably better results than any of the two measures alone. These results are statistically significant compared to each of the combined measures alone. The considerable improvement in recall is achieved without any significant drop in precision. This shows that distributional and WordNet-based measures are complementary. We also note that combining WordNet measures with the directional balAPinc consistently outperforms combining them with LIN in terms of Average Precision.
5.3 Manual vs. application-based evaluation
The results presented in the above evaluation show that balAPinc, which is designed to follow all the desired properties presented in Sections 3 and 4, achieves best performance in detecting directional similarity. In addition, the performance improvement achieved when combining balAPinc with WordNet-based measures is higher than when combining a symmetric measure with WordNet-based measures.
Still, such evaluation does not fully reflect the quality of the tested similarity measures. The actual utility of a lexical semantic resource can be measured best in an instance-based evaluation, examining the correctness of applying similarity pairs for lexical inference instead of directly assessing their correctness (Szpektor, Shnarch and Dagan Reference Szpektor, Shnarch and Dagan2007; Mirkin et al. Reference Mirkin, Specia, Cancedda, Dagan, Dymetman and Szpektor2009). Hence, we perform additional application-based evaluations of distributional measures, choosing our evaluation framework to be lexical-expansion. Lexical expansion is widely employed to overcome lexical variability in applications like IR, IE, and QA (e.g. Xu and Croft Reference Xu and Croft1996; Mandala et al. Reference Mandala, Tokunaga and Tanaka1999) and it is one of the prominent utilizations of distributional similarity for lexical inference. The expansion task is to augment a given textual input (e.g. a query) with expansion terms, terms of meanings similar to the input terms, which are produced in our case by the distributional similarity measures.
We tested lexical expansion within two different application settings – ACE and Unsupervised keyword-based TC. In the following subsections we describe each of these two evaluations. We underline that in both evaluations the applications are used as a comparative tool to evaluate the quality of the measures; the results are not claimed to be in any way optimal for the given task, since we were not employing an optimal comprehensive system for each application.
5.4 Evaluation within ACE
5.4.1 Evaluation setting
As a typical lexical expansion task we used the ACE 2005 events dataset.Footnote 4 This standard IE dataset contains thirty-three event types, such as Attack, Divorce and Law Suit, with all event mentions annotated in the corpus. It was previously successfully utilized for evaluating distributional similarity methods for recognizing lexical–syntactic entailment relations (Szpektor and Dagan Reference Szpektor and Dagan2008; Szpektor et al. Reference Szpektor, Dagan, Bar-Haim and Goldberger2008; Szpektor and Dagan Reference Szpektor and Dagan2009). For our lexical expansion evaluation we considered the first IE subtask: finding sentences that contain mentions of a target event.
For each event we manually selected a few typical terms for the event, denoted seeds. These terms (four on average) were selected from the textual description of the event definition in the ACE guidelines. The seeds serve as a baseline query for retrieving sentences containing the event occurrences. For example, the words ‘meet:n’, ‘meet:v’, ‘meeting:n’, and ‘meeter:n’ were used as the seeds for the Meet event.
To evaluate each similarity measure, the terms found similar to each of the event's seeds (‘u ≲ seed’) by that measure were taken as expansion terms. All sentences containing the expansion terms were retrieved. To measure the sole contribution of the applied similarity list, we removed from the retrieved list all the sentences that contain at least one seed. For 11 out of thirty-three events, less than ten sentences were retrieved in this manner, providing insufficient statistics for comparison. These events were excluded from our evaluation, leaving twenty-two events. For these twenty-two events there are overall 3,789 positive annotated instances in the corpus (excluding those containing one of the seeds). This amounts to an average of 172 positive instances per event, within more than 15,700 sentences in the corpus.
The expansion quality for each event by a given measure was calculated by scoring each retrieved sentence with the sum of the similarity scores of the expansion terms it contains. For each event, the ranked list of retrieved sentences was generated and the list quality was assessed by the Average Precision (AP) evaluation measure (based on the ACE gold-standard annotation). We report Mean Average Precision (MAP) over all tested events for each tested measure.
5.4.2 Results
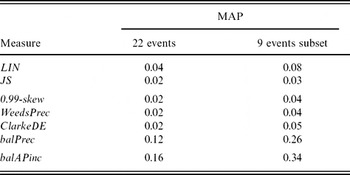
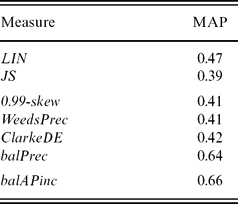
We evaluated balAPinc on the ACE setup as well as the following distributional similarity measures: LIN, Skew divergence with α = 0.99) (0.99-skew), Jensen-Shannon divergence (JS), WeedsPrecision (WeedsPrec), degree of entailment (ClarkeDE) and balPrecision (balPrec). Table 9 presents the results for the tested measures. We report the MAP score calculated for all twenty-two tested events. In addition, we report MAP value for a subset of nine events for which at least one of the evaluated measures achieved AP value of at least 0.1; these events are those for which expansion by distributional similarity methods is reasonably effective (for the remaining events purely distributional methods may not be suitable for lexical expansion).
MAP scores of the tested measures on the ACE experiment

The results show that the α-skew, the WeedsPrec and the ClarkeDE directional measures are not competitive for this application setting, showing lower performance than the symmetric measure of LIN. On the other hand, balPrec yields considerably better results. Our main result is that balAPinc is the best-performing measure, showing statistically significant improvement over all other measures according to the two-sided Wilcoxon signed-rank test at the 0.01 level. These results support our hypothesis that carefully designed directional approaches should produce improved similarity lists.
We next discuss these results in view of the desired properties of an inclusion measure, as defined in Sections 3 and 4. First, we note the utility of the balancing approach. It was introduced in order to demote similarities of short feature vectors, as suggested by the 3rd desired property. We remind that the balPrec measure is actually the balanced version of WeedsPrec. Thus, its considerable advantage over the WeedsPrec measure is achieved due to satisfying the third property by filtering out infrequent terms. Indeed, similarity lists produced by the WeedsPrec measure are full of arbitrary infrequent terms and thus appear as completely useless. For example, the top similarities produced by this measure for the seed term ‘meeting’ are ‘yield-pct’, ‘wheat tender - sri lanka’, ‘washington research group’, ‘walheim’, ‘vienna museum for applied arts’, ‘value-usda’ etc. (the same holds for the ClarkeDE measure, as shown earlier in Table 6).
We also see improved results for balAPinc over balPrec, which shows that meeting our other desired properties improves performance as well: (a) balPrec does not reflect different relevance of included features to the broader term and thus does not satisfy our 2nd desired property, while balAPinc does; (b) based on WeedsPrec, balPrec uses pmi for feature weights to reflect feature relevance to the narrower term, while balAPinc uses feature ranks, which seems advantageous from the perspective of satisfying the first desired property (as discussed in Section 3.1).
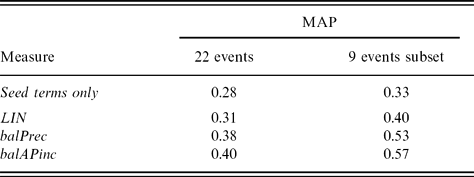
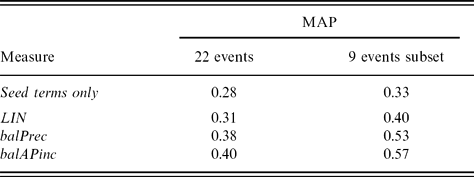
As an additional analysis of the results, Table 10 reports the results of the ACE experiment without excluding sentences that contain seed terms. The configurations included in the table are: using only seed terms without any lexical expansion, the two best-performing directional measures – balAPinc and balPrec, and the best-performing state-of-the-art symmetric LIN measure. From the table we see that directional measures introduce considerably higher improvement as compared to the symmetric approach. Furthermore, our proposed directional balAPinc measure outperforms the other baselines in this setting as well, and its improvement is statistically significant compared to all other configurations.
MAP scores of the balAPinc, balPrec and LIN measures on the ACE experiment without excluding the sentences with seed terms
Finally, we performed ablation tests on balAPinc by running the ACE experiment over intermediate measures constructed by removing one of the three improvements in balAPinc over the baseline AP measure (Section 4) at a time. The tests showed that each of the improvements introduces a statistically significant improvement in results.
To conclude, the results in this experiment support our suggestion to satisfy each of the desired inclusion measure properties presented in Sections 3 and 4 when designing distributional similarity measures.
5.4.3 Error analysis
To better understand the quality of the similarity lists generated by directional and symmetric measures, we performed error analysis on the results of the symmetric LIN measure and the directional balAPinc measure. To that end, we selected from each event the two highest scoring retrieved sentences that did not contain an event mention (false positives). We analyzed all matched expansions in these sampled sentences. Alltogether, over 600 expansion matches were evaluated for each measure.
In our analysis we aimed to identify in which cases false positive sentences were retrieved by clearly invalid expansions (e.g. ‘war ≲ demonstration’, ‘work ≲ marry’) versus being retrieved by potentially valid expansions, which yielded an irrelevant sentence in a specific context.
Such potentially valid lexical expansions were further split into two subtypes. The first one corresponds to valid entailment relations, both substitutable (Geffet and Dagan Reference Geffet and Dagan2005) and nonsubstitutable (Mirkin et al. Reference Mirkin, Specia, Cancedda, Dagan, Dymetman and Szpektor2009). These are high quality expansions, where the meaning of the broader term can be directly implied from the meaning of the narrower one, e.g. ‘sit-in ≲ demonstration’.
The other type of valid expansions refers to strong context relatedness, i.e. there is no entailment relation between the two terms but the context of the narrower term is quite prominently connected with the context of the broader one, e.g. ‘solidarity ≲ demonstration. These are somewhat less accurate expansions. Nevertheless, they could be successfully utilized both to detect mentions of the broader term's meaning and to support decisions involving additional similarity-based expansions.
We illustrate the two valid expansion types via the text ‘. . .Jordanian lawyers staged a sit-in at the main court house after being forcibly blocked by riot police from marching towards the Iraqi embassy to show their solidarity. . .’, which was extracted as mentioning the Demonstration event. The matching expansions consisted of three entailing terms, ‘sit-in’, ‘riot’ and ‘marching’, and three context-related terms ‘police’, ‘embassy’ and ‘solidarity’ (‘riot’ and ‘police’ were matched separately). In this example, context-related terms increased the matching score of the text, reflecting the level of certainty that it indeed contains a mention of the target event.
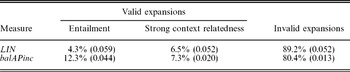
Table 11 presents the distribution of valid and invalid matched expansions in the false-positive sentences.
The distribution of valid and invalid expansions, whose matching resulted in false-positive errors in the ACE task. Average scores of the corresponding expansion types are given in parentheses

Invalid expansions. We see in the table that the majority of false-positive cases in our sample were caused by completely invalid expansions. For example, the sentence ‘We're planning on going July 4th week – what better time to be in Boston . . . stay with friends living in Boston . . .’ was retrieved as mentioning the Phone-Write event. This means that if it were possible to filter out the invalid expansions, manually or using some automatic techniques, this would yield much better performance. We note that often weight thresholds, either set up manually or tuned using some positive and negative examples, are used to filter out invalid expansions. Since in our evaluation we aimed at comparing different similarity measures rather than obtaining the optimal utility of different lexical resources for specific tasks, we did not apply such thresholds. This also explains the considerable amount of completely invalid expansions displayed in Table 11: sentences with many matches of invalid expansions got higher scores than those with one or two valid matches and thus were retrieved in our experiment.
From the average scores presented in Table 11 we see that scores produced by balAPinc allow much better distinction between valid and invalid expansions. The scores assigned by the balAPinc measure to valid entailments are noticeably higher than the scores for the context-related expansions, which in turn are much higher than those for completely invalid expansions. The scores assigned by the LIN measure do not show such sharp distinctions at all.
Valid expansions: passing reference. We observed that many flase-positive decisions were made using valid similarities. One of the main reasons is passing references, when a valid expansion term occurs in a text fragment, but it is not the focal point of a sentence. For example, a sentence containing the following fragment ‘Call Carnival Wedding Dept. at 1 800 933-4968’ was mistakenly extracted as mentioning the Marry event by applying the similarity pair ‘wedding ≲ marriage’. We conclude that developing techniques for more accurate matching of expansion terms in order to avoid passing reference would improve performance.
Valid expansions: semantic ambiguity. Another typical issue observed in our analysis is that many valid expansions cause errors due to their semantic ambiguity. In some cases errors were caused by matching a wrong sense of an expansion term in the text, e.g. incorrectly extracting the sentence ‘Everest is the highest summit in the world’ as mentioning the Meet event, as a result of applying the similarity pair ‘summit ≲ meeting’. In other cases errors occurred due to ambiguous seeds, e.g. when looking for the End-Position event mentions using pairs like ‘shoot ≲ fire’. Ambiguity of these two types was found in 35 per cent of matched valid expansions generated by the balAPinc measure (within our sampled false-positive sentences) and in 23 per cent of the matched valid expansions produced by the measure of LIN. We conclude that solving the problem of semantic ambiguity either explicitly via classical word sense disambiguation (WSD) techniques or implicitly via contextual preferences (e.g. Szpektor et al. Reference Szpektor, Dagan, Bar-Haim and Goldberger2008) would considerably improve the performance of similarity-based expansion.
5.4.4 Analysis of feature vector truncation
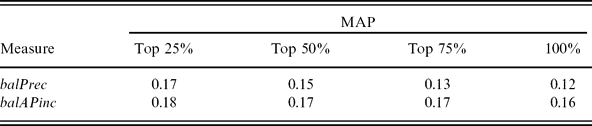
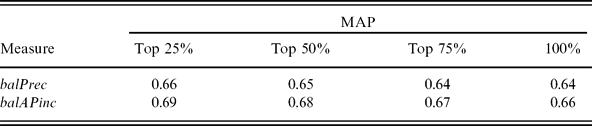
As discussed in Section 3.1, the distinguishing ability of inclusion measures should be higher when applying inclusion testing only to the top features of the candidate narrower term. Table 12 presents the performance of the balPrec and balAPinc measures when applied to such truncated vectors of the narrower term, which include only the top-n per cent of the ranked feature list, over the ACE experiment for all twenty-two tested events.
Performance of the balPrec and balAPinc measures on the ACE experiment when using for inclusion testing different top-n percents of the context features of candidate narrower terms
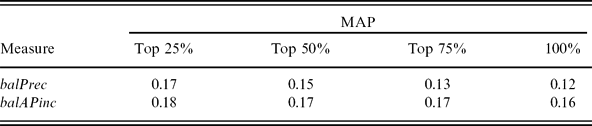
From the table we see that balAPinc consistently shows better performance. More generally, these results show that these inclusion measures indeed perform better when using truncated vectors of the candidate narrower term. When observing the optimal threshold in retrospect, we see that with top 25 per cent cut-off the results achieved by the two measures become rather close, but balAPinc still enjoys the benefit of being much more stable with respect to the cut-off point selection. Since in unsupervised settings we do not expect optimal tuning of this parameter, such robustness is indeed an advantage.
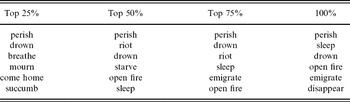
We also examined the highest scoring terms produced for the same seeds using vectors truncated at different points. We noticed that these lists typically look considerably different. An example for the seed verb ‘die’ is presented in Table 13. We thus conclude that developing techniques to identify appropriate feature vector cut-off points will allow inclusion measures to produce more precise similarity lists and is a worthwhile pursuit for future work.
Top similarities learnt by the balAPinc measure for a seed verb ‘die’ for different truncation points of the narrower term vector

5.5 Evaluation within keyword-based text categorization setting
5.5.1 Evaluation setting
As an additional application setting for lexical expansion, we evaluated the various similarity measures on a TC dataset. To that end we used an available keyword-based TC system (Barak, Dagan and Shnarch Reference Barak, Dagan and Shnarch2009). Such methods aim at topical categorization of documents based on sets of terms, without requiring a supervised training set of labeled documents (McCallum and Nigam Reference McCallum and Nigam1999; Ko and Seo Reference Ko and Seo2004; Liu et al. Reference Liu, Li, Lee and Yu2004). Generally speaking, such systems operate in two phases: (i) a setup phase, in which a set of characteristic terms for the category is assembled, constituting the category's feature vector; (ii) a classification phase, in which the term-based feature vector of a classified document is compared with the feature vectors of all categories.
In our evaluation, as in typical query expansion, category names were taken as seeds and expanded by distributional similarity to form category vectors. Document and category vectors were then compared with the cosine similarity measure, producing the categorization score for each document with respect to each category. Document features consist of POS-tagged lemmas of single words and bigrams, limited to nouns, verbs, adverbs, and adjectives, with term frequency as the feature value.
We note that for the eventual classification phase different keyword-based TC systems employ different strategies – some assign a document only to the category with the highest score, others select the top-n per cent of the documents classified for each category. Often, an additional bootstrapping step was conducted, feeding a standard supervised classifier with the classifications produced by the keyword-based categorization method. We note that in our case the final classification phase is not the focus of our evaluation. Since our goal is to comparatively evaluate the performance of various similarity measures in expanding the category name, we consider the ranked lists of documents assigned to each category. We thus view our categorization setting as similar to query expansion in IR and report the results in terms of Average Precision for the ranked lists of categorized documents, yielding the same evaluation procedure as in Section 5.4.
For our evaluation we used the Reuters-10 corpus, constructed of the 10 most frequent categories of the Reuters-21578 collection.Footnote 5 We used the Apte split of the Reuters-21578 collection, which is often used in TC tasks. The complete collection contains 12,902 documents for ninety categories, where the top ten categories include 9,296 documents. The documents are divided in advance to train (70 per cent) and test (30 per cent) parts. Since in our settings no training was performed, we only used the test part for our comparative evaluation.
5.5.2 Results
Table 14 presents the MAP values obtained for the tested measures on the TC experiment. The table shows that, as in the ACE setting, balAPinc is the best-performing measure.
MAP scores of the tested measures on the TC experiment
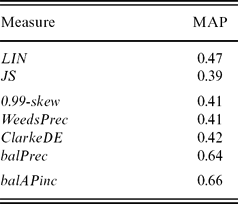
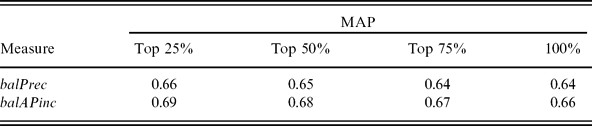
Table 15 presents the performance of the balPrec and balAPinc measures when applied to truncated vectors of candidate narrower terms, analogously to Table 12. The results affirm the finding for the ACE evaluation, that inclusion measures benefit from using truncated vectors of candidate narrower terms. We also see that in this evaluation balAPinc preserved its advantage over the balPrec measure for the optimal cut-off as well.
Performance of the balPrec and balAPinc measures on the TC experiment when using for inclusion testing different top-n percents of the features of candidate narrower terms
Overall, summarizing the evaluations, we conclude that satisfying all the desired properties indeed allowed our balAPinc measure to show best results in detecting the direction of similarity relation and to achieve the best performance within both application-oriented tasks, as well as to show higher robustness with respect to the truncation level of the vectors of the narrower terms.
6 Conclusions and future work
This paper advocates the use of directional similarity measures for lexical inference and expansion. In particular, we focus on directional measures based on distributional inclusion scores for feature vector pairs. Based on a thorough analysis, we identified desired properties for an inclusion-based directional similarity measure. Showing that state-of-the-art directional measures do not satisfy all these properties, we designed a novel directional measure, balAPinc, based on the standard IR Average Precision evaluation measure, which addresses all of the desired properties.
We compared our proposed measure to other state-of-the-art symmetric and directional measures on detecting the direction of entailment relations between terms, under which balAPinc showed the best results. In addition, we tested our measure as well as the other baseline state-of-the-art measures on lexical expansion for two application settings, IE and keyword-based TC. In both settings, our carefully designed directional measure performed significantly better than the other tested measures. We also observed that only one of the previous directional measures, balPrec, achieved competitive results, but our measure was more robust. In general, our experiments show the advantage of directional measures that satisfy the proposed desired properties over both typical symmetric measures and directional measures that do not follow these properties.
In a future work, we plan to explore other measures that meet our suggested properties. In addition, we found that truncated feature vectors for narrower terms perform better than the complete vectors. We thus plan to investigate automatic techniques for choosing the optimal truncation point. Also, many correctly learned rules were incorrectly applied in invalid contexts. In a future work, we aim at automatically learning each rule's context model as well, to improve rule application (Szpektor et al. Reference Szpektor, Dagan, Bar-Haim and Goldberger2008). Finally, it would be interesting to apply our novel directional measure as a kernel function for supervised learning like in Bloehdorn and Moschitti (Reference Bloehdorn and Moschitti2007) or in Basili, Cammisa and Moschitti (Reference Basili, Cammisa and Moschitti2006), as well as to apply it in other related fields, such as simulating human associations and psychological distance and compare it with measures designed for this kind of tasks (e.g. Michelbacher, Evert and Schutze Reference Michelbacher, Evert and Schutze2007).
Acknowledgements
This work was partially supported by the NEGEV project (www.negev-initiative.org), the PASCAL-2 Network of Excellence of the European Community FP7-ICT-2007-1-216886, the Israel Science Foundation grant 1112/08, and the FBK-irst/Bar-Ilan University collaboration under the ITCH Project. We thank Roy Bar-Haim and Libby Barak for providing their systems for the evaluations, and Benjamin Zhitomirsky for his help with the WordNet::Similarity package. Finally, we thank the anonymous reviewers for their useful comments and suggestions.