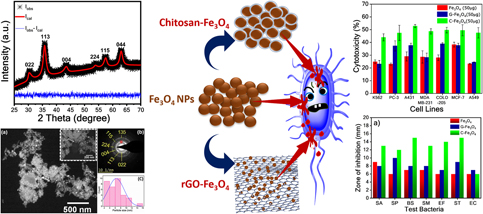
Introduction
Iron oxide nanoparticles (IONPs), owing to their superparamagnetic behavior, have shown great potential toward biomedical applications for decades by competing with a variety of biocompatible nanoparticles viz., magnetic nanoparticles, gold nanoparticles, core–shell quantum dots, carbon nanoparticles, rare earth nanoparticles, polymers, and liposomes [Reference Nazarenus, Zhang, Soliman, del Pino, Pelaz, Carregal-Romero, Rejman, Rothen-Rutishauser, Clift, Zellner, Nienhaus, Delehanty, Medintz and Parak1]. The promising features like tunability in size [Reference Baldi, Bonacchi, Innocenti, Lorenzi and Sangregorio2], shape [Reference Song and Zhang3], and surface [Reference Kucheryavy, He, John, Maharjan, Spinu, Goloverda and Kolesnichenko4] make the IONPs versatile and candidate material for various applications like high-density magnetic storage [Reference Frey, Peng, Cheng and Sun5], magnetic catalysis [Reference Polshettiwar, Luque, Fihri, Zhu, Bouhrara and Basset6], water splitting [Reference Mangrulkar, Polshettiwar, Labhsetwar, Varma and Rayalu7, Reference Goncalves and Leite8], and biomedicine [Reference Kumar and Mohammad9, Reference Salunkhe, Khot and Pawar10]. Besides, the IONPs synthesized with enhanced biocompatibility are being used in various biomedical applications including in vivo magnetic resonance imaging (MRI) [Reference Qiao, Yang and Gao11, Reference Macher, Totenhagen, Sherwood, Qin, Gurler, Bolding and Bao12, Reference Iv, Telischak, Feng, Holdsworth, Yeom and Daldrup-Link13], magnetic particle imaging (MPI) [Reference Goodwill and Conolly14, Reference Ferguson, Khandhar and Krishnan15, Reference Tomitaka, Arami, Gandhi and Krishnan16], in vitro bioseparation [Reference Marszałł17, Reference Zhang, Qie, Hou, Luo, Luo, Sun and Tan18], targeted in vivo drug delivery [Reference Widder, Senyei and Scarpelli19], and hyperthermia [Reference Laurent, Dutz, Häfeli and Mahmoudi20].
In targeted drug delivery, IONPs are usually tagged to specific biological molecules (drugs) to target malignant tissues inside the human body [Reference Kumar and Mohammad9, Reference Widder, Senyei and Scarpelli19, Reference Assa, Jafarizadeh-Malmiri, Ajamein, Vaghari, Anarjan, Ahmadi and Berenjian21]. An external magnetic field will control the targeted IONPs. In general, the agglomeration is the most common issue possessed by nanoparticles due to their higher surface energies. However, the efficient biocompatibility could be achieved by preventing agglomeration by surface functionalization of IONPs. Chitosan (poly-β-(1-4)-2-amino-2-deoxy-D-glucose) is a widely accepted surface functionalizing agent among existing polymeric and nonpolymeric agents, owing to its low cost, biocompatibility, nontoxicity, chemical stability, thermal stability, and cation characteristics [Reference Salehizadeh, Hekmatian, Sadeghi and Kennedy22]. Coating of IONPs with chitosan results into IONPs of a magnetic core with biodegradable chitosan shell. The magnetic behavior of IONPs helps in targeting drugs to a specific site through an external magnetic field. Whereas biodegrading behavior of chitosan shell leads to the release and transport of drugs which are already loaded to these chitosan-functionalized IONPs [Reference Assa, Jafarizadeh-Malmiri, Ajamein, Vaghari, Anarjan, Ahmadi and Berenjian21]. These targeted IONPs can be even separated from biological drugs through magnetic separation and reused.
Once efficient targeting is achieved, IONPs adds to the utility of drugs in the treatment of harmful cells, thus reducing the overall dosage. Usually, cancerous cells and bacteria have a net negative charge on their surface. Their growth rate can be mitigated or inhibited upon interaction with drugs (containing a net surface positive charge) by being antiproliferative or cytotoxic based on their interaction and dosage level of drugs. A variety of cell proliferative studies [Reference Roper and Drewinko23] are in practice to investigate the effect of IONPs on the minimization of dosage required, and the health issues can rise during drug targeting. On the other hand, various screening methods also have been reported so far for quantifying antibacterial activity [Reference Valgas, Machado de Souza, A Smânia and Smânia24] of as-synthesized agents.
Graphene also has gained significant attention in this scenario. The surface contact–based bioactivity of graphene-based materials through the possible generation of reactive oxygen species (ROS) made them candidate materials for cytotoxicity-based studies [Reference Perreault, De Faria, Nejati and Elimelech25, Reference Gurunathan, Woong Han, Eppakayala and Kim26]. The significant results of graphene and graphene combined with IONPs in the current context were reported elsewhere [Reference Santos, Mangadlao, Ahmed, Leon, Advincula and Rodrigues27, Reference Pelin, Fusco, León, Martín, Criado, Sosa, Vázquez, Tubaro and Prato28, Reference Hastak, Bandi, Kashyap, Singh, Luqman, Lodhe, Peshwe and Srivastav29, Reference Yang, Hao, Chen, Ma, Wang, Wang, Yue, Sun, Shao, Murugadoss and Guo30, Reference Jedrzejczak-Silicka31, Reference Gade, Dar, Mishra, Khan, Kumar and Patyal32]. Jedrzejczak-Silicka et al. [Reference Jedrzejczak-Silicka31] investigated the effect of graphene with Fe3O4 on relative viability and DNA integrity. They summarized that this material showed excellent biocompatibility. Furthermore, they reported the potentiality of the material for hyperthermia treatment. Gade et al. [Reference Gade, Dar, Mishra, Khan, Kumar and Patyal32] reported the dose-dependent cytotoxic effects of graphene oxide–Fe2O3 nanoparticles on Wharton’s jelly-derived mesenchymal stem cells (WJ-MSCs). The GO–Fe2O3 showed less impact on cellular morphology, viability, clonigenic property, and growth kinetics of caprine WJ-MSCs. Negative impact on these parameters was increased with the dose of GO–Fe2O3.
In the current work, Fe3O4 nanoparticles were prepared via facile chemical coprecipitation method. The nanoparticles were functionalized with chitosan, and in-home prepared rGO. The advanced characterization tools and techniques were used to understand how the inherent behavior or properties of the materials are related to cytotoxicity and antibacterial activities. The materials were analyzed rigorously for phase and crystal structure investigations, particle size analysis, magnetic behavior, and chemical stability. Their cytotoxicity and antibacterial activities were investigated individually against various cell lines and bacteria. Finally, the effect of functionalization with chitosan and graphene on these cytotoxicity and antibacterial activities were correlated.
Results and discussion
Characterization
XRD
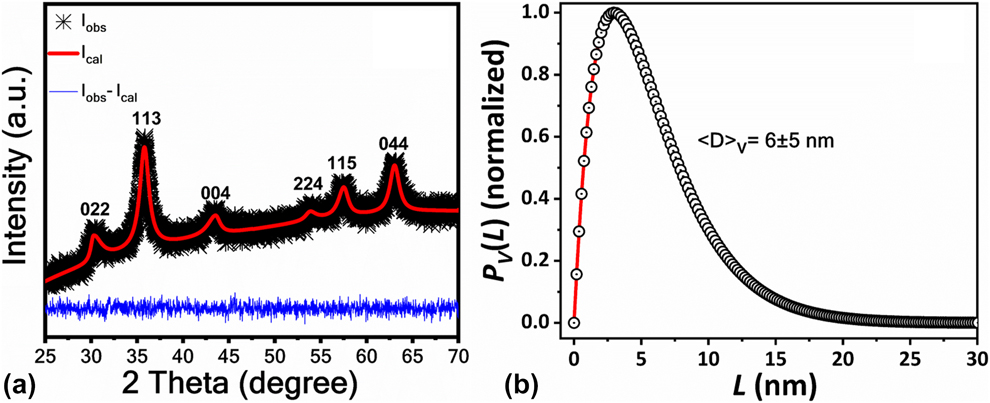
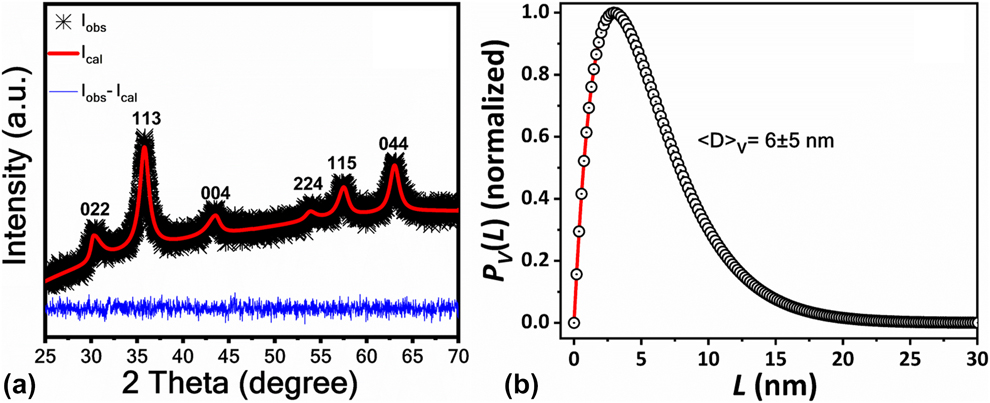
Figure 1(a) shows the XRD spectra of Fe3O4 nanoparticles. The XRD profile of Fe3O4 nanoparticles was well matched with the reference pattern (ICSD reference code 98-015-8505) [Reference Gatta, Kantor, Ballaran, Dubrovinsky and Mccammon33]. The quantification of structural parameters like crystallite size was carried through adopting line profile analysis (LPA). The structural analysis was done by fitting XRD spectra with pseudo-Voigt function. In the abovementioned LPA, integral breadth will be considered as a measure of peak width and universal shape factor considers for peak shape variation. The instrumental broadening was subtracted with a silicon standard sample, which was fitted by the same pseudo-Voigt profile fitting function. The details of complete profile fitting parameters have been discussed elsewhere [Reference Prince, Prince and Stalick34, Reference Srivastav, Panindre and Murty35, Reference Bandi, Hastak, Peshwe and Srivastav36]. The crystallite size (coherently diffracted domains) and its distribution were evaluated by double-Voigt analysis as reported by Balzar and Ledbetter [Reference Balzar and Ledbetter37]. The Breadth program by Balzar was used here for the crystallite size distribution by taking full-width at half-maximum (FWHM) and mixing parameter (η) of LPA fitted XRD profiles as input parameters [Reference Balzar38, Reference Srivastav, Basu, Kashyap, Chawake, Yadav and Murty39]. The crystallite size was evaluated to be 6 ± 5 nm, and the distribution was as shown in Fig. 1(b).
(a) XRD spectra of Fe3O4 nanoparticles with LPA and (b) crystallite size distribution using double-Voigt analysis by Breadth program. I obs corresponds to the intensity obtained from the sample. I calc is the intensity of the profile after pseudo-Voigt function fitting. I obs − I calc is the difference plot of observed and calculated profiles.
TEM
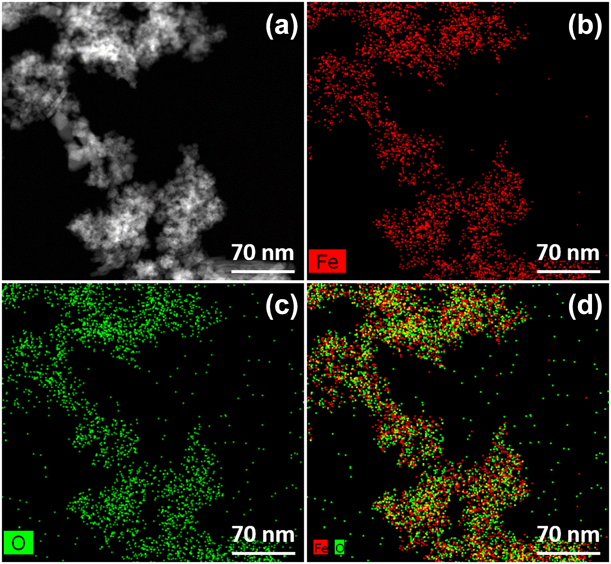
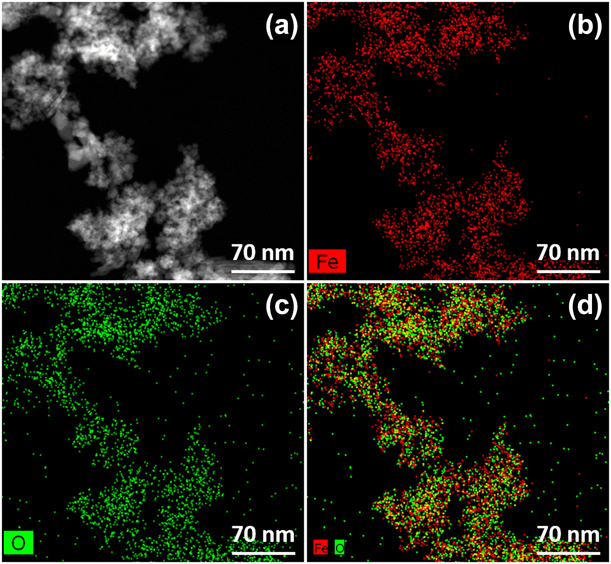
The elemental distribution of Fe and O in Fe3O4 system was examined with the help of high-angle annular dark-field scanning transmission electron microscopy (HAADF-STEM) [coupled with energy dispersive spectroscopy (EDS)]. Figure 2 shows the HAADF-STEM images of the Fe [Fig. 2(b)], O [Fig. 2(c)], and the overlay of Fe and O [Fig. 2(d)] for the selected area [Fig. 2(a)] in the sample. The elemental mapping revealed that the distribution of Fe and O in Fe3O4 are consistent.
STEM-HAADF elemental mapping of Fe3O4 nanoparticles (a) HAADF-STEM image of the selected area for elemental mapping, (b) the mapping indicating for Fe, (c) the mapping of oxygen, and (d) the overlay of both Fe and O.
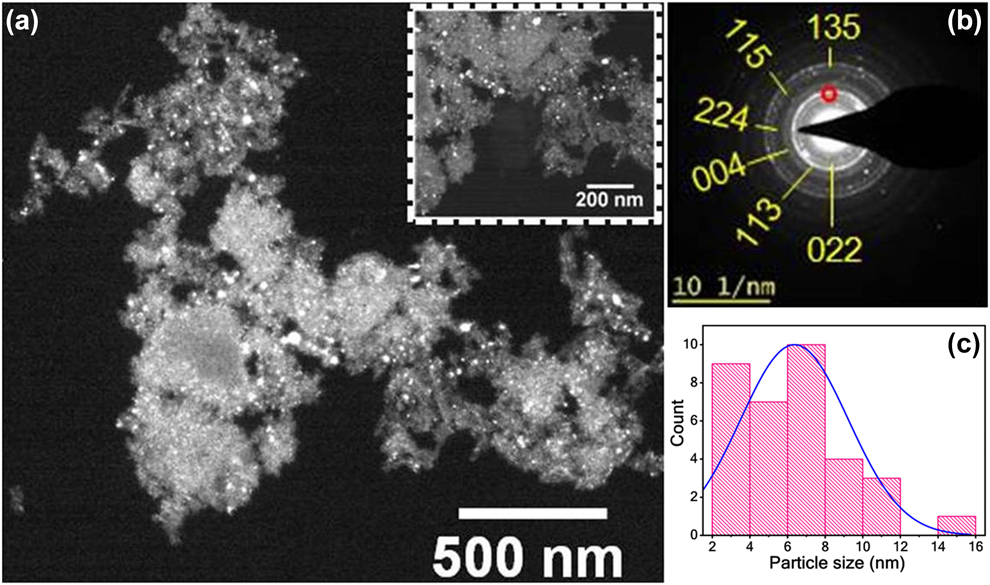
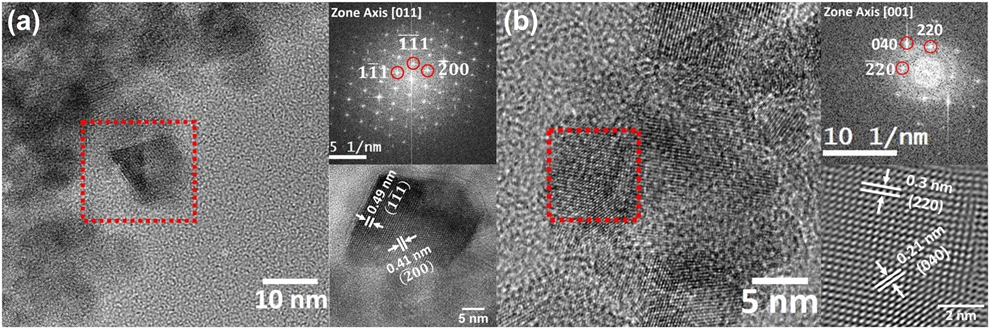
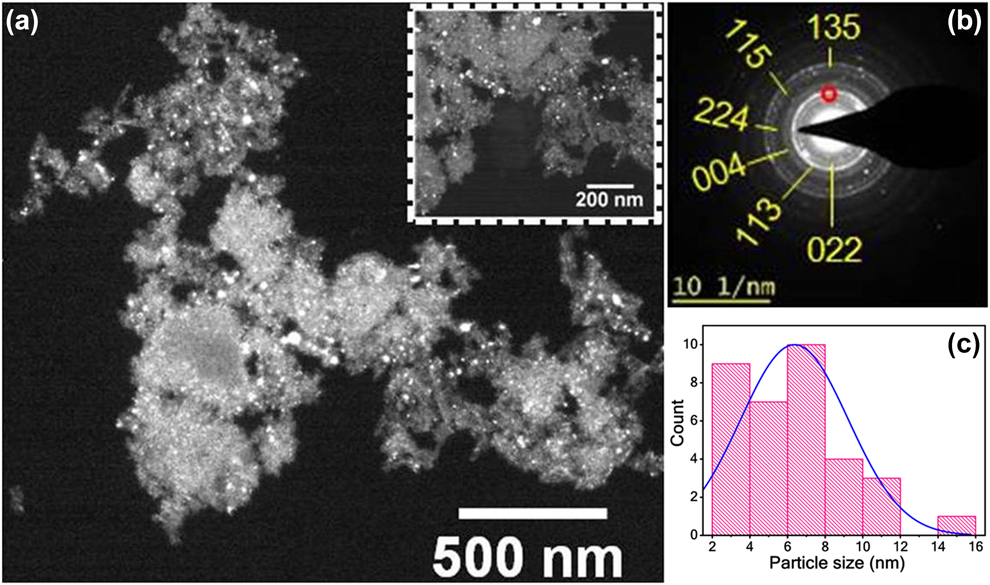
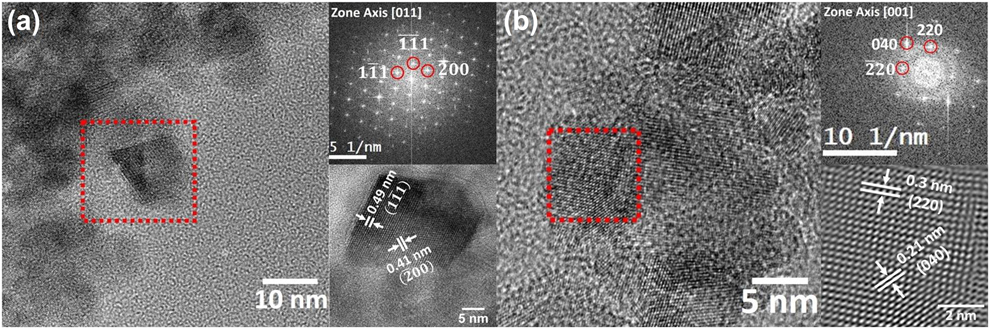
Whereas Fig. 3 shows the dark-feld image of Fe3O4 nanoparticles (a), corresponding selected area electron diffraction (SAED) ring pattern (b), and the histogram for particles size distribution. The bright spots in the dark-field image correspond to the most intense ring (113) from the electron diffraction pattern (indexed with red mark). The size of the particles was varying between 2 and 16 nm. Thus, the histogram was made with the collected data of each particle’s size to measure the average particle size. The average size of the particles from the size histogram was found to be 6 ± 3 nm, which is in line with the crystallite size measured through Balzar’s breadth program (6 ± 5 nm). As the crystallite size is similar to the particle size, the particles formed in this process could be the single-crystal nanoparticles of Fe3O4. The high-resolution transmission electron microscopy (HRTEM) images, corresponding to the selected area of diffraction patterns (of red square in HRTEM images), and their inverse fast Fourier transform (IFFT) HRTEM images are illustrated in Figs. 4(a) and 4(b), respectively. The d-spacing measurements for the corresponding planes in the IFFT patterns were in good agreement with the reference pattern.
(a) Dark-field TEM image of Fe3O4 nanoparticles, (b) SAED pattern indexed with planes corresponding to Fe3O4 inverse spinel structure, and (c) size distribution of Fe3O4 nanoparticles showing average particle size 6 ± 3 nm.
(a) and (b) High-resolution TEM micrographs of Fe3O4 nanoparticles with indexed FFT patterns of the selected area (red square) and corresponding noise-corrected lattice images.
VSM
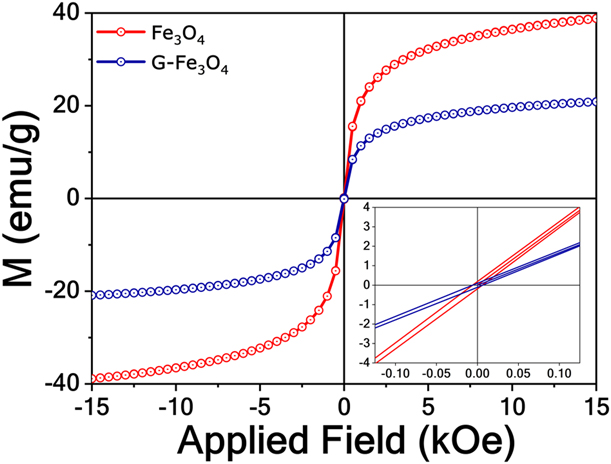
The superparamagnetism of Fe3O4 and G-Fe3O4 was examined through M–H hysteresis curve obtained through vibrating sample magnetometer (VSM) as shown in Fig. 5. The magnetization curve with nearly closed hysteresis loop shows the superparamagnetic nature of both materials. The values of saturation magnetization (M s) and coercivity for Fe3O4 nanoparticles were found to be as 39 emu/g and 6.09 Oe, respectively. Whereas G-Fe3O4 possessed 20.1 emu/g saturation magnetization and 6.25 Oe coercivity, respectively. The near-zero value of remnant magnetization (retentivity) indicates zero magnetization of the samples on the removal of the external field [Reference Cullity and Graham40].
The M–H hysteresis curve obtained by VSM for Fe3O4 and G-Fe3O4. The inset shows the magnified portion of the curve near the origin. The magnetization curve with almost closed hysteresis loop can be attributed to the superparamagnetic behavior of Fe3O4 and G-Fe3O4.
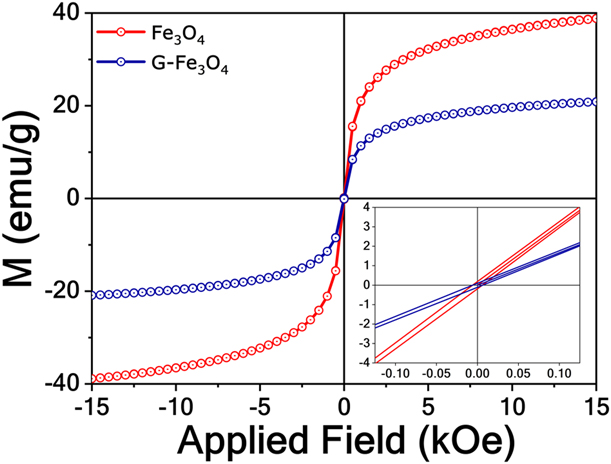
The theoretical value of saturation magnetization for bulk Fe3O4 is said to be 96 emu/g. The decreased saturation magnetization values were obtained for both Fe3O4 and G-Fe3O4. The decrease in saturation magnetization could be possible with reduced particle size, surface disorders, cation distributions, and adsorbed moisture over the particle surfaces. These reasons could be affected to the extent of creating a dead magnetic layer over the particle surfaces. Thus, the saturation magnetization comes down [Reference Padalia, Johri and Zaidi41]. The same could be happened in case of C-Fe3O4 due to the presence of nonferromagnetic organic layer around the particle and exhibiting individual particle nature due to functionalization [Reference Pham, Nguyen, Pham, Tran and Tran42, Reference Safari and Javadian43, Reference Karimzadeh, Aghazadeh, Doroudi, Ganjali and Kolivand44]. As the Fe3O4 particles in the current study are in the nanodomain (6 nm), the moisture adsorption could be higher because of their higher surface energies. Consequently, the saturation magnetization might get decreased. The addition of nonmagnetic materials, i.e., rGO further decreased its saturation magnetization in G-Fe3O4. However, both the materials have retained the superparamagnetic behavior.
Raman spectroscopy
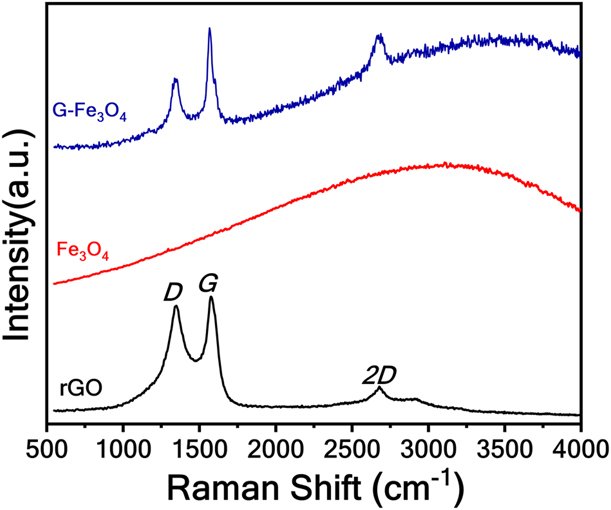
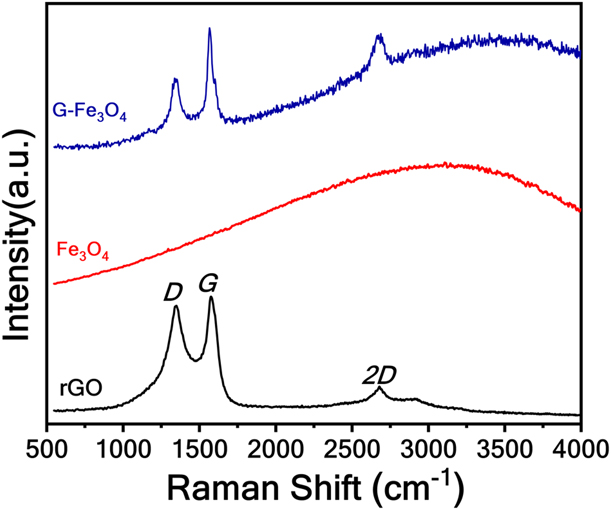
The Raman spectra of carbon/graphene-based materials can be explained by their characteristic peaks, namely, D-band, G-band, and 2D-band. These bands reveal vibrational phonon scattering characteristics as well as the electronic structure of graphene [Reference Bin Wu, Lin, Cong, Liu and Tan45]. The D-band of rGO points out structural defects and is related to sp 3 carbon atoms that might result from oxidation of sp 2 carbon atoms. The G-band is the characteristics of sp 2 carbon atoms (E2g phonons) that form the skeleton of graphene. The 2D peak, often considered as D-peak of second order, does not necessarily represent defects but is an essential characteristic peak which determines the approximate thickness of graphene layer [Reference Mura, Jiang, Vassalini, Gianoncelli, Alessandri, Granozzi, Calvillo, Senes, Enzo, Innocenzi and Malfatti46, Reference Wall47].
Figure 6 shows the Raman spectra of rGO, Fe3O4, and G-Fe3O4. The I D/I G ratio, which gives sp 3/sp 2 carbon atoms ratio, quantifies approximately defects due to oxidation in graphene. I D/I G for G-Fe3O4 was found to be 0.964 as compared with 0.9827 for rGO, which signifies more defects in rGO as a result of prominent oxidation in the carbon structure of rGO [Reference Bandi, Ravuri, Peshwe and Srivastav48]; the degree of defects thus can be believed to be less in case of G-Fe3O4 due to effective functionalization [Reference Mura, Jiang, Vassalini, Gianoncelli, Alessandri, Granozzi, Calvillo, Senes, Enzo, Innocenzi and Malfatti46]. The I 2D/I G ratio which corresponds to 2-dimensional defects thus quantifying the number of graphene layers was less in case of G-Fe3O4 (0.995) as compared with rGO (0.814), which can be attributed to the introduction of 2D defects by Fe3O4 nanoparticles in graphene structure [Reference Bin Wu, Lin, Cong, Liu and Tan45, Reference Wall47, Reference Wang, Wang, Cao, Feng and Lan49].The reduced oxidation defects, as well as the number of graphene layers, provide significant advantages for enhancing bioactivity.
Raman spectra of rGO, Fe3O4, and G-Fe3O4.
TGA
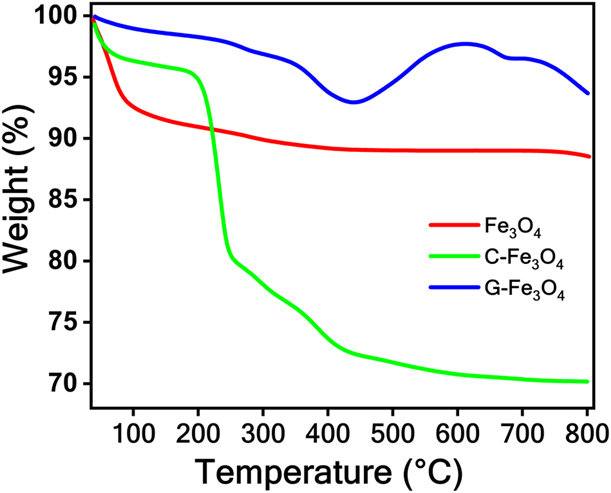
The thermal gravimetric analysis (TGA) data of Fe3O4, C-Fe3O4, and G-Fe3O4 are shown in Fig. 7. The mass loss observed at the end of the experiment for Fe3O4, C-Fe3O4, and G-Fe3O4 was 11.49, 29.83, and 6.32%, respectively. The mass loss of C-Fe3O4 was 2.5 times higher than that of the uncoated Fe3O4 nanoparticles. The evaporation/degradation of chitosan coated over the Fe3O4 nanoparticles could be the reason for this excess weight loss. The weight loss occurs before 150 °C attributes to desorption of physisorbed water molecules on the chitosan surface [Reference Corazzari, Nisticò, Turci, Faga, Franzoso, Tabasso and Magnacca50]. The sudden drop in the C-Fe3O4 TGA curve has occurred at 190 °C, and ∼15% weight loss was observed in the range of 190–253 °C, which was typical degradation temperature range for chitosan. Hasan et al. [Reference Hasan, Waibhaw, Tiwari, Dharmalingam, Shukla and Pandey51] reported that the degradation of chitosan would be in two stages, i.e., 150–400 °C and above 400 °C. The first stage of degradation occurs due to depolymerization of chitosan backbone through cleavage of glycosidic linkages. Whereas decomposition of any carbonaceous matter attributes the second stage of degradation. Thus, the weight loss in the range of 150–600 °C could be attributed to the degradation of chitosan. There was a negligible weight loss in the temperature range of 600–800 °C, indicating complete decomposition of chitosan molecules leaving behind Fe3O4 nanoparticles uncoated. The approximate weight percent of chitosan inferred by comparing the TGA data was found to be approximately 18%. Hence, the TGA data provided evidence for the presence of chitosan coating over Fe3O4 nanoparticles.
TGA profile of Fe3O4, rGO, and C-Fe3O4 showing the weight loss with respect to the increasing temperature.
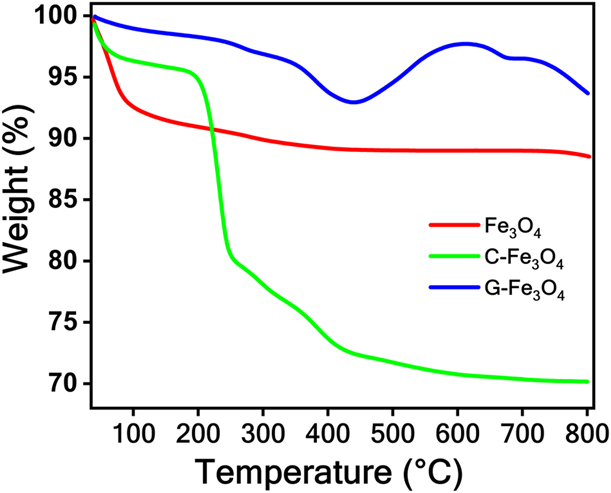
The weight loss of G-Fe3O4 was very little as compared with the other two materials. The weight loss of 1.77% till 200 °C can be due to the removal of adsorbed moisture. The highest mass loss, i.e., 7.06% in the region of 250–450 °C, can be ascribed to the decomposition of oxygen functional groups and combustion of the carbon [Reference Tayyebi and Outokesh52]. Hence, the presence of rGO in G-Fe3O4 is evidenced.
Bioactivity
In vitro cytotoxicity
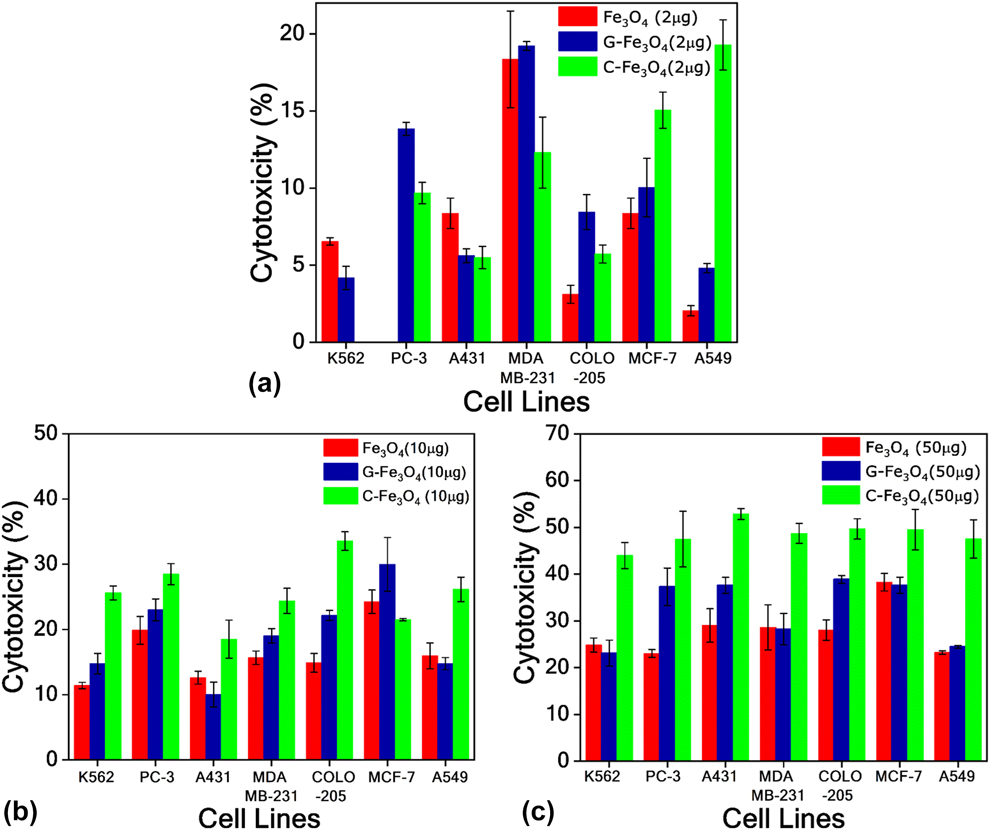
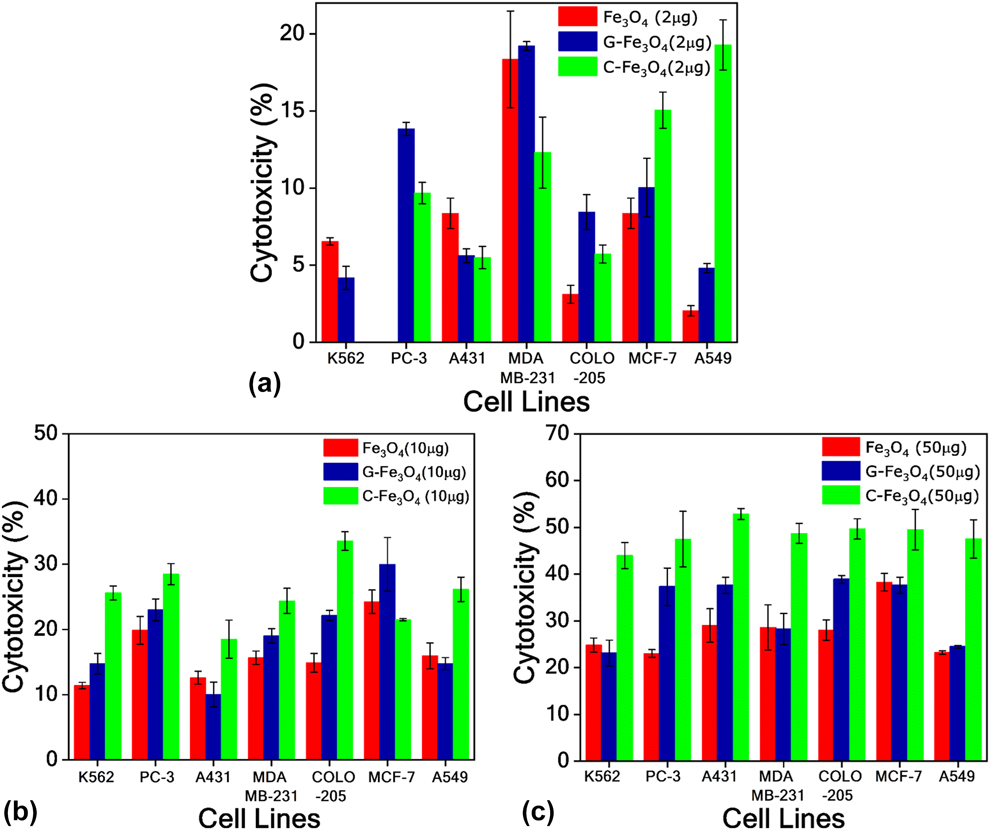
The results showed that with 2 μg/mL of Fe3O4, G-Fe3O4, and C-Fe3O4, the percent cytotoxicity of the test samples was nearly equivalent, and below 18%. Fe3O4 and C-Fe3O4 were not responsive to the PC-3 and K562, respectively. With the increase in concentration to 10 μg/mL, the cytotoxicity of G-Fe3O4 and C-Fe3O4 was enhanced as compared with Fe3O4-alone treated cells. The viability of COLO-205 cell lines reduced to ∼22% and ∼34% with G-Fe3O4 and C-Fe3O4, respectively, and it is reduced to ∼30 and ∼21% in case of MCF-7 cell lines. When the concentration of the test samples was further increased to 50 μg/mL, bare Fe3O4 showed ∼20–30% cytotoxicity (except MCF-7 cell line for which the value was ∼38%), whereas G-Fe3O4 exhibited 20–40% with almost ∼38% for PC-3, A431, COLO-205, and MCF-7. The C-Fe3O4 showed the highest range of ∼40–55% cytotoxicity with a maximum value of ∼53% in case of A431 cell line. Also, it has exhibited the highest cytotoxicity in case of all cell lines in comparison to Fe3O4 and G-Fe3O4. The performance of G-Fe3O4 lies between the Fe3O4 and C-Fe3O4. It can be concluded that chitosan enhanced the cytotoxicity of Fe3O4 nanoparticles by approximately two folds, with 50 μg/mL concentration. This can be attributed to the improved surface topography, surface chemistry, and surface energy imparted by chitosan coating over Fe3O4 nanoparticles, which enhances the cytotoxicity of Fe3O4 nanoparticles [Reference Shi, Jia, Guo, Zhao, Chen, Guo, Cheng and Zhang53].
On the other hand, the increment in the cytotoxicity was not significant when rGO was added to Fe3O4 nanoparticles. The aggregation of Fe3O4 over the rGO sheets might have limited the efficient interaction of G-Fe3O4 against the cell lines [Reference Kavinkumar, Varunkumar, Ravikumar and Manivannan54]. However, the results indicate that increment in the concentration of this sample might increase the cytotoxicity appreciably. A critical observation with the addition of rGO to Fe3O4 nanoparticles is that the increment in cytotoxicity can be attained while ensuring less harm to healthy cells. Figures 8(a), 8(b), and 8(c) shows the cytotoxicity of Fe3O4, G-Fe3O4, and C-Fe3O4, with varying sample concentration against various cell lines.
Percent cytotoxicity of Fe3O4, G-Fe3O4, and C-Fe3O4 at concentrations of (a) 2 μg/mL, (b) 10 μg/mL, and (c) 50 μg/mL against various cell lines.
Antibacterial activity
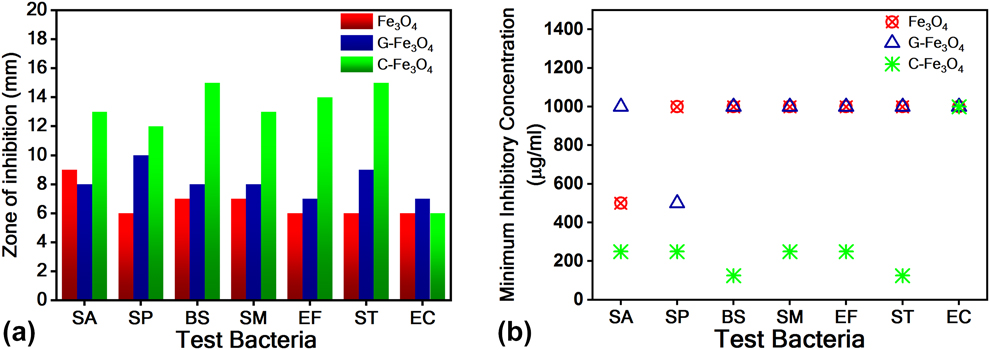
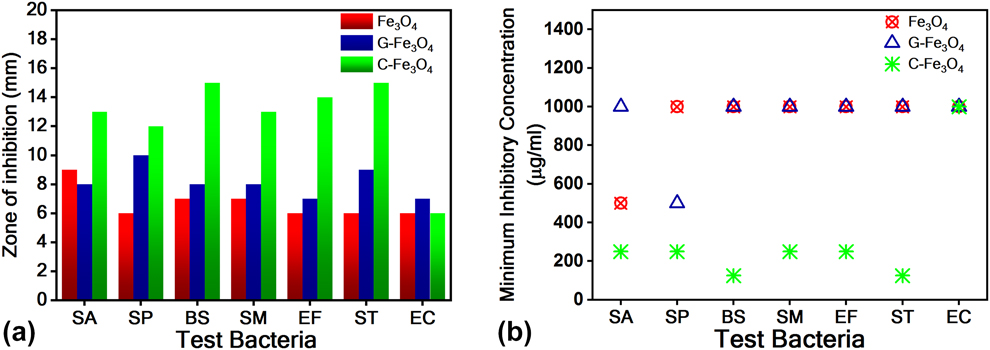
The minimum concentration of an antimicrobial drug required to inhibit the visible growth of microorganism is called as minimum inhibitory concentration (MIC) [Reference Andrews55]. The antibacterial findings of Fe3O4, G-Fe3O4, and C-Fe3O4 against different Gram-positive and Gram-negative bacteria showed that MIC for bare Fe3O4 was 1000 μg/mL in most of the tested bacterial strains, except Staphylococcus aureus. G-Fe3O4 also showed the similar results of MIC 1000 μg/mL, except for Streptococcus pyogenes. The MIC in case of C-Fe3O4 was reduced to below (or equal to) 250 μg/mL against all bacteria excluding Escherichia coli, for which the MIC was 1000 μg/mL.
The ZOI was also improved upon treatment with G-Fe3O4 and C-Fe3O4 as compared with Fe3O4 alone. However, the response against Gram-negative bacteria Escherichia coli was unchanged with chitosan, but with G-Fe3O4, we observed maximum ZOI in this case. In conclusion, C-Fe3O4 proved to be the best antibacterial agent than bare Fe3O4 and G-Fe3O4 against treated pathogens. Where G-Fe3O4 stood in-between Fe3O4 and C-Fe3O4 in most of the cases, these biological impacts of IONPs may be related with production of excess ROS as well as superoxide radicals (O2−), hydroxyl radicals (OH), hydrogen peroxide (H2O2), and the singlet oxygen (1O2) which hinders the growth of bacteria by damaging DNA and proteins in them with enhanced oxidative stress in bacterial cells [Reference Uygur, Craig, Mason and Ng56, Reference Hussain, Hess, Gearhart, Geiss and Schlager57, Reference Padhi, Panigrahi, Parida, Singh and Mishra58]. Figure 9(a) depicts the zone of bacterial inhibition imparted by the samples against various bacteria. Figure 9(b) shows the MIC of the samples.
(a) Zone of growth inhibition of the samples against various bacteria. SA-Staphylococcus aureus (MTCC96), SP-Streptococcus pyogenes (MTCC442), BS-Bacillus subtilis (MTCC121), SM-Streptococcus mutans (MTCC890), EF-Enterococcus faecalis (MTCC439), ST-Salmonella typhi (MTCC733), and EC-Escherichia coli (MTCC723), and (b) MICs of the sample required.
As the Fe3O4 nanoparticles are ultrafine, they tend to agglomerate readily. It leads to a decrease in their active surface area, which could be a limiting factor for the interaction between bacteria cell walls and these particles. Hence, it lessens the bacterial growth inhibition [Reference Nayamadi Mahmoodabadi, Kompany and Mashreghi59]. As a result, the Fe3O4 nanoparticles exhibited less antibacterial activity in comparison to G-Fe3O4 and C-Fe3O4. The same kind of phenomena might have occurred between the Fe3O4 nanoparticles distributed over rGO sheets (G-Fe3O4). However, due to the support of rGO, this material showed enhanced performance compared with bare Fe3O4 nanoparticles. The efficient surface coating with chitosan might make the Fe3O4 nanoparticles individual and less agglomerative. Thus, these particles could be penetrated through the bacteria membrane easily and lead to better bactericidal effects [Reference Lee, Kim, Il Lee, Nelson, Yoon and Sedlak60].
Conclusions
The present work demonstrates the facile synthesis of Fe3O4 nanoparticles via chemical coprecipitation method. The inverse spinel structure of magnetite for the particles synthesized was confirmed by XRD analysis. The average particle size was estimated as 6 ± 3 nm using TEM. The superparamagnetism of the particles was examined by M–H hysteresis curves. The rGO was synthesized by electrochemical exfoliation of waste carbon battery electrodes followed by reduction treatment. The Fe3O4 nanoparticles surfaces were functionalized with chitosan and rGO. Bioactivity tests were performed to quantify cytotoxicity and antibacterial activity of Fe3O4, G-Fe3O4, and C-Fe3O4. The surface functionalization with rGO and chitosan enhanced the cytotoxicity as well as antibacterial activity in comparison to uncoated Fe3O4 nanoparticles. Majorly, the activity was observed in the descending order as C-Fe3O4, G-Fe3O4, and Fe3O4. Finally, it could be concluded that the agglomeration of the particles might affect their bioactivity negatively.
Experimental details
Synthesis of Fe3O4 nanoparticles and rGO
A simple chemical-coprecipitation technique was adopted for the synthesis of Fe3O4 nanoparticles. To begin with, anhydrous FeCl3 (96% assay, Fisher Scientific, Mumbai, India) and hydrated FeCl2 (98% assay, Loabachemie, Mumbai, India) were dispersed together in distilled water with the molar ratio of 2:1. The solution was magnetically stirred continuously for 1 h at 70–80 °C under inert (N2) atmosphere. Subsequently, NaOH (96% assay, Fisher Scientific, Mumbai, India) solution of 1 M was added dropwise, which led to the precipitation of solution. The precipitate was separated and washed several times with distilled water and ethanol, and dried in an inert (N2) atmosphere.
The rGO was synthesized via electrochemical exfoliation method followed by thermal reduction treatment. Two waste dry cell battery carbon electrodes were selected as anode and cathode in the process. The complete synthesis details were discussed in our previous work [Reference Bandi, Ravuri, Peshwe and Srivastav48].
Functionalization of Fe3O4 nanoparticles
The Fe3O4 nanoparticle surfaces were functionalized with chitosan and rGO individually. For the surface functionalization with chitosan, a surfactant solution was prepared by dissolving 20 mg of chitosan powder in 100 mL of acetic acid solution (1% weight to volume ratio in 100 mL distilled water) and surfactant solution [2 g of CTAB (cetyltrimethylammonium bromide) to 400 mL of distilled water]. Then, Fe3O4 nanoparticles of 250 mg were dispersed in the surfactant and magnetically stirred for 1 h at 1000 rpm. Afterward, the chitosan-coated Fe3O4 nanoparticles (C-Fe3O4) were separated from the solution with the help of the external magnet. The product was cleaned and dried in an oven.
Whereas the rGO functionalized Fe3O4 nanocomposites (G-Fe3O4) were obtained by their mechanical mixing (using mortar and pestle) and subsequent heat treatment at 450 °C for 1 h in the nitrogen atmosphere. The as-mentioned heat treatment helps in enhancement of interfacial bonding between the Fe3O4 nanoparticle and rGO.
Characterization
XRD spectra of Fe3O4 nanoparticles were collected using Panalytical X’pert Pro multipurpose diffractometer (MPD; Malvern Panalytical Ltd., Royston, U.K.) in Bragg–Brentano geometry with X’celerator detector with Cu Kα (λ = 1.5406 Å) radiation (45 kV, 30 mA). The measurements were recorded in the 2θ range of 25–70° with 0.2° step size and 30 s time per step. Detailed microstructural and chemical analysis of IONPs were carried out using TITAN G2 60–300 kV TEM/STEM (FEI, Eindhoven, Netherlands). The high-angle annular dark-field scanning transmission electron microscopy (HAADF-STEM) technique coupled with EDS was used for the elemental mapping/chemical analysis. HRTEM, SAED patterns, and corresponding IFFT images were obtained for phase analysis. The size of each Fe3O4 particle from dark-field TEM image was measured using ImageJ (v1.52 h) software package after which the particle size distribution histogram was made. The M–H hysteresis curve for Fe3O4 and G-Fe3O4 was obtained using Lakeshore VSM 7410 in the range of −15 kOe to +15 kOe applied magnetic field. The TGA of Fe3O4, rGO, and C-Fe3O4 was carried out using PerkinElmer Diamond TG/DTA (USAA). The thermal stability of samples was examined in the temperature range of 30–800 °C with a heating rate of 10 °C/min in a nitrogen atmosphere. Raman Spectra for rGO, Fe3O4, and G-Fe3O4 was recorded using LabRam HP 800 UV Raman spectrometer. The vibrational modes were obtained in the range 800–3200 cm−1 using He-Ne laser, 632 nm excitation source.
Anticancer and antibacterial activity
In vitro cytotoxicity
Cell proliferative studies were conducted on seven different human cancer cell lines taken from various organs, namely, K-562 (erythromyeloblastoid leukemia), PC-3 (h prostate carcinoma), A-431 (epidermoid carcinoma), MDA-MB-231 (ER− breast carcinoma), COLO-205 (colon carcinoma), MCF-7 (ER+ breast adenocarcinoma), and A-549 (lung carcinoma). The cells were seeded in flat-bottom 96-well plates at desired density (2 × 10³) in 100 µL of the medium. The materials were sterilized by dissolving in DMSO, and the solutions were filtered through a 0.22-μm filter. Cells were treated with 2 µg/mL, 10 µg/mL, and 50 µg/mL of test material (Fe3O4, C-Fe3O4, and G-Fe3O4) and incubated for 24 h. 20 µL of MTT solution (5 mg/mL) was added to each well (i.e., 50 µg/well) and incubated at 37 °C for 4 h before the termination of the assay. The culture medium of plates was decanted on blotting paper, and 150 µL of DMSO was added to each well. The plates were agitated on a plate shaker for 5 min, and optical density was measured at 570 nm with the help of spectrophotometer (Thermo Fisher Scientific, Waltham, Massachusetts). Cell viability was calculated by comparing absorbance of treated versus untreated cells. Growth inhibition was calculated by subtracting cell growth from 100.
Antibacterial activity
The antibacterial activity was tested against a panel of pathogenic bacteria, which were purchased from Microbial Type Culture Collection (MTCC) of CSIR-IMTECH, Chandigarh, India. Lyophilized bacterial strains were cultured overnight at 37 °C in nutrient broth (Himedia Ltd., Mumbai, India). Each of the bacterial strain was revived in liquid media for experimentation. The turbidity of the log phase was adjusted to 0.5 McFarland equivalents (approximately 1–2 × 10⁸ cfu/mL). Antibacterial activity of Fe3O4, C-Fe3O4, and G-Fe3O4 was examined against various Gram-positive bacteria viz., Staphylococcus aureus (SA, MTCC96), Streptococcus pyogenes (SP, MTCC442), Bacillus subtilis (BS, MTCC121), Streptococcus mutans (SM, MTCC890), and Enterococcus faecalis (EF, MTCC439), as well as Gram-negative bacteria, namely, Salmonella typhi (ST, MTCC733) and Escherichia coli (EC, MTCC723). The antibacterial activity of synthesized nanoparticles was determined in terms of minimum inhibitory concentration (MIC; a quantitative analysis) and zone of inhibition (ZOI; a qualitative analysis). For determining MIC, two-fold serial dilution technique was used against the bacterial strains [Reference Srivastava, Darokar, Fatima, Kumar, Chowdhury, Saxena, Dwivedi, Shrivastava, Gupta, Chattopadhyay, Luqman, Gupta, Negi and Khanuja61]. For the experiments, 10 wells of 96-well plates in series were filled with a broth containing nanoparticles in such a way that the concentration of the solution in the subsequent tube reducing to one-half, 11th, and 12th well were used as untreated and media vehicle control, respectively. The tests were performed individually on three test compounds, namely, Fe3O4, C-Fe3O4, and G-Fe3O4. The test compounds were added to the first well of each row simultaneously (in three separate test tubes) and mixed thoroughly. From the above three test tubes, half of the media containing test molecules were transferred to the 2nd set of test tubes and mixed gently. The same procedure was repeated till the 10th well. Properly diluted log phase culture of bacteria (10 μL, test organism) with a titer of 104 cfu/mL was added to each of the wells mentioned above. The procedure was followed with tubes incubation at 37 °C, and then turbidity was measured.
ZOI was determined by a disc diffusion assay method [Reference Luqman, Dwivedi, Darokar, Kalra and Khanuja62]. The process starts with the preparation of bacterial inoculums from 24 h overnight cultures in nutrient broth solution with the turbidity of 1.5 × 10⁸ cfu/mL. 100 μL aliquots of inoculums (divided samples of IONPs) were put on agar plate surface by using sterile glass spreader. A paper disc (Whatman filter paper 3) of 5 mm diameter taken with 5 μL of test molecule from 100 mg/mL stock was kept. The disc was then air-dried and placed on the nutrient agar plates. The plates were incubated at 37 °C for 16–24 h. The ZOI of complete bacterial growth was then calculated in mm.
Acknowledgments
The authors are grateful to Mr. S.L. Gadge for his constant support and motivation for the work. Mr. Devthade Vidyasagars’s extended support is uncountable. The SAIF-IIT Bombay support for TGA experiments is greatly acknowledged.