Feral cereal rye is an aggressive, persistent winter annual grass that evolved from cereal rye (Burger et al. Reference Burger, Sky and Ellstrand2006). Feral rye differs phenotypically from cereal rye in that it has smaller seeds, thinner culms, delayed flowering (Burger et al. Reference Burger, Holt and Ellstrand2007), and a shattering inflorescence. Feral rye survives extreme conditions and can complete its life cycle with as little as 13 cm of precipitation and winter temperatures as low as −35 C without snow cover (Burger and Ellstrand Reference Burger and Ellstrand2005). It has a more extensive root system than cereal grains and has been reported to root to depths of 1.0 to 1.5 m before entering fall dormancy (Nalborczyk and Sowa Reference Nalborczyk and Sowa2001). These traits make feral rye highly competitive in crop and non-crop settings. In Oklahoma, predicted yield losses due to feral rye in hard red winter wheat (Triticum aestivum L.) were reported at much higher values than losses due to wild oats (Avena fatua L.), jointed goatgrass (Aegilops cylindrica Host), Italian ryegrass [Lolium perenne ssp. multiflorum (Lam.) Husnot], or cheat (Bromus secalinus L.) (Fast et al. Reference Fast, Case and Murray2009), indicating that feral rye is more competitive than these species.
Management Implications
Feral cereal rye has been a weed of Utah cropland and roadsides for many years. Now, in northern Utah, feral rye has been observed to spread up non-crop foothills and dominate south- to west-facing slopes. Human-related seed dispersal and disturbance has been limited, with the exception of occasional fire, due to steep slopes. Photos from 1990 indicate that the expansion has occurred rapidly. Measurements of patch expansion along the leading edge of the infestation indicate that feral rye continues to spread rapidly at high elevations and at great distances from the original source. The threat of feral rye competition displacing native grasses and forbs on south- to west-facing slopes in natural areas in northern Utah is high. Due to relatively short seed longevity and the small size of current infestations, feral rye may be good candidate for early detection/rapid response management efforts.
Cereal rye has been cultivated in North America for centuries. Feral rye has been documented in all U.S. states and most Canadian provinces (Anonymous 2016; Bushong Reference Bushong2008; Hitchcock Reference Hitchcock1922; U.S. Department of Agriculture 2016). In 1876, cereal rye was produced on 180 ha in Utah Territory, and by 1883, cereal rye production had increased to 257 ha in Cache County alone (Sloan Reference Sloan1884), providing ample opportunity for the crop to escape cultivation. For many years feral rye has been recognized as a weed in Utah cropland; however, it was not described as a weed in non-cropland in Utah (Burger and Ellstrand Reference Burger and Ellstrand2005) prior to a preliminary study by Roerig and Ransom (Reference Roerig and Ransom2009). In the fall of 2008, feral rye had expanded across large areas of the upland hillsides near Logan, in Cache County, Utah. The dominant native grass on these hillsides is bluebunch wheatgrass [Pseudoroegneria spicata (Pursh) Á. Löve]. A few small patches low on the foothills were noticeable in photos taken in 1990. By 2008, those patches had expanded and gained considerable elevation. Now each summer through the end of fall, much of the hillside above Cache Valley, Utah, is covered in distinctive yellow patches of the expanding feral rye population. Previous to the current study, analysis of a single photo from 1990 and a photo from 2008 showed that within the photographed area, feral rye had expanded 304% in 18 yr, or about 17% each year (Roerig and Ransom Reference Roerig and Ransom2009). This study seeks to document the rate of feral rye expansion on non-crop hillsides in northern Utah at the patch and landscape scale.
Materials and Methods
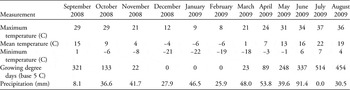
Expansion of feral rye populations on the foothills east of Logan, Utah, was measured using individual patch- and landscape-scale approaches. The patch data and landscape photos were taken in the same geographical area on the western flank of the Bear River Range, starting near Logan Canyon and going north 7.5 km to Hyde Park Canyon. Monthly weather data from the 2008 to 2009 growing season at the Logan–Cache Airport, approximately 6.5 km west of the infestation, are presented in Table 1.
Monthly weather data for the 2008–2009 growing season from the Logan–Cache Airport, approximately 6 km west of the feral rye infestation.

Patch-Scale Expansion
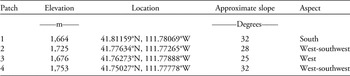
Patch-scale expansion was evaluated at four locations. Selected patches were at the leading edge of the infestation, with distinct borders and enough distance from other patches that merging would be unlikely. Location, approximate elevation, approximate slope, and aspect of the patches are shown in Table 2. These four sites were marked by corner stakes and by GPS in 2008 to ensure they could be relocated and measured the following year. The sites were mapped using a 0.09-m2 grid system established in the fall of 2008. If one or more plants were observed within a given 0.09 m2, that area was recorded as infested. Measurements were taken each year until an area free of feral rye was reached. Each patch had a minimum separation of approximately 10 m from the nearest neighboring patch to ensure that measurements would only reflect the expansion of a single patch. In general, this approach was successful, and patches did not merge. However, due to greater than anticipated expansion at site four in 2009, the lower edge did not have a distinct border. As a result, a midpoint between downward expansion of the patch of interest and the upward expansion of a lower infestation was estimated. The midpoint was estimated as the point where the population of the measured patch stopped decreasing and the population of the neighboring patch began increasing. All measurements were taken in late summer when plants had completed their life cycle.
Location and elevation of four hillside feral rye patches evaluated to determine annual expansion rates.

The presence or absence of feral rye at each patch was recorded as X, Y, Z data. X and Y provided grid coordinates for each sample point, while Z indicated the infestation value (0=noninfested, 1=infested). Data were imported into ArcGIS 10 as point features for further analysis. A final infestation value for each point was determined by overlaying data from 2008 and 2009. The value 0 represented a point that was not infested in either year, the value 1 represented an infested point in 2008 that was no longer infested in 2009, the value 2 represented a point with a new infestation in 2009, and the value 3 represented a point that was infested in both years. Changes in the number of infested cells from 2008 to 2009 were used to calculate expansion at each patch. A visual representation of patch expansion was created using a conversion tool that converted point data into a raster data set with a cell size of 30 by 30 cm.
The initial point data for each patch and year were used to calculate distance and direction statistics in ArcGIS 10. All calculations were based upon proximity of each newly infested cell to the nearest previously infested cell. Point data were rasterized, and the Spatial Analyst Euclidean Distance Tool was used to create distance and direction rasters for the first year’s data. The cells in these rasters overlaying infested cells in the second year were saved, while others were set to null. The direction statistics are simply the attribute table from the final direction raster and provide a count of the number of grid cells that moved in a given direction. A comparison of patch movement upslope versus downslope was then calculated by removing all patch numbers at 90° and 270° from the final count, because they were stable in those directions. Similarly, expansion to the left versus the right was determined by removing all patch numbers recorded at 360° and 180°. For each comparison, the percent expansion in either direction was then calculated. To generate distance statistics, a zonal raster was created based on computed distances in the final distance raster, and statistics were computed using the Spatial Analyst Zonal Statistics as Table tool.
Landscape-Scale Expansion
To determine feral rye expansion on a landscape scale, a series of photographs were taken at several locations in 2008. Photographs were taken with a digital camera mounted on a tripod using an 80- to 200-mm lens and encompassed an area of approximately 0.33 to 1 km2. The photographs were taken from the same location and cropped to the same area each year. Images from five locations were analyzed using image analysis software (VegMeasurement, v. 1.6.0, Oregon State University, Corvallis, OR) that identified feral rye based on its distinctive color. The analysis used a brightness algorithm (Johnson et al. Reference Johnson, Vulfson, Louhaichi and Harris2003), and thresholds were individually adjusted for each image to accurately depict feral rye infestations. The software then calculated the percent of pixels in each image comprised of feral rye. While sets of images differed in the distance from the camera to the infestation, and in the total area encompassed by the image, the relative change between photos taken from the same locations in 2008 and 2009 provided an indication of expansion.
Results and Discussion
Patch-Scale Expansion
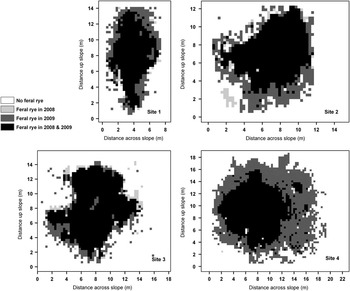
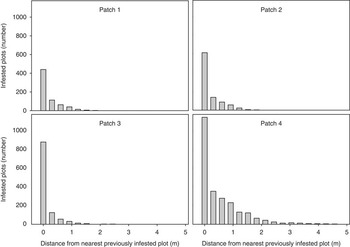
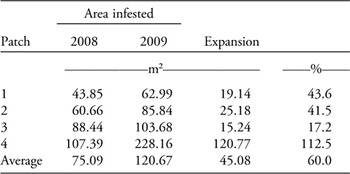
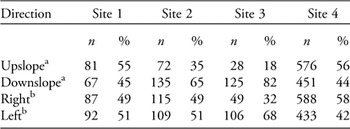
Expansion at the four patches ranged from 17% to 113% with an average of 60% between 2008 and 2009 (Table 3). Expansion at each patch is shown in Figure 1. Most of the newly infested grid cells occurred within 1 m of the original patch (Figure 2). Expansion occurring around the original infestation suggests incremental expansion from an initial point of introduction. The greatest expansion occurred at patch 4, which was the highest elevation in this infestation, suggesting that elevation may not yet be a limiting factor for this feral rye expansion. At patch 1, few, if any, perennial grasses or other native plants were observed. Some portions of this patch were so rocky that soil was not visible or easily uncovered, yet feral rye was able to occupy areas apparently uninhabitable by other plant species. Expansion of these patches occurred in all directions, up- and downslope and right and left (Table 4).
Illustration of feral rye expansion from 2008 to 2009 at each site.

Histogram of distance of cells infested with feral rye in 2009 from cells infested in 2008.

Expansion rates of feral rye patches 1 yr after initial measurement using a grid system.

Comparison of the direction of spread for new cells infested with feral rye in 2009 at each site.

a All infested cells located at 90° and 270° removed from calculations.
b All infested cells located at 180° and 360° removed from calculations.
Landscape-Scale Expansion
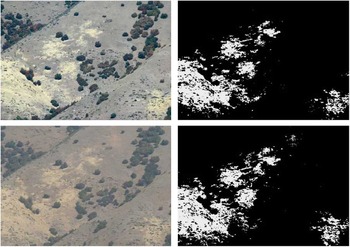
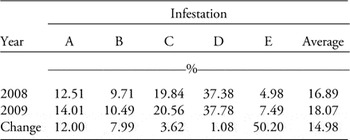
Analysis of changes between 2008 and 2009 photographs (Figure 3) showed feral rye expansion of 1%, 4%, 8%, 12%, and 50%, with an average for the five photographs of 15% (Table 5). Generally lower estimates in expansion, as measured by the landscape photo method compared with the patch method, may have been for two reasons. First, the photo method was focused on extensive infestations where much of the photo was already occupied by feral rye or beyond the distance feral rye would be likely to travel in 1 yr, whereas the patch-scale measurements were made on isolated patches surrounded by unoccupied area that could potentially be invaded. Second, there is a potential for distortion caused by the relative distance of patches from the camera within the same photo and the angles associated with ground-based photos of steep hillsides. Areas closer to the camera appear larger, and changes in the foreground have a disproportionally large influence on the rate of expansion. Distortion of land-based photos of steep slopes would be similar to that associated with aerial photos, where increasing slope angles result in underestimates of total land area; as much as 17% to 31% for slopes from 30° to 40° (Anderson Reference Anderson1972). While these data do not indicate a percent expansion in terms of land area, they do serve to confirm expansion is occurring and that it is occurring on a landscape level.
Example of photos (left) and corresponding processed images (right) taken in 2008 (top) and 2009 (bottom) and used to calculate percent change in infested area (“A” in Table 5).

Changes in the percent of the landscape infested by feral rye calculated from photographs taken in 2008 and 2009.

Factors Explaining Feral Rye Expansion
No direct observations have been made to determine the factors contributing to the steady expansion of feral rye patches and their movement up hillsides. However, at a patch scale, measurements showed that the majority of new infestations occurred within only 0.91 m of a previously infested area, and expansion was roughly equal up- and downslope and left and right (Figure 2). This expansion suggests the shattering seed head of feral rye plays an important role in the steady rate of expansion. Although occasionally disturbed by fire, human impact has been generally limited due to the extreme slope of these sites. Thus, it is likely the main factors contributing to long-distance seed dispersal are related to animals or other nonhuman factors. Sowell (Reference Sowell1981) noted the winter diet of mule deer (Odocoileus hemionus) in the Texas Panhandle consisted of 27% cereal grains when deer populations were located near grainfields. This suggests endozoochorous or epizoochory movement as a possible mechanism for seed dispersal.
The greatest expansion and patch movement was observed on steep, southern aspects, where limited desirable vegetation was present. Feral rye is not present on north-facing slopes. Northern slopes accumulate greater amounts of snow over the winter and are subject to less heat in the spring and summer, which increases the available water compared with south-facing slopes. South-facing slopes are also subject to colder winter temperatures due to more frequent snowmelt. These conditions favor a plant like feral rye, which can access deep soil moisture, uses little water, and survives extremely cold temperatures. In many places, a distinct line was observed between aspects suitable and unsuitable for feral rye invasion. The observation of a distinct line is consistent with the findings that the harshness or other unique attributes of an environment can significantly reduce its ability to be invaded by weeds (Williamson and Harrison Reference Williamson and Harrison2002); however, in the case of feral rye, a harsh environment seems to favor infestation. Much greater native species diversity and density were observed on northern slopes, and this may play a role in the exclusion of feral rye. Downy brome (Bromus tectorum L.) was unable to establish in forest sites in northern Idaho and eastern Washington after repeated introduction, while other areas in the region are infested (Pierson and Mack Reference Pierson and Mack1990). Likewise, the greater biodiversity of north-facing slops may be preventing invasion, even though introduction is presumably occurring.
In areas where feral rye has expanded and become established, few other plants were observed. This could be due, in part, to allelopathy. The allelopathic properties of feral rye were first identified by Barns and Putnam (Reference Barns and Putnam1986). It is likely other species are affected by the toxins released as feral rye shoots decompose, further excluding competition and contributing to the formation of a monoculture. High rates of rye residue could also reduce the emergence of other species (Mohler and Teasdale Reference Mohler and Teasdale1993).
Feral rye is expanding at a rate detectable within a single growing season. Further, its occupation of high elevations up to 372 m above the 1,382 m elevation of the valley and of undisturbed natural areas and the potential loss in plant diversity are causes for concern. In one study, less than 1% of seed in the soil was viable after 45 mo; however, after 5 yr feral rye was still observed to germinate (Stump and Westra Reference Stump and Westra2000). The relatively short seed longevity of feral rye and current small infestations in some areas make it a good candidate for early detection/rapid response measures. Moody and Mack (1988) found weed control efforts centered on satellite patches to be more effective than trying to control larger patches. Management of feral rye should start with smaller patches located along the perimeter of the infested area. Through aggressive control measures and careful monitoring, managers can reduce the size of existing infestations and limit further uphill expansion that would displace native plants in the Cache National Forest and other similar areas.
Acknowledgments
The authors gratefully acknowledge the contributions of Stephanie Durfee Christensen for the assistance in collection of data and editing of the paper. Partial funding was provided by the Weed Science Society of America Undergraduate Research Award, and Utah Agricultural Experiment Station publication no. 8973.