1. Introduction
The environmental Kuznets curve (EKC) hypothesis was popularized by the 1992 World Development Report as an explanation of pollution trends observed in much of the developed world. The hypothesis holds that in the early stages of economic development pollution increases along with income, but after countries reach some critical level of development pollution declines even as incomes continue to rise. The important implication of the EKC hypothesis is that environmental degradation is not the inevitable consequence of the development process, but, rather, economic growth can serve as a significant driver of environmental improvements. Indeed, substantial anecdotal evidence and empirical research suggests that pollution and income are not directly and monotonically linked.
A burgeoning literature has emerged testing the validity of the EKC for various pollutants and other measures of environmental degradation.Footnote 1 Empirical research generally tests for an inverted U-shaped EKC by estimating a reduced form quadratic equation in which the environmental measure serves as the dependent variable and the log of income and income squared enter as explanatory variables. The resulting equation is then used to calculate the income level at which pollution is expected to peak. Researchers have often included additional variables such as income inequality, population density, political measures, and trade openness in their reduced form equations to provide additional explanatory power.
Given the implications for global climate change, the EKC hypothesis is especially germane in the context of carbon dioxide (CO2) emissions and the various policies designed to reduce them. While many studies point to the existence of an inverted U-shaped EKC for several localized pollutants, no consensus has been reached on pollutants with such global scope. Early research by Holtz-Eakin and Selden (Reference Holtz-Eakin and Seldon1995) and Cole et al. (Reference Cole, Rayner and Bates1997) showed peak per capita CO2 emissions occurred at per capita income levels of $35,428 and $25,100 respectively for a similar sample of countries. However, these results rely critically on model specification, with upper bounds on the estimates being $8 million and $67,500 respectively.Footnote 2
Recent evidence of an EKC for CO2 is mixed at best. Using a non-parametric estimator, Bertinelli and Strobl (Reference Bertinelli and Strobl2005) reject the hypothesis of an inverted U-shaped EKC in favor of a monotonically increasing EKC for CO2 emissions. Friedl and Getzner (Reference Friedl and Getzner2003) find evidence of an N-shaped relation between GDP and CO2 emissions in Austria. Using a random coefficients model, Cole (Reference Cole2005) shows an EKC which peaks only at extremely high per capita income levels for a restricted set of countries. Galeotti et al. (Reference Galeotti, Lanza and Pauli2006) similarly conclude that the countries sampled affect EKC results. Dijkgraaf and Vollebergh (Reference Dijkgraaf and Vollebergh2005) also challenge the existence of an EKC for CO2 and express concern about commonly applied cross-country homogeneity assumptions. Stern (Reference Stern2004) suggests that econometric inconsistencies and biased samples may have driven previous EKC results and recommends researchers move beyond reduced form equations which limit the ability of researchers to understand the underlying forces at work, determine their relative magnitudes, and make appropriate policy prescriptions. So while empirical tests of the existence of EKCs for various pollutants may still be of interest, it is illustrative to delve into the structural mechanisms that drive the findings.
The theoretical literature, based mainly on structural models developed by Grossman (Reference Grossman, Goldin and Winters1995) and de Bruyn (Reference de Bruyn1997), highlights three main linkages between pollution and economic activity. The first linkage, the scale effect, implies that an increase in the magnitude of the economy's outputs and inputs will increase pollution commensurately. Individually, this effect is consistent with monotonically increasing emissions. The second linkage, the composition effect, is based on differences in growth rates and emission intensities across an economy's various sectors. Industrialization may increase emissions per unit of output, while an expansion of the tertiary sector is expected to reduce them. Similar changes in an economy's input combination, notably energy usage, will also occur in conjunction with compositional shifts on the output side. However, the composition effect itself cannot lead to infinite reductions in pollution, only to short-run deviations from an upward trend caused by the scale effect.Footnote 3 The final effect, the technology or productivity effect, generally implies that if a clean environment is income elastic, then as incomes increase, society's desire for a cleaner environment manifests itself, through the legislative process and/or pressure from environmental or consumer groups, in the form of cleaner or more efficient production technology. Improved technology allows a country to acquire larger amounts of output even while pollution is reduced. In the long run, it is the productivity effect that drives environmentally sustainable development.
The EKC hypothesis can be explained by the differing magnitudes of these three effects at various levels of development. At low levels of income, a large-scale effect combined with a pollution-producing composition effect may outweigh any minor technology effect, leading to increased pollution as income increases. As incomes continue to grow, however, a muted scale effect may be outweighed by a pollution-saving composition effect and an emergent technology effect, thus lowering emissions. Interaction of these three effects produces the inverted U-shaped EKC, with pollution peaking at some critical per capita income level.
At least two methods are available for investigating the relative magnitudes of the three pollution-income linkages described above. The first method uses an index numbers approach to calculate the various effects by meticulously compiling detailed sectoral data on fuel use and energy and pollution intensities. Unfortunately, such data may not be readily available in many cases. Hamilton and Turton (Reference Hamilton and Turton2002) provide this type of decomposition for CO2 emissions in nine OECD countries. The second method involves estimation of a global production frontier using linear programming or econometric techniques. The various linkages are then inferred from the estimated production relationships. Stern (Reference Stern2002) uses this type of analysis to decompose sulfur emissions into their proximate causes for a large sample of countries. Zaim and Taskin (Reference Zaim and Taskin2000) and Fare et al. (Reference Färe, Grosskopf, Zaim, Färe and Grosskopf2004) take a similar tack, using data envelopment analysis, a form of non-parametric frontier analysis, to calculate CO2-adjusted efficiency in OECD countries. However, they do not attempt to decompose these environmental efficiencies into pollution-income linkages.
This paper continues in the frontier analysis vein, using two parametric techniques, deterministic frontier analysis (DFA) and stochastic frontier analysis (SFA), to decompose CO2 emissions from a panel of OECD countries. The output distance function model we employ has an advantage over the index numbers approach in that it requires less detailed data on emission and energy intensities, which may not be available at the sectoral level. However, its flexibility is also a disadvantage. Since the relationships between inputs and outputs (including CO2) are estimated internally, the technique generates implied sectoral emission rates and energy intensities that may or may not reflect their true values; however, this technique represents a theoretically valid approach to overcoming the lack of more specific data.
In the next section we model the aggregate production relationship using a multiple-output, multiple-input Shephard output distance function framework. The data and estimation procedures are then described in section 3. The results, presented in section 4, are used to decompose historic changes in CO2 into their underlying scale, composition and productivity effects. We then use these results to assess the likelihood of the EKC hypothesis for CO2. Finally, in section 5, we provide brief conclusions.
2. Model
Output distance function
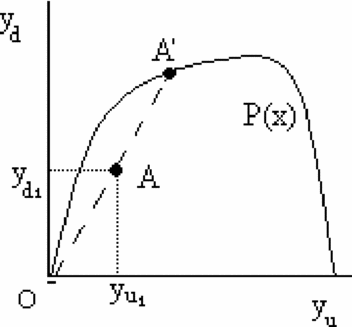
Assume an economy's aggregate production follows a multiple-input, multiple-output process in which a set of x ∈ ℜN+ inputs is transformed into y ∈ ℜM+ outputs. Further, assume that a closed and bounded output set, P(x), encompasses all feasible output bundles. This output set is depicted graphically in figure 1. In such a multi-dimensional context a Shephard (Reference Shephard1970) output distance function provides a convenient framework for representing the production technology. In figure 1, point A represents the observed combination of outputs y 1 and y 2 produced from input vector x. The output set P(x) represents the efficiency locus for the given input vector. Points on the P(x) locus are technically efficient, while points in the interior represent an inefficient production combination. The output distance function measures the maximum scalar, θ, by which all output could be expanded and still allow the observation to remain in the feasible set. For observation A this is represented as (OA/OA′).
Output distance function
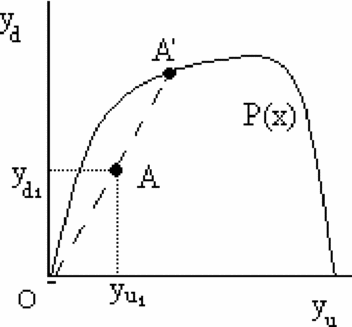
The output distance function is expressed mathematically as

For each observation, the distance function measures the largest feasible radial output expansion, θ, given the current input vector. Observations on the frontier of P(x), have distance function values of unity and are productively efficient. Less efficient observations generate distance function values less than unity, with the result representing the inverse of Farrell's (Reference Farrell1957) output-oriented technical efficiency measure. The primary advantage of an output distance function framework over a simple production function approach in this context is the flexibility it offers for incorporating multiple inputs and outputs, thus contributing to a more complete rendering of the aggregate production relationship. Distance functions have been used extensively in the literature to model multiple-input, multiple-output production processes in the presence of one or more undesirable outputs. Examples include: Coggins and Swinton (Reference Coggins and Swinton1996) for US electricity production, Hailu and Veeman (Reference Hailu and Veeman2000) for Canadian pulp and paper production, Rezek and Perrin (Reference Rezek and Perrin2004) for Great Plains agriculture and Färe et al. (Reference Färe, Grosskopf, Lovell and Yaisawarng1993) for US pulp and paper production. The distance function also provides a mechanism by which the scale, composition, and productivity effects can be disaggregated.
Structural decomposition
As a functional relationship between inputs and outputs, the output distance function can be used to decompose changes in emissions into their constituent components. For ease of exposition, let the output vector y consist of a sub-vector of desirable outputs, y d, and a single undesirable by-product, yu. Equation (1) generates an efficiency measure for each observation as given by

where y d = desirable output vector, yu = undesirable output, x = input vector, and t = technology. Implicitly solving equation (2) for yu gives an inverse output distance function, with the undesirable by-product specified as a function of the desirable outputs, inputs, technology, and efficiency. The inverse distance function equation is given in general form as

This function describes emission levels in terms of aggregate output production, input usage, the state of technology, and the economy's overall efficiency.
In preparation for empirical decomposition, we take the total differential of equation (3) thus isolating the approximate effects of changes in each of these variables individually. This results in

Using taxonomy similar to Grossman (Reference Grossman, Goldin and Winters1995) we decompose equation (4) into three components, the scale effect, the composition effect, and the productivity effect.
The scale effect refers to the change in emissions resulting from changes in the scale of production, abstracting from any changes caused by substitutions between outputs or between inputs, or changes in technology or efficiency. Mathematically, the scale effect is defined here as
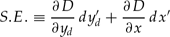
where dy′d is an equiproportional change in all outputs and dx′ is an equiproportional change in all inputs.
The composition effect demonstrates how emissions change due to the shifting bundle of inputs and outputs, without consideration for changes in the overall scale of economic activity or any efficiency or technical changes in the economy. The composition effect is defined as

where dyd and dx are the observed changes in outputs and inputs respectively. The first bracketed term calculates the change in emissions resulting from actual changes in outputs and inputs, while the second term removes any effects resulting from changes in the scale of production alone. Summing the scale and composition effects yields the first two terms of equation (4).
The third term in equation (4) describes how the undesirable by-product changes as a result of changes in technology, with time serving as a proxy for technological change. The final term in the equation represents the change in emissions resulting from changes in efficiency. While the pure technology effect is well established in the literature, the efficiency component is perhaps overlooked. An important theoretical contribution of the distance function framework in this context is the explicit recognition that emission levels may change due to both technological improvements and changes in productive or environmental efficiency. We combine the pure technology and efficiency components and refer to the joint effect as the productivity effect. This is defined as
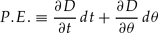
Together, the scale effect, composition effect, and productivity effect constitute a complete decomposition of the emission changes shown in equation (4).
3. Empirical estimation
Data
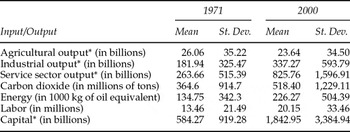
For this analysis we construct a three-input, four-output production model. Data were gathered for a panel of 21 OECD countries from 1971 to 2000. The outputs, gleaned from the World Bank's World Development Indicators 2003 CD-ROM (WDI), are: agricultural output, industrial output, and service sector output, all measured in 1999 (PPP) dollars, and CO2 emissions measured in tons. Inputs include physical capital stock – gathered from the Penn World Tables (Heston et al., Reference Heston, Summers and Aten2002) and augmented with recent estimates from the Extended Penn World Tables (Marquetti, Reference Marquetti2004) – labor force and commercial energy use – both gathered from the WDI. The descriptive statistics for the first and last years of the sample are shown in table 1.
Descriptive statistics (1971 and 2000)

Note: *1999 PPP dollars.
Deterministic frontier analysis
We first calculate the distance function shown in equation (2) using DFA. With this widely used approach a specific functional form for the distance function is selected and linear programming techniques are used to calculate its parameters in lieu of standard regression analysis. The main advantage of this methodology over the SFA approach described below is that it allows several important properties of the distance function to be readily incorporated into the model using equality and inequality constraints. Specifically, theory requires the output distance function to be non-decreasing in good outputs, non-increasing in inputs, and homogeneous of degree 1 in outputs. Conversely, the drawback to this approach is the lack of a stochastic component – all error is assumed to represent inefficiency. DFA results can therefore be sensitive to data outliers.
For empirical tractability and to ensure a unique solution, we specify two slight variants on a Cobb–Douglas functional form for equation (2) as

and

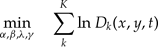
where C= y u = ln CO2, S = ln services, I = ln industry, A = ln agriculture, E = ln energy, L = ln labor, K = ln capital, and t = time. Using the Aigner and Chu (Reference Aigner and Chu1968) approach, the GAMS software package is employed to solve the linear program
subject to:





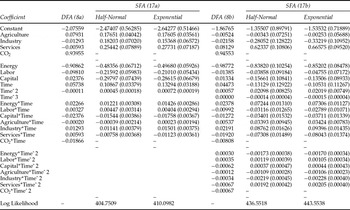
where the panel is T periods in length consisting of K cross-sections. Restriction (10) requires that each observation remain in the feasible set. Equations (11) and (12) ensure that the distance function is non-decreasing in outputs and non-increasing in inputs. Equations (13) and (14) impose homogeneity of degree 1 on outputs. The calculated parameters of the output distance function using DFA are given in columns 2 and 5 of table 2.
Output distance function parameter estimates, DFA and SFA

Note: Standard errors in parentheses for SFA estimates.
Stochastic frontier analysis
We employ the LIMDEP package to estimate the distance function econometrically using SFA. Estimation of equation (2) using SFA poses difficulties since the dependent variable is unobserved; however, the output distance function's homogeneity property can be used to circumvent this obvious shortcoming. Dividing the dependent variable and each of the desirable outputs by the undesirable output imposes homogeneity of degree 1 on outputs. In logs, this transforms equation (2) into

Rearranging equation (15) gives

where θ is now reminiscent of a typical error term.
In SFA, this error term is divided into two components: u, a normally distributed random error term and, v, a one-sided error term representing inefficiency. In this analysis we run two models, one specifies the one-sided error term as following a half-normal distribution and the other an exponential distribution. Applying two variations of the Cobb–Douglas functional form to equation (16), the four-output, three-input model is formulated as

and

where S* = ln services – ln CO2, I* = ln industry – ln CO2, A* = ln agriculture – ln CO2, u = normally distributed random error term, and v = one-sided error term (inefficiency). The estimated parameters of equations (17a) and (17b) are given in table 2. Columns 3 and 4 show the results if v is assumed to follow a half-normal distribution and columns 6 and 7 show the results if v is assumed to follow an exponential distribution.
4. Results
Model comparisons
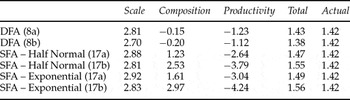
Using the estimated parameters shown in table 2, changes in CO2 emissions over the sample period are decomposed empirically as specified in equations (5), (6), and (7). To compare across models, the decompositions are depicted in table 3 in terms of the average annual percentage change over the 21 country sample. Column 2 shows that each of the six models is in agreement regarding the scale effect. Carbon dioxide emissions increased by an average of about 2.80 per cent annually from 1971 to 2000 due to increases in overall economic activity.
Model comparisons

Columns 3 and 4 depict the composition and productivity effects, respectively. These effects differ substantially across the DFA and the SFA models. Column 3 shows that, according to the DFA results, changes in economic structure led to a reduction in CO2 of about 0.15–0.20 per cent per year over the period, but according to the SFA results the composition effect was CO2-producing, with estimates reaching nearly 3 per cent per year. The productivity effect, shown in column 4, is unambiguously CO2-saving but its magnitude differs substantially depending on estimation approach and model specification. According to the DFA results, productivity improvements over the period led to an average reduction in CO2 of about 1.2 per cent annually, but SFA results show productivity improvements reduced CO2 emissions by much larger amounts, ranging from 2.64 per cent to 4.24 per cent annually. The differences between the DFA and SFA results are driven by the methods used to arrive at the parameters. Specifically, the DFA model explicitly imposes the inequality constraints shown in equations (11) and (12) on the output distance function, but the SFA model does not.Footnote 4
Summing columns 2, 3, and 4 of table 3 gives the estimate of the total annual percent change in CO2 for the panel. The DFA results, especially those calculated from the specification in equation (8a), compare favorably with the actual increase in CO2 emissions observed during this period (1.42 per cent annually), while the SFA results consistently overestimate CO2 reduction. This result is not unexpected since the SFA results incorporate a stochastic error component, which necessarily generates a gap between the estimated change in CO2 and the observed change. Of the four SFA models, the half-normal specification based on equation (17a) provides the best fit in terms of how its decomposition performs in predicting actual emission changes.Footnote 5 The country specific analyses in the next sections are therefore based on this model and the DFA model 8a.
DFA results
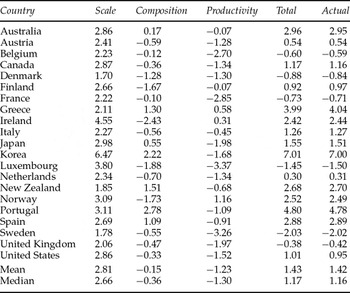
For ease of multilateral comparison, the country-specific DFA results in table 4 are also displayed in terms of average annual percentage change. Column 2 shows the scale effect, which ranged from 1.70 in Denmark and 1.78 in Sweden to 4.55 and 6.47 in rapidly growing Ireland and Korea. The composition effect, depicted in column 3, was pollution-saving in two thirds of the countries in the sample. Ireland reduced emissions by nearly 2.5 per cent per annum due to the shifting structure of its economy, while Korea and Portugal experienced large increases in CO2 emissions due to composition effects. Finally, the productivity effect generated reductions in CO2 emissions in 18 countries over the sample period, but this CO2-saving effect exceeded the CO2-producing scale effect in only three countries: France, Belgium and Sweden.

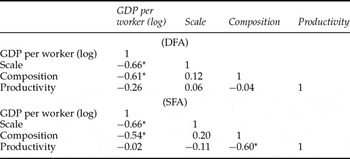
For an inverted U-shaped EKC to develop, the productivity effect (and possibly the composition effect) must initially be smaller than the scale effect, then larger as income grows. It is illustrative, therefore, to investigate the relationship between income and the magnitude of each of the effects. To do this, we calculate the correlations between the initial per capita income levels and the subsequent scale, composition, and productivity effects. The results are depicted for the DFA model in the top panel of table 5. There exists a strong negative correlation between an economy's initial income level and the scale effect experienced over the next 30 years. This implies that higher income economies tend to generate slower growth, and a smaller scale effect, while lower income economies grow more rapidly, generating a larger scale effect. Korea, Ireland, Portugal, and Spain, for example, were all relatively poor countries that produced large amounts of CO2 through the scale effect due to their rapid ascendancy.
Correlations between initial output per worker and EKC effects

Note: *correlation is significantly different from zero at a 5% level.
There is also a strong negative correlation between initial income level and the composition effect. Those countries beginning at the lower end of the income scale tended to see a shift toward more CO2-intensive production during the period, exemplified by the positive composition effects. Korea, Greece, Portugal, and Spain are such examples. An interesting exception is Ireland, which, despite starting as a lower income country, experienced a shift toward CO2-saving production. While many countries recorded negative composition effects, structural changes led to the most substantial reductions in emissions in Ireland and the Scandinavian countries.
The correlation between income and the productivity effect does not appear to be strong. A robust negative correlation here would indicate that productivity change tended to be more CO2-saving in higher income countries. Such a correlation would support the EKC hypothesis. Of the countries with the largest productivity effects, France, Belgium, and Luxembourg have increased their reliance on nuclear power production and Sweden has shifted toward renewable energy sources. All have moved away from CO2-intensive coal powered electric plants. Given this observation and the poor correlation results in table 4 it appears that the magnitude of the productivity effect is not related to income but rather to alternative energy production, which tends to have low CO2 emissions per unit of energy produced. Furthermore, of the countries with productivity effects over 2 per cent, none has significant coal reserves. This result suggests that initial resource endowments play a role in the type of energy sources adopted and hence the magnitude of the productivity effect. Countries with small coal reserves were more likely to exhibit the magnitude of productivity effects necessary to generate an inverted U-shaped EKC. Conversely, countries with larger coal reserves exhibit patterns more consistent with monotonically increasing EKCs. This observation is consistent with Aldy (Reference Aldy2005) who reported in his US state level EKC study that CO2 emissions were positively related to historic coal endowments.
SFA results
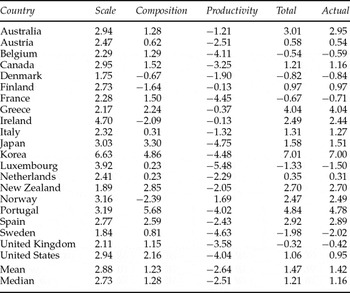
Table 6 presents the SFA decomposition results using the half-normal specification deemed the best fit. The estimated scale effects are similar to the DFA results. Denmark and Sweden exhibited the smallest scale effects and Korea and Ireland again showed exceptionally large-scale effects. Overall, the DFA and SFA scale effects from tables 4 and 6 are highly correlated.

The SFA composition effect, however, differs from the DFA results. Although the results are highly correlated across countries, the average composition effect is positive and much larger in magnitude, implying that changes in economic structure led to substantial increases in emissions over the period. According to these results, only four countries exhibited a pollution-saving composition effect – Denmark, Norway, Finland, and Ireland. The pollution-producing composition effect was quite large in several countries, generating a 5.6 per cent increase in CO2 per year in Portugal and a 4.9 per cent increase in Korea. Given the relatively slow pace of sectoral shift in most economies on a year-to-year basis, these results appear disproportionately large.
The estimated DFA and SFA productivity effects are also highly correlated. Like the DFA results, the SFA estimates point to a CO2-saving productivity effect, but here the effect is much larger, averaging 3.30 per cent over the sample. Luxembourg, Japan, and Sweden were the most successful at advancing the productive frontier in terms of CO2 reductions, while Norway, Ireland, and Finland lagged. According to these results, the productivity effect was large enough to offset the scale effect in 12 of 21 countries.
Implications for an EKC can be inferred from the correlations on the bottom panel of table 5. As with DFA, both the scale and composition effects are negatively correlated with initial income and the productivity effect is not. This pattern generated poor prospects of an EKC according to the DFA results. However, the SFA results showed that the composition effect was a major driver of emission increases; so, if income is negatively correlated with the composition effect, then economic growth could spur emission reductions, improving the prospects of an inverted U-shaped EKC. However, this interpretation is made with caution since the estimated composition effects appear to be implausibly large.
5. Conclusions
In this paper we develop a theoretical model for decomposing changes in emissions into the constituent scale, composition, and productivity effects. Using an output distance function framework, we then empirically calculate these effects for CO2 emissions across a panel of OECD countries. Using a deterministic frontier analysis approach, the results indicate that the productivity effect exceeded the scale effect in a few countries, which is consistent with an inverted U-shaped environmental Kuznets curve. However, on average, the productivity and composition effects were not large enough to offset scale effects. This result suggests that reductions in CO2 emissions, such as those laid out in the Kyoto Protocol or other national policies, are feasible as they have already been achieved in several countries, but must be accompanied by significant technical and environmental efficiency improvements if per capita incomes are to be maintained.
A stochastic frontier analysis approach generates similar results for the scale effect but composition and productivity effects are much different. Contrary to the DFA results, the composition effect was CO2-producing on average, while the productivity effect produces much larger CO2-saving effects. Hence, according to the SFA results, emissions are less than they would otherwise be almost solely due to productivity gains. This result is in contrast with the DFA findings, which indicate that in most countries emission savings are generated by both composition and productivity effects.
While there are advantages and disadvantages to each estimation technique, the magnitudes of the three effects appear to be more plausible with the DFA approach. For instance, for the US, the SFA results indicate that productivity improvement reduced CO2 emissions by about 4 per cent annually, while the DFA model shows the effect was a more reasonable 1.5 per cent per year. Similarly, the SFA results imply changing economic structure increased emissions by over 2 per cent per year, while the DFA results show such changes reduced emission by a more plausible 0.33 per cent per year. Given previous research, it is likely that both changes in the structure of the economy and productivity gains have contributed to CO2 emission savings.
This research focused mainly on explaining past relationships rather than predicting future emission patterns. Care must be taken to avoid generalizing the results presented here to other economies not included in the analysis. While the DFA approach has the advantage of incorporating the theoretically consistent inequality constraints, it is sensitive to outliers, so inclusion of developing or other economies that are structured much differently from this relatively homogeneous set of OECD countries may produce different results. SFA does not suffer from this potential pitfall, but as we show here, it may generate results that are implausible since constraints consistent with production theory cannot be readily imposed.