



No CrossRef data available.
Article contents
The Norwegian version of the Herth Hope Index (HHI-N): A psychometric study
Published online by Cambridge University Press: 12 May 2005
Abstract
Objective: The purpose of this study was to evaluate the psychometric properties of the Herth Hope Index (HHI) in a representative sample of the Norwegian population.
Methods: The HHI-N was administered to 4000 people randomly selected from the Norwegian population. 1893 questionnaires were usable, yielding a response rate of 48.5%.
Results: The internal consistency of the HHI-N, estimated by Cronbach's alpha, was 0.81. Factor analysis resulted in a two-factor solution, which explained 38% of the variance. The correlation between hope and overall quality of life was 0.48 (p < 0.001), and between hope and fatigue severity −0.30 (p < 0.001).
Significance of results: Further testing, especially with regard to the dimensionality of the instrument, is recommended.
Information
- Type
- Research Article
- Information
- Copyright
- © 2004 Cambridge University Press
INTRODUCTION
Hope in Nursing
Hope has several definitions. An oft-quoted definition of hope by nurses, developed by Dufault and Martocchio (1985), defines hope as a multidimensional dynamic life force that is characterized by a confident, yet uncertain expectation of achieving something good, which is realistically possible and personally significant. According to this definition, hope is comprised of six different dimensions: contextual, temporal, affiliative, behavioral, affective, and cognitive. Hope is often described as a multidimensional phenomenon. However, the dimensions that are emphasized in the various definitions differ to some extent (Nowotny, 1989; Farran et al., 1995).
Kylma and Vehvilainen-Julkunen (1997) performed a meta-analysis of studies of hope in the nursing literature and concluded that hope can be depicted in very positive terms. Hope is mainly described as being connected to the future, as a powerful resource, as a belief in opportunities, and as a way out of difficulties. Hope sets the stage for a feeling of well-being, whereas hopelessness creates a sense that the future is intolerable (Fromm, 1970). Hope is further claimed to maintain healthy ego functioning because it provides freedom for human creative capacity during times of suffering and loss (Heagle, 1975).
The experience of hope has been described in different patient groups, although most existing work has been done with cancer patients. In studies in newly diagnosed cancer patients (Rustoen & Wiklund, 2000), in patients with recurrent cancer (Herth, 2000), and in terminally ill cancer patients (Benzein et al., 2001), hope was found to be an important phenomenon. In a Swedish study (Benzein et al., 2001) researchers interviewed patients receiving palliative home care about the meaning of hope and found that the hope of being cured was the most important issue for these patients. Even if they were aware of their imminent death, the presence of hope was essential for patients' ability to go on living.
Other researchers have investigated the importance and meaning of hope in patients with heart failure (Johnson et al., 1997), cardiac disease (Staples & Jeffrey, 1997), Parkinson's disease (Fowler, 1997), multiple sclerosis (Fraser et al., 2001), and HIV infection (Phillips et al., 2000), as well as in patients with cancer pain (Chen, 2003; Lin et al., 2003). Of note, only a small number of studies have examined the concept of hope in children (Snyder et al., 1991; Snyder, 1995).
Nurses may be able to help vulnerable patients to use the power of hope as a coping strategy in different clinical settings (Miller, 1989). However, to do so they must be able to identify and to assess hope in patient groups. An empirical instrument to identify and assess hope would augment clinical judgment, and thus provide further evidence to underpin the nurse's assessment of a client level of hope.
Instruments to Measure Hope
Hope is a dynamic process that can be influenced by the individual or by other people and which might vary in the degree of its presence. Accordingly, researchers in the field of nursing sciences have developed different measures of hope. Questionnaires are most often used (Kylma & Vehvilainen-Julkunen, 1997). Different scales have been developed to measure hope, such as the Miller Hope Scale (Miller & Powers, 1988), the Stoner Hope Scale (Stoner & Keampfer, 1985), the Herth Hope Scale (Herth, 1991), the Herth Hope Index (Herth, 1992), and the Nowotny Hope Scale (Nowotny, 1989). Each of these scales has a different theoretical basis. The latter four were developed specifically to measure hope in cancer patients. The Miller Hope Scale, tested initially on healthy students, has since been used for various patient groups and is based on a very broad definition of hope. The Stoner Hope Scale is based on Stotland's work on hope (Stoner & Keampfer, 1985; Farran et al., 1995). This scale is different from the others in that it is composed of many items related to culturally determined phenomena such as fear of nuclear war, unemployment, pollution, and access to cultural activities. The Nowotny Hope Scale is based on Nowotny's work on hope, and its items were selected on the basis of a comprehensive review of the reference literature on hope (Nowotny, 1989). The Herth Hope Scale and the Herth Hope Index are based on Dufault and Martocchio's conceptualization of hope (Herth, 1991, 1992).
The Herth Hope Index (HHI)
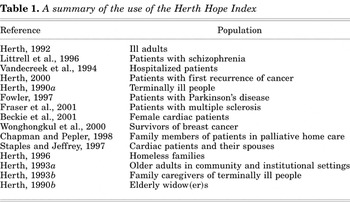
A database review using MEDLINE/CINAHL/PSYCHLIT shows that the Herth Hope Index has been previously used in several studies of different patient groups; a summary of these studies is given in Table 1.
A summary of the use of the Herth Hope Index

These studies primarily investigated the level of hope and the relationship between hope and disease-specific factors in the different populations studied. Although several studies have used the HHI in different patient populations, we have not found any studies on samples from the general population.
The specific aim of the present article was to investigate the validity and reliability of the Norwegian version of the Herth Hope Index (HHI-N) in a representative sample of the Norwegian population. The Herth Hope index was chosen because it is based on a universal concept of hope, it was designed for clinical settings, and it is brief, containing only 12 items. Studying hope in the general population using this index may provide valuable evidence to underpin our understanding of hope. Nurses may use this knowledge as a basis for clinical judgment about when hope is threatened in different patient groups. However, to make this judgment an assessment of comparable values from the general population is needed.
Dr. Kaye Herth, who developed this measure, has given permission to use and adapt the Herth Hope Index in the present study, in which we asked the following questions:
- What is the feasibility of the use of HHI-N?
- What is the scalability (reliability) of the HHI-N, as estimated by interitem correlations, item–total correlations, and Cronbach's alpha?
- Does the empirical structure of the HHI-N in the sample assessed reflect the underlying conceptual dimensions of hope?
- Do scores of the HHI-N correlate as expected with selected health indices, fatigue, and overall quality of life?
METHODS
Sample and Data Collection
A total of 4000 Norwegian citizens, aged 19 to 81 years, were randomly selected as representative of the entire Norwegian population from the National Register by Statistics Norway. The subjects received a mailed questionnaire in November, 2000. Subjects who had not responded within 4 weeks received one written reminder, again with the questionnaire enclosed. Of the initial 4000 people selected, a total of 1912 returned questionnaires after the two mailings. Of these, 1893 questionnaires were complete and were usable for further analysis, yielding a response rate of 48.5%. Of the 1893 who returned the questionnaires, 85% answered before the second mailing.
Approval was obtained from the Norwegian Social Science Data Service. Because the present study did not include patients, it was not necessary to gain approval from the Committee for Medical Research Ethics. Statistics Norway drew the sample and mailed the questionnaires. This national register, established by the government in 1878, provides data for survey research that are representative of the entire Norwegian population. The researchers did not know the identity of the participants. The participants were informed in a letter sent to them, together with the questionnaire, that if they were willing to participate they should return the questionnaire in the attached envelope. In that way, returning the questionnaire indicated their consent to participate in the study.
The Questionnaire
The questionnaire contained four parts. One part assessed background characteristics in relation to demographics and health status. The second part focused on global quality of life. The third part asked about experiences with fatigue and hope. The last part assessed stress symptoms and pain. The present article includes information from the first three parts.
Hope: The Herth Hope Index
Measurement description and translation into Norwegian. The Herth Hope Index is an adaptation of The Herth Hope Scale (HHS) (Herth, 1992). To increase the clinical usefulness of the HHS specific attention was given to designing simple items and to relating items to adults experiencing changes in health status. The purpose was to develop an index that could aid researchers and clinicians in the assessment of hope states within clients and in the evaluation of the effectiveness of hope-enhancing strategies (Herth, 1992).
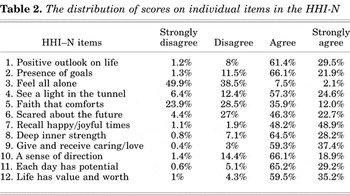
The HHI is based on both the global and the specific dimensions of hope conceptualized in Dufault and Martocchio's (1985) model of hope. The HHI contains 12 items using a Likert response format. The possible scores range from 12 to 48, with higher scores indicating greater hopefulness. Items of the HHI are included in Table 2.
The distribution of scores on individual items in the HHI-N

The translation of the HHI was performed using the translation-back method (Guillemin et al., 1993). Two independent English-speaking translators translated the HHI from English to Norwegian. The two Norwegian versions were then adjusted into one version in accordance with the two independent translators and expert researchers in the field of hope. The adjusted version was then translated back into English by a native English speaker fluent in Norwegian and without knowledge of the original HHI items. The new English version was then compared with the original English version and finally accepted. No significant problems arose in the translation process, the objective of which was to develop an equivalent HHI version in Norwegian.
Previous reports on validity and reliability of the HHI. The HHI was developed and first psychometrically evaluated in a convenience sample of 172 ill adults (Herth, 1992). Results from this evaluation showed an internal consistency coefficient of 0.97 (Cronbach's alpha) and a test–retest correlation of 0.91. Corrected item–total correlations resulted in 0.42 as the lowest and 0.70 as the highest values. The interitem matrix showed that no correlations exceeded 0.64, indicating acceptable independence of item content. Construct validity of the HHI was assessed by a maximum likelihood factor analysis with varimax rotation. A total of 61% of the variance was explained by a three-factor solution. All items had a significant loading on one of three factors, and these factors corresponded to the three originally formed subscales of the Herth Hope Scale from which the HHI was developed (Herth, 1992).
Concurrent criterion-related validity was assessed by calculating the correlations of the HHI to the Herth Hope Scale (r = 0.92), the Existential Well-Being Scale (r = 0.84), and the Nowotny Hope Scale (r = 0.81). Furthermore, HHI scores were not significantly associated with gender, educational level, race, or age. There was, however, a significant difference in the level of hope according to marital status, length of illness, income status, and fatigue level.
Divergent validity was assessed by calculating the correlation coefficient with a hopelessness scale (r = −0.73). A significant relationship between hope, measured by the HHI, and quality of life has been previously reported (Beckie et al., 2001). Other researchers studying patients with multiple chemical sensitivity reported a moderate inverse correlation between HHI and fatigue (Gibson, 1999).
Validating Instruments
Quality of life: The WHOQOL-bref—items on overall quality of life. The 26-item WHOQOL-bref is a quality-of-life questionnaire developed for cross-cultural adaptation. One of the items is an overall quality of life question, asking the person to rate the quality of his or her life from extremely poor to extremely good. The WHOQOL-bref had previously been translated into Norwegian (Hanestad et al., 2001). In the present article, only the single overall quality-of-life question from the WHOQOL-bref was used to validate the HHI-N.
Fatigue: Fatigue Severity Scale (FSS). The FSS is a nine-item questionnaire developed by Krupp et al. (1989). Respondents answer using a Likert scale ranging from 1 completely disagree to 7 completely agree. FSS has a reported internal consistency of 0.81, as measured by Cronbach's alpha (Krupp et al., 1989).
Sociodemographic items. The questionnaire contained questions concerning age, sex, marital status, level of formal education, cohabitation, and work or source of income. Statistics Norway supplied information about age, gender, and educational status in nonrespondents.
Health indices. One question asked whether or not the person suffered from long-term illness.
Statistical Analysis
Data were analyzed using the SPSS for Windows software (version 10.0, SPDD, Inc). Descriptive analyses were performed to assess the characteristic of the sample and to describe the HHI. Cronbach's alpha and correlations (Pearson's r) were used to estimate the scalability of the HHI-N (research question 2). Factor analysis (maximum likelihood with varimax rotation) was performed to assess the empirical support for the dimensionality of the HHI-N in the general Norwegian population (research question 3). Finally, correlational analyses (Pearson's r) were used to explore the discriminative power of the HHI-N (research question 4). Missing values in the HHI were replaced with the item's mean value if 20% or less of the items were missing for an individual response.
RESULTS
Sample Characteristics and Response Rate
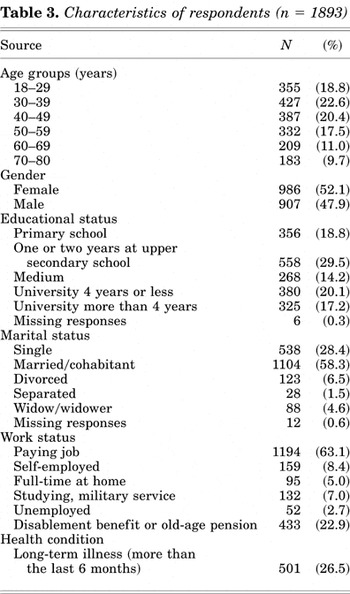
The mean age of the sample was 45.2 years (SD = 16.0). Of the respondents, 58% were married or cohabitant and 52% were women. With regard to educational level, 19% reported primary school as the highest level of education, whereas 17% reported more than 4 years of university study as the highest level. Of respondents, 501 (27%) reported suffering from long-term illness (see Table 3).
Characteristics of respondents (n = 1893)

The Feasibility of the HHI-N
Sixteen hundred and eighty six people (89%) completed all items of the Herth Hope Index, whereas 156 respondents (8%) left between one and six items unanswered. A total of 53 respondents (3%) were deleted from the analysis, because they left more than six items unanswered. Mean HHI-N score was 36.7 (SD = 4.2), with a scoring range from 15 to 47. As seen in Table 2 the endorsement frequencies (i.e., less than 85% of respondents providing the same response for each item) for individual items were feasible in all items.
The Scalability of the HHI-N
The internal consistency coefficient estimated by Cronbach's alpha was 0.81. Calculating the interitem correlations between the items further tested the scalability of the HHI-N. These correlations ranged from −0.09 to 0.58. The lowest correlation (−0.09) occurred between items 5 (faith that comforts) and 6 (scared about the future). The highest correlation (0.58) was between item 1 (positive outlook on life) and item 12 (life has value and worth). Most of the items in the scale showed correlation coefficients in the range 0.2 to 0.4. The item–total correlations values, each item correlated with the 12-item total HHI-N score, ranged from 0.37 to 0.76 (all p < 0.001). Item 12 (life has a value) exhibited the highest correlation with the total score, and the lowest correlation was for item 5 (faith that comforts).
The Empirically Supported Structure of the HHI-N
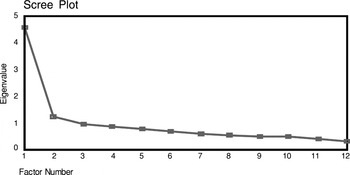
The construct validity of the HHI-N was assessed by factor analysis using a maximum likelihood extraction with varimax rotation. Using the default criterion of an eigenvalue above 1.0 for extraction resulted in a two-factor solution accounting for 38% of the item variance. Eigenvalues were 4.6, 1.2, and 0.9 for the first, second, and third factors, respectively. The scree plot (i.e., the pattern of eigenvalues for the successive dimensions extracted) showed a visible decline in eigenvalues from the second to the third component, with subsequent components explaining progressively less of the variance (Fig. 1).

The scree-plot of the factor analysis of the HHI-N.
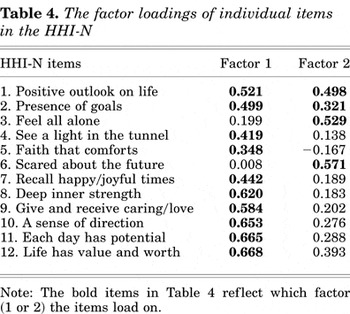
Table 4 shows the loadings of the HHI-N items. As seen from the table, items 1 (positive outlook on life) and 2 (presence of goals) load about equally on both factors. Items 4 (see a light in the tunnel), 5 (faith that comforts), 7 (recall happy/joyful times), 8 (deep inner strength), 9 (give and receive caring/love), 10 (a sense of direction), 11 (each day has potential), and 12 (life has value and worth) clearly load on Factor 1. Items 3 (feel all alone) and 6 (scared about the future) load on Factor 2. These results indicate that positively worded items cluster together on a dominant factor.
The factor loadings of individual items in the HHI-N

The Relationship between Hope and Health Indices, Fatigue, and Overall Quality Of Life
A lower level of hope was observed in those living with long-term disease (p < 0.001). HHI-N scores showed a significant positive correlation with overall quality of life (r = 0.48; p < 0.001) and a significant inverse correlation with fatigue (r = −0.30; p < 0.001).
DISCUSSION
This study is the first application of the HHI-N in a sample from the general population. However, the 48.5% response rate in the present study could have been improved. In our study using data provided by Statistics Norway, there were no major differences in distributions of age, gender, marital status, and educational level in the respondents and nonrespondents. Therefore, we assume that the respondents do not differ systematically from the nonrespondents and that the response rate is a result of nonsystematic factors. Another strategy to estimate the possible bias related to nonresponsiveness may be to compare late respondents to early ones on the dependent variable (Filion, 1976). In the present study, there was no marked difference in hope scores between early (first mailing) and late (second, reminder mailing) respondents.
The Feasibility of the HHI-N
In the present study, the Herth Hope Index, an American questionnaire, was translated and tested for reliability and validity in a randomly drawn sample from the general Norwegian population. Designed to assess hope in the clinical setting, the Herth Hope Index was initially judged to be a reasonable measure of hope in a group of ill adults and has been used in several patient groups. To understand the estimates of hope in different clinical settings or patient groups, it is necessary to obtain reliable and valid information about hope from the general population. Knowing the level of hope in the general population enhances the possibility for making sound clinical judgments about the level of hope in different patient groups. To our knowledge, there are no data using the Herth Hope Index to assess hope in general populations throughout the world, and certainly none from the Norwegian general population. Therefore, we attempted to assess the validity and reliability of this index in the Norwegian general population.
One advantage of the HHI is that it is short, containing only 12 items, and therefore easily administered in many settings. Translation into Norwegian followed accepted guidelines and did not encounter any major problems. Furthermore, the results from the present study gave no indication that respondents encountered major problems in understanding or completing the questionnaire. The distribution of scores indicates that there were no ceiling or floor effects for any of the items. Therefore, one could assert that this study supports the feasibility of use of this hope index.
The Scalability of the HHI-N
According to Nunnally and Bernstein (1994), an alpha above 0.70 and an item—total correlation not lower than 0.20 are considered as acceptable values. Therefore, the Cronbach's alpha and the item-total correlations of the HHI-N observed in the present study are satisfactory and support the internal consistency of the scale. However, the interitem correlations showed a low negative correlation between “faith that comforts” and “scared about the future,” suggesting that these items are not related to each other. Our results are somewhat different from those obtained in the study by Herth (1992), in which the alpha coefficient was higher (0.97) and a different pattern of correlation emerged. However, the range of correlations is comparable between the studies.
The Empirical Structure of the HHI-N
In the present study, factor analysis resulted in a two-factor solution. Eight items loaded on one factor, two items on the second factor, and two items loaded on both factors. The first factor reflected positively worded items whereas the second factor reflected negatively worded items. These results are not consistent with previous research using the HHI (Herth, 1992). In the study by Herth, all items loaded on one of the three originally formed subscales of the Herth Hope Scale, such as temporality and future, positive readiness, and expectancy and inter-connectedness. In addition, the variance extracted by these factors was much higher (61%) than in our study (38%). There may be reasons for these diverse results. One may relate to differences in sample sizes and groups of respondents (177 ill adults in the study by Herth and 1893 respondents randomly chosen from the general population in our study). In addition, cultural differences might affect the response patterns. Further research on the structure of the HHI-N is necessary.
Relationships with Validating Instruments
The present study found lower hope scores in those reporting long-term illness, in agreement with previous work with the HHI showing lower mean scores in subjects who reported illness lasting longer than 12 months (Herth, 1992). Furthermore, our results reveal that people with higher levels of hope also report higher levels of quality of life. Previous studies on hope and quality of life show a strong positive relationship between these concepts (Rustoen, 1995; Staples & Jeffrey, 1997; Beckie et al., 2001). There is also an inverse correlation between hope and fatigue. For example, in the study by Herth (1992) fatigue significantly affected hope, and subjects who reported experiencing high or overwhelming fatigue had significantly lower mean hope scores than did those experiencing little fatigue. These findings are further supported by other studies on hope (Miller, 1989; Herth, 1990). Our results support the discriminative power of the HHI-N by confirming previous research and theoretically anticipated relationships.
Implications for Nursing
Based on their review of the literature on hope, Herth and Cutcliffe (2002) concluded that hope must become visible so it can be reflected in the politics of health care and in educational institutions. Nurses must engage in hope-focused practice and use strategies that enhance hope in their clients. One way to make hope more visible and to help nurses in their work with clients is to have valid and reliable measures available for clinical use. When the validity and reliability of the Herth Hope Index is studied in different populations, both healthy and sick groups, the instrument can be used in research and clinical practice. Because this instrument contains only 12 items, it should be a convenient tool to use in clinical practice. The total score on the HHI can help the nurse to determine the clients' level of hope and scores on the individual items can provide information on specific aspects of hope. This information can be a valuable guide to develop strategies to enhance hope in clients.
CONCLUSION
In conclusion, our results partly support the validity and reliability of the HHI-N as a questionnaire for measuring hope in a general Norwegian population, with the exception of the empirical structure of the measure. Further research is needed to confirm the validity and reliability of HHI-N.
ACKNOWLEDGMENTS
Oslo University College, Buskerud University College, and University of Bergen, Department of Public Health and Primary Health Care financed the study.
References
REFERENCES
Beckie, T.M.,
Beckstead, J.W., &
Webb, M.S.
(2001).
Modeling women's quality of life after cardiac events.
Western Journal of Nursing Research,
23,
179–194.Google Scholar
Benzein, E.,
Norberg, A., &
Saveman, B.I.
(2001).
The meaning of the lived experience of hope in patients with cancer
in palliative home care.
Palliative Medicine,
15,
117–126.Google Scholar
Chapman, K.J. &
Pepler, C.
(1998).
Coping, hope, and anticipatory grief in family members in palliative
home care.
Cancer Nursing,
21,
226–234.Google Scholar
Chen, M.L.
(2003).
Pain and hope in patients with cancer: A role for cognition.
Cancer Nursing,
26,
61–67.Google Scholar
Dufault, K. &
Martocchio, B.C.
(1985).
Symposium on compassionate care and the dying experience. Hope: Its
spheres and dimensions.
Nursing Clinics of North America,
20,
379–391.Google Scholar
Farran, C.J.,
Herth, K.A., &
Popovich, J.M.
(1995).
Hope and Hopelessness: Critical Clinical Constructs.
Thousand Oaks, CA:
Sage Publications.
Filion, F.
(1976).
Exploring and correcting for nonresponse bias using follow-ups of
nonrespondents.
Pacific Sociological Review,
19,
401–408.Google Scholar
Fowler, S.B.
(1997).
Hope and a health-promoting lifestyle in persons with
Parkinson's disease.
Journal of Neuroscience Nursing,
29,
111–116.Google Scholar
Fraser, C.,
Hadjimichael, O., &
Vollmer, T.
(2001).
Predictors of adherence to Copaxone therapy in individuals with
relapsing-remitting multiple sclerosis.
Journal of Neuroscience Nursing,
33,
231–239.Google Scholar
Fromm, E.
(1970).
The Revolution of Hope: Toward a Humanized Technology.
New York:
Harper Colophon Books.
Gibson, P.R.
(1999).
Hope in multiple chemical sensitivity: Social support and attitude
towards healthcare delivery as predictors of hope.
Journal of Clinical Nursing,
8,
275–283.Google Scholar
Guillemin, F.,
Bombardier, C., &
Beaton, D.
(1993).
Cross-cultural adaptation of health-related quality of life
measures: Literature review and proposed guidelines.
Journal of Clinical Epidemiology,
46,
1417–1432.Google Scholar
Hanestad, B.R.,
Wahl, A.K.,
Rustøen, & T.,
et al.
(2001).
Validation of the WHQOL-BREF in a Norwegian general
population.
Quality of Life Research,
10,
206.Google Scholar
Heagle, J.
(1975).
A Contemporary Meditation on Hope.
Chicago:
Thomas Moore Press.
Herth, K.
(1990).
Relationship of hope, coping styles, concurrent losses, and setting
to grief resolution in the elderly widow(er).
Research in Nursing and Health,
13,
109–117.Google Scholar
Herth, K.
(1990a).
Fostering hope in terminally-ill people.
Journal of Advanced Nursing,
15,
1250–1259.Google Scholar
Herth, K.
(1991).
Development and refinement of an instrument to measure hope.
Scholarly Inquiry of Nursing Practice,
5,
39–51;
discussion 53–56.Google Scholar
Herth, K.
(1992).
Abbreviated instrument to measure hope: Development and psychometric
evaluation.
Journal of Advanced Nursing,
17,
1251–1259.Google Scholar
Herth, K.
(1993a).
Hope in older adults in community and institutional settings.
Issues in Mental Health Nursing,
14,
139–156.Google Scholar
Herth, K.
(1993b).
Hope in the family caregiver of terminally ill people.
Journal of Advanced Nursing,
18,
538–548.Google Scholar
Herth, K.
(1996).
Hope from the perspective of homeless families.
Journal of Advanced Nursing,
24,
743–753.Google Scholar
Herth, K.
(2000).
Enhancing hope in people with a first recurrence of cancer.
Journal of Advanced Nursing,
32,
1431–1441.Google Scholar
Herth, K.A. &
Cutcliffe, J.R.
(2002).
The concept of hope in nursing 6:
Research/education/policy/practice.
British Journal of Nursing,
11,
1404–1411.Google Scholar
Johnson, L.H.,
Dahlen, R., &
Roberts, S.L.
(1997).
Supporting hope in congestive heart failure patients.
Dimensions of Critical Care Nursing,
16,
65–78.Google Scholar
Krupp, L.B.,
LaRocca, N.G.,
Muir-Nash, & J.,
et al.
(1989).
The fatigue severity scale. Application to patients with multiple
sclerosis and systemic lupus erythematosus.
Archives of Neurology,
46,
1121–1123.Google Scholar
Kylma, J. &
Vehvilainen-Julkunen, K.
(1997).
Hope in nursing research: A meta-analysis of the ontological and
epistemological foundations of research on hope.
Journal of Advanced Nursing,
25,
364–371.Google Scholar
Lin, C.C.,
Lai, Y.L., &
Ward, S.E.
(2003).
Effect of cancer pain on performance status, mood states, and level
of hope among Taiwanese cancer patients.
Journal of Pain and Symptom Management,
25,
29–37.Google Scholar
Littrell, K.H.,
Herth, K.A., &
Hinte, L.E.
(1996).
The experience of hope in adults with schizophrenia.
Psychiatric Rehabilitation Journal,
19,
6.Google Scholar
Miller, J.F.
(1989).
Hope-inspiring strategies of the critically ill.
Applied Nursing Research,
2,
23–29.Google Scholar
Miller, J.F. &
Powers, M.J.
(1988).
Development of an instrument to measure hope.
Nursing Research,
37,
6–10.Google Scholar
Nowotny, M.L.
(1989).
Assessment of hope in patients with cancer: Development of an
instrument.
Oncology of Nursing Forum,
16,
57–61.Google Scholar
Nunnally, J.C. &
Bernstein, I.H.
(1994).
Psychometric Theory.
New York:
McGraw-Hill.
Phillips, K.D.,
Sowell, R.L.,
Misener, & T.R.,
et al.
(2000).
Levels of hope in HIV-infected African-American women of
reproductive age.
Clinical Excellence for Nurse Practitioners,
4,
90–97.Google Scholar
Rustoen, T.
(1995).
Hope and quality of life, two central issues for cancer patients: A
theoretical analysis.
Cancer Nursing,
18,
355–361.Google Scholar
Rustoen, T. &
Wiklund, I.
(2000).
Hope in newly diagnosed patients with cancer.
Cancer Nursing,
23,
214–219.Google Scholar
Snyder, C.R.
(1995).
Conceptualizing, measuring and nurturing hope.
Journal of Counseling & Development,
73,
355–360.Google Scholar
Snyder, C.R.,
Harris, C.,
Anderson, & J.R.,
et al.
(1991).
The will and the ways: Development and validation of an
individual-differences measure of hope.
Journal of Personality and Social Psychology,
60,
570–585.Google Scholar
Staples, P. &
Jeffrey, J.
(1997).
Quality of life, hope, and uncertainty of cardiac patients and their
spouses before coronary artery bypass surgery.
Canadian Journal of Cardiovascular Nursing,
8,
7–16.Google Scholar
Stoner, M.H. &
Keampfer, S.H.
(1985).
Recalled life expectancy information, phase of illness and hope in
cancer patients.
Research in Nursing Health,
8,
269–274.Google Scholar
Vandecreek, L.,
Nye, C., &
Herth, K.
(1994).
Where there's life, there's hope, and where there is hope,
there is.
Journal of Religion & Health,
33,
51.Google Scholar
Wonghongkul, T.,
Moore, S.M.,
Musil, & C.,
et al.
(2000).
The influence of uncertainty in illness, stress appraisal, and hope
on coping in survivors of breast cancer.
Cancer Nursing,
23,
422–429.Google Scholar
A summary of the use of the Herth Hope Index
The distribution of scores on individual items in the HHI-N
Characteristics of respondents (n = 1893)
The scree-plot of the factor analysis of the HHI-N.
The factor loadings of individual items in the HHI-N
 You have
Access
- 52
- Cited by