INTRODUCTION
Our understanding of vegetation and climate history in the Pacific Northwest (PNW) over the last 11,500 yr is based on evidence derived from lake-sediment records (Whitlock, Reference Whitlock1992; Hebda and Whitlock, Reference Hebda and Whitlock1997). Lake-sediment evidence has also been used to reconstruct fire histories that span similar time scales (Gavin et al., Reference Gavin, Hallett, Hu, Lertzman, Prichard, Brown, Lynch, Bartlein and Peterson2007; Long et al., Reference Long, Whitlock and Bartlein2007; Walsh et al., Reference Walsh, Marlon, Goring, Brown and Gavin2015). The majority of records that examine millennial-scale change in vegetation and/or fire in the PNW have focused on sites in the coastal mountains (Worona and Whitlock, Reference Worona and Whitlock1995; Long et al., Reference Long, Whitlock and Bartlein2007), western lowlands (Walsh et al., Reference Walsh, Whitlock and Bartlein2008, Reference Walsh, Marlon, Goring, Brown and Gavin2015), or Cascade Range (Sea and Whitlock, Reference Sea and Whitlock1995; Grigg et al., Reference Grigg, Whitlock and Dean2001; Long et al., Reference Long, Power and Bartlein2011; Walsh et al., Reference Walsh, Lukens, McCutcheon and Burtchard2017). There has also been work done to examine the environmental history of the intermountain West, including the western Rocky Mountain ranges in Idaho (Brunelle, et al., Reference Brunelle, Whitlock, Bartlein and Kipfmuller2005; Whitlock et al., Reference Whitlock, Briles, Fernandez and Gage2011; Herring and Gavin, Reference Herring and Gavin2015). The Blue Mountains of northeastern Oregon are an underrepresented area in this region, with only the pioneering records of Hansen (Reference Hansen1943, Reference Hansen1947) detailing paleoecological change. This area also represents an important transitional zone between the maritime regions of the western PNW and the more continental regions of the intermountain West. Shinneman et al. (Reference Shinneman, Baker, Rogers and Kulakowski2013) provide a perspective on fire and forest development in the intermountain West and indicate that the frequency and severity of fire is a major control on a stable-seral forest gradient at higher elevations. Low fire activity promotes stable Populus tremulodies (aspen) stands, whereas more frequent and severe fires move forest structure to that of a seral mix of conifer and aspen. Information on paleoenvironmental change from this transitional area will also be helpful in understanding possible impacts of future climate shifts, providing a context for present and future fire and forest composition variability, and aiding in land management decisions (Whitlock, Reference Whitlock2004).
We present a 7600 yr vegetation and fire history reconstruction from Anthony Lake. Shifts in relative abundance of six taxa from this watershed were previously described by Hansen (Reference Hansen1943). Our goals for this study were to provide a more detailed record of Holocene vegetation change, extend the fire history of the watershed beyond historical records, and examine regional climate patterns that have been conducive for fire activity.
SITE DESCRIPTION
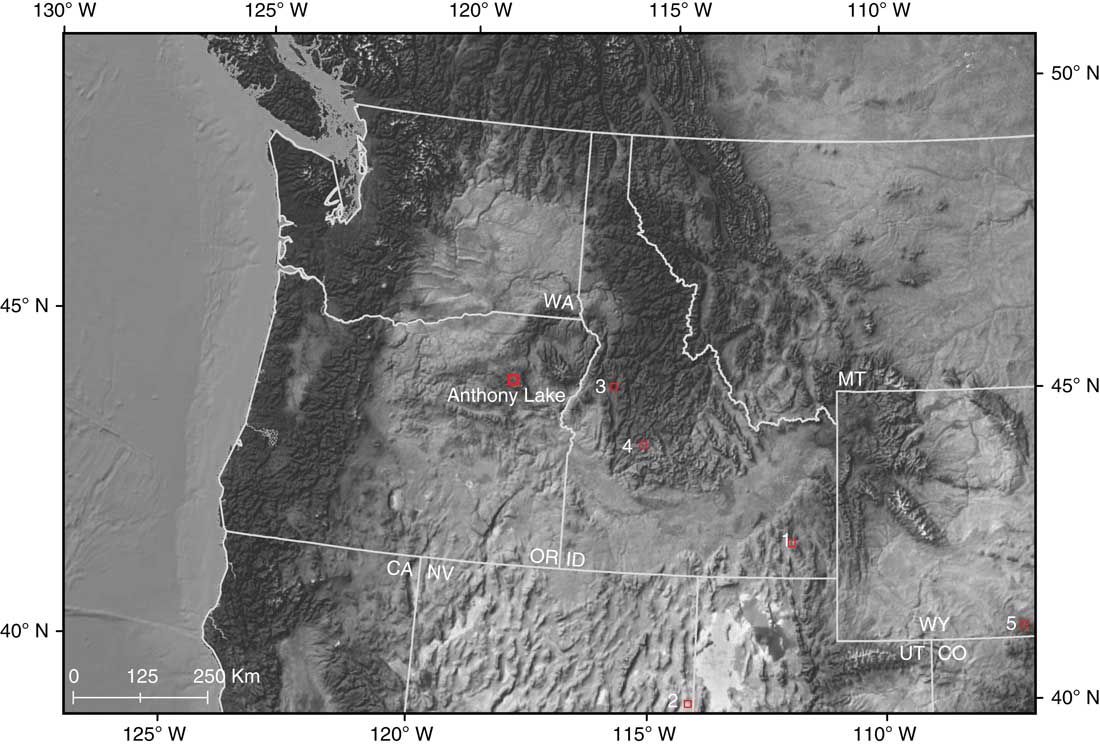
Anthony Lake (44°57.5′N, 118°12.9′W; elevation 2174 m, NAD 83) is a 9 ha lake located in the Elkhorn Range of the Blue Mountains in northeastern Oregon (Fig. 1). The 370 ha watershed lies within the Abies lasiocarpa vegetation zone (Franklin and Dyrness, Reference Franklin and Dyrness1988). Dominant arboreal species include Abies lasicocarpa (subalpine fir), Picea engelmannii (Engelmann spruce), Pinus contorta (lodgepole pine), and Pinus monticola (western white pine), along with scattered Tsuga mertesiana (mountain hemlock). Common nonarboreal species include Artemisia tridentata (sagebrush), Amelianchier alnifolia, (serviceberry), Vaccinium membranaceum (big huckleberry), Agropyron spicatum (bluebunch wheatgrass), and Xerophyllum tenax (bear grass) in an open forest-parkland structure. Riparian vegetation includes Alnus crispa (mountain alder) and several species of Carex (sedge).
(color online) Location of Anthony Lake and other study sites mentioned in the text: 1, Lundeen and Brunelle (Reference Lundeen and Brunelle2016); 2, Reinemann et al. (Reference Reinemann, Porinchu, Bloom, Mark and Box2009); 3, Doerner and Carrara (Reference Doerner and Carrara2001); 4, Pierce et al. (Reference Pierce, Meyer and Jull2004); 5, Carter et al. (Reference Carter, Power, Lundeen, Morris, Petersen, Brunelle and Anderson2018).
The present-day climate of the area is characterized by cool-wet winters and warm-dry summers. Most of the annual precipitation comes as snow from low pressure systems moving inland from the Pacific Ocean during the winter (Mock, Reference Mock1996; Shinker, Reference Shinker2010). In summer, high pressure dominates the region and precipitation is generally suppressed, producing a seasonal summer drought (Mock, Reference Mock1996; Shinker, Reference Shinker2010).
Fires in the Blue Mountains most often occur during the summer or autumn months as the summer drought and high temperatures combine to lower fuel moisture. Thunderstorms, a result of large-scale (i.e., “synoptic”) systems or local convection, may provide lighting strikes, which can ignite fuels (Heyerdahl et al., Reference Heyerdahl, Brubaker and Agee2002). The resultant fires frequently develop into high-severity crown fires, with estimates from dendrochronological data suggesting the average time between fires at a location, or mean fire return interval (MFI), of approximately 250 yr (Agee, Reference Agee1993; Heyerdahl et al., Reference Heyerdahl, Brubaker and Agee2001). Although there have been several fires within 50 km of the Anthony Lake watershed since AD 1985, there have been no documented fires in the Anthony Lake watershed itself over the last 100 yr (U.S. Department of Agriculture, 2015).
METHODS
Sedimentary pollen and charcoal methods
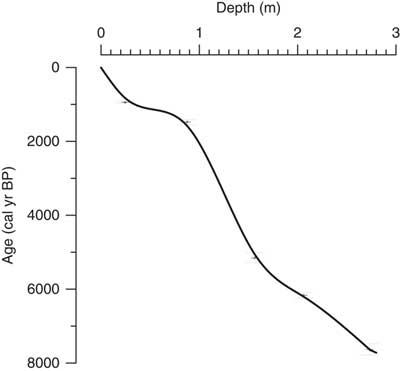
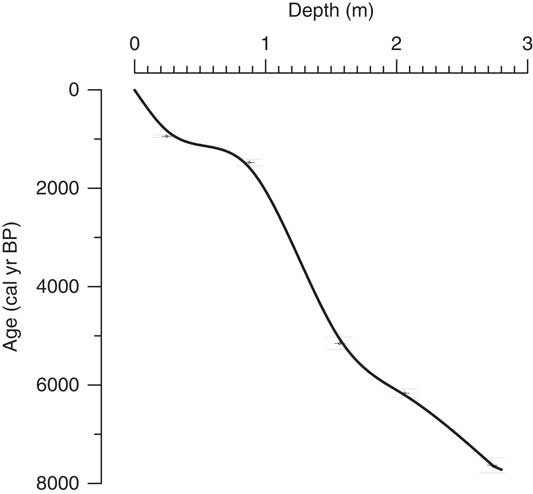
Sediment cores were collected from the deepest portion of the lake using a 5-cm-diameter piston sampler (Wright et al., Reference Wright, Mann and Glaser1983). The chronology for the sediment core was based on three accelerator mass-spectrometry 14C dates, one liquid scintillation counting 14C date, and the accepted calendar age of the Mazama tephra (Zdanowicz et al., Reference Zdanowicz, Zuekubsju and Germani1999) (Table 1). The 14C dates were converted to calibrated ages (Reimer et al., Reference Reimer, Baillie, Bard, Bayliss, Beck, Blackwell and Bronk Ramsey2009, IntCal13.14C data set), and with the addition of the Mazama tephra date, a cubic spline (spar=0.02, lambda=6.07×10⁻⁵, and equivalent degrees of freedom of 5.60) was used to generate the age-versus-depth model. Samples for pollen analysis of 1 cm3 were taken at every 5 cm over the length of the core.
Calibrated (based on Reimer et al. [Reference Reimer, Baillie, Bard, Bayliss, Beck, Blackwell and Bronk Ramsey2009], IntCal13.14C data set) and uncalibrated 14C ages used in sedimentation rate calculations. SD, standard deviation.

Samples were processed using standard methods (Faegri et al., Reference Faegri, Kaland and Krzywinski1989). A known amount of Lycopodium spores was added to each sample prior to processing in order to calculate pollen accumulation rates. The pollen samples were mounted in silicon oil and examined at magnifications of 400–1000×. Pollen was identified to the lowest possible taxonomic level, and a minimum of 300 terrestrial grains were identified from each sample. Pinus grains were grouped into diploxylon-type (P. contorta, lodgepole pine; or P. ponderosa, ponderosa pine) and haploxylon-type (P. strobus, white pine) based on examination of the distal membrane of the pollen grain. Undifferentiated Pinus pollen counts were classified as Pinus. Pseudotsuga-type pollen was attributed to P. menziesii (Douglas fir), and Picea pollen was assumed to represent P. engelmannii (Engelmann spruce). Abies pollen was attributed to A. lasiocarpa (subalpine fir), but A. grandis (grand fir) and A. amabilis (Pacific silver fir) are possible contributors to the pollen spectra as well. Pollen grains that could not be identified were labeled “Unknown.” Terrestrial pollen percentages were calculated using the sum of terrestrial pollen and spores. Percentages of aquatic taxa were calculated based on total terrestrial and aquatic pollen and spores. Pollen accumulation rates (grains/cm2/yr) were determined by dividing pollen concentration by deposition time (yr/cm). The pollen percentage diagram was divided into zones based on constrained cluster analysis (CONISS; Grimm, Reference Grimm1987).
Variations in the abundance of macroscopic charcoal found in the lake sediments were used to reconstruct the fire history. Sediment samples of 2 cm3 were taken at contiguous 0.5 cm intervals and processed for charcoal analysis following Whitlock and Larsen (Reference Whitlock and Larsen2001). We used a 125 µm sieve to collect and tally all charcoal particles greater than 125 µm in diameter for each sediment sample as this size fraction is representative of fires occurring within several kilometers of the lake (Whitlock and Millspaugh, Reference Whitlock and Millspaugh1996; Gavin et al., Reference Gavin, Hallett, Hu, Lertzman, Prichard, Brown, Lynch, Bartlein and Peterson2007). Following Higuera et al. (Reference Higuera, Brubaker, Anderson, Brown, Kennedy and Hu2008 https://github.com/phiguera/CharAnalysis [accessed 9-13-14]) we used the sedimentation rate to convert the raw charcoal counts into charcoal accumulation rates (CHARs) at equal time steps. The CHAR data were then decomposed into CHAR peaks (pulses of high charcoal accumulation), which represent individual fire events, and background charcoal accumulation rates (BCHAR), which represent the average amount of charcoal produced in the watershed, which we used as a proxy for biomass burning (Marlon et al., Reference Marlon, Bartlein, Walsh, Harrison, Brown, Edwards, Higuera, Power, Anderson, Briles, Brunelle, Carcaillet, Daniels, Hu, Lavoie, Long, Minckley, Richard, Shafer, Tinner, Umbanhowar and Whitlock2009). We then calculated several statistics from the CHAR and BCHAR data. We determined pollen zone MFI using the estimated dates of the CHAR peaks within each zone. The fire episode frequency (fires episodes per 1000 yr) was calculated using a tricube-weighted local regression (Cleveland, Reference Cleveland1979) to smooth the total number of peaks within a 1000 yr moving window over the entire record. The peak magnitude, a measure of the total amount of charcoal associated with each peak, was calculated by summing the total amount of CHAR from identified fire episodes and is likely an indicator of the fire size, intensity, and charcoal delivery to the lake (Marlon et al., Reference Marlon, Bartlein, Walsh, Harrison, Brown, Edwards, Higuera, Power, Anderson, Briles, Brunelle, Carcaillet, Daniels, Hu, Lavoie, Long, Minckley, Richard, Shafer, Tinner, Umbanhowar and Whitlock2009).
Modern climate-analogue method
In order to characterize atmospheric circulation patterns associated with fire events, we used historic fire data (Guenther, Reference Guenther2006) to identify recent years in which fires occurred within 40 km of the Anthony Lake watershed. Twenty-seven fire events, occurring between July and October, were noted within this area during the years 1986, 1989, 1995, 1996, and 2006. We selected these as the case years for our modern climate-analogue analysis (Mock and Brunelle-Daines, Reference Mock and Brunelle-Daines1999; Mock and Shinker, Reference Mock and Shinker2013; Shinker, Reference Shinker2014; Carter et al., Reference Carter, Power, Lundeen, Morris, Petersen, Brunelle and Anderson2018). Lightning was indicated as the ignition source in 22 of the 27 fire events, with 3 attributed to unknown causes and 2 to campfires (NWCG, 2015). As described by Mock and Shinker (Reference Mock and Shinker2013), the modern climate-analogue technique relies on the principle of uniformitarianism, assuming that synoptic and dynamic climate processes operate similarly today to how they did in the past (Barry and Perry, Reference Barry and Perry1973). The modern climate-analogue approach is an effective way to identify climate mechanisms associated with past environmental changes (e.g., as reconstructed by sedimentary pollen and charcoal analyses) (Mock and Brunelle-Daines, Reference Mock and Brunelle-Daines1999; Shinker et al., Reference Shinker, Bartlein and Shuman2006; Shinker, Reference Shinker2014; Carter et al., Reference Carter, Brunelle, Minckley, Shaw, DeRose and Brewer2017). Conceptually, a modern-climate analogue approach uses modern extremes (e.g., high fire years) as analogues for past events (e.g., peaks in sedimentary charcoal record) to identify likely synoptic and dynamic patterns that may have caused the past extreme events (Edwards et al., Reference Edwards, Mock, Finney, Barber and Bartlein2001; Shinker, Reference Shinker2014; Carter et al., Reference Carter, Power, Lundeen, Morris, Petersen, Brunelle and Anderson2018). We examined surface and atmospheric climate variables from the North American Regional Reanalysis (NARR) data set (Mesinger et al., Reference Mesinger, DiMego, Kalnay, Mitchell, Shafran, Ebisuzaki and Jović2006) to calculate and map composite-anomaly values based on the selected case years. The NARR provides a variety of surface and atmospheric variables at a 32 km grid scale useful for assessing climate controls within western North American mountain ranges (Heyer et al., Reference Heyer, Brewer and Shinker2017). Composite-anomaly values (representing the differences between the observed conditions in a particular month and the long-term mean values over the base period of 1981–2010) were calculated for the month of July, representing midsummer conditions, from the selected high-fire case years. The composite-anomaly values were then mapped to illustrate the local- and regional-scale processes associated with high-fire years to provide modern climate-analog conditions for past fires at Anthony Lake.
RESULTS
Pollen and charcoal reconstructions
A 2.80-m-long sediment core was collected with recovery terminated after reaching an impenetrable subsurface layer. The core consisted of dark- to very dark-brown fine-detritus gyttja from 0 to 2.28 m depth, brown fine-detritus/clay gyttja with scattered olive laminations from 2.28 to 2.80 m, with light gray volcanic tephra at 2.80 m. The tephra at the base of the core was identified as Mazama ‘O’ (Foit, F., personal communication, 2009) with an accepted age of 7630±150 cal yr BP (Zdanowicz et al., Reference Zdanowicz, Zuekubsju and Germani1999). The sedimentation rate averaged 14 yr per 0.5 cm sample (range 3–29, standard deviation [SD]±8) (Fig. 2).
Age-versus-depth relations for a sediment core from Anthony Lake based on the calibrated ages in Table 1. Vertical bars on dates indicate±2 standard deviations.
The pollen record was divided into five zones, AL1–AL5 (Fig. 3). Zone AL1 (7630 to 7500 cal yr BP) had high percentages of Pinus, P. menziesii, Alnus cripa (Sitka alder), and Artemisia pollen. Zone AL2 (7500 to 6300 cal yr BP) is characterized by a substantial increase in Populus (quaking aspen) pollen with a concomitant decrease in Pinus, P. menziesii, and A. crispa. Artemisia percentages decreased in this period as well. In zone AL3 (6300 to 3000 cal yr BP), Populus pollen showed an overall decline with a brief period (3700 to 3000 cal yr BP) when Populus increased. Pinus pollen percentages remained steady as Picea pollen became more prominent. In zone AL4 (3000 to 1650 cal yr BP), Populus pollen declined to trace values as Pinus percentages increased. During zone AL5 (1650 cal yr BP to present), Populus values remained negligible, whereas overall Pinus percentages increased, along with increases in T. mertensiana, Abies, and Artemisia, suggestive of the present-day forest in the watershed. The pollen data outlined here correspond well with the pattern described by Hansen (Reference Hansen1943), who noted high percentages of Pinus with Abies, Picea, and T. mertensiana throughout. In addition, Populus, present early on, declined and is absent as the record approaches the present day (Hansen, Reference Hansen1943).
Paleoecological data from Anthony Lake, northeastern Oregon. All data plotted against age (cal yr BP). (A) Selected pollen percentage data grouped as arboreal and nonarboreal. (B) Charcoal accumulation rates (CHAR) values (gray line), background CHAR rates (black line) calculated using a 500 yr smoothing window. (C) CHAR peaks (triangles) plotted as magnitude (particles/cm2). (D) Inferred fire-episode frequency calculated using a 1000 yr smoothing window. The horizontal lines indicate pollen zones AL1–AL5.

Aside from temporary increases surrounding large peaks, fire was consistent throughout the record (~1.11±1.19 particles cm2/yr) and was not influenced by changes in forest composition, although fire frequency did vary (Fig. 3). From 7600 to 3600 cal yr BP, fire frequency declined from about 8/1000 yr to 2/1000 yr. Fire frequency increased between 3600 and 2700 cal yr BP to 4/1000 yr, remained between 3/1000 and 4/1000 yr until 1600 cal yr BP, and then increased to 6/1000 yr by 1200 cal yr BP. From 1200 cal yr BP to the present, fire frequency has been 6/1000 yr. MFI values also varied across the pollen zones. Only one fire episode was identified in zone AL1, so MFI was not calculated for this zone. MFIs for the other pollen zones were as follows: AL 2 (7500 to 6300 cal yr BP), 140±150 yr (MFI±1 SD) (n=9); AL 3 (6300 to 3000 cal yr BP), 315±250 yr (n=10); AL 4 (3000 to 1650 cal yr BP), 280±180 yr (n=5); and AL 5 (1650 cal yr BP to present), 170±90 yr (n=10). Within zone AL 2, an increase in fire frequency (shorter MFI) corresponds to a period of increased Populus pollen percentages. During zone AL 3, Populus percentages declined as MFI increased. During zones AL 4 and AL 5 as MFI became shorter, there was a shift in forest composition as Pinus and T. mertensiana became more abundant, but there was no corresponding increase in Populus as noted in zone AL 2. CHAR increased in zone AL 5 suggesting greater biomass consumption to accompany an increase of fire occurrence (Fig. 3).
Modern climate-analogue results
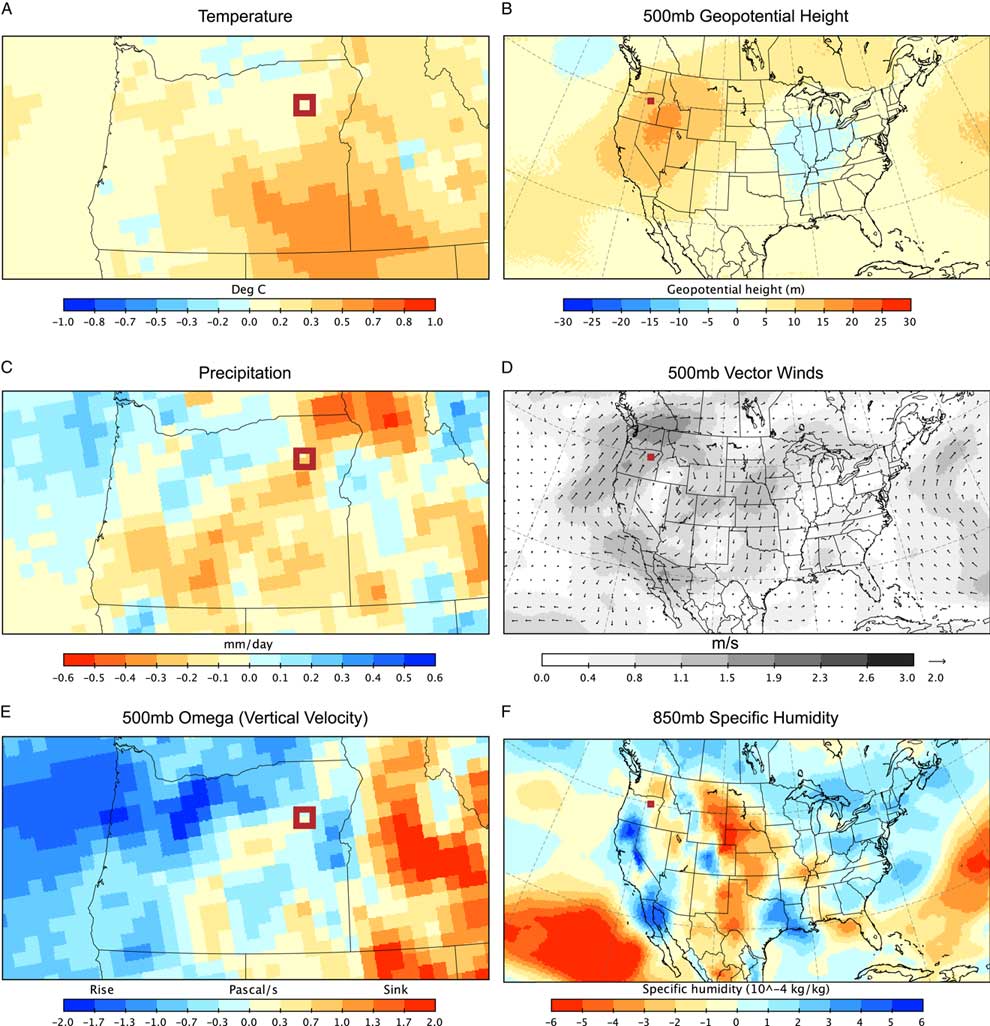
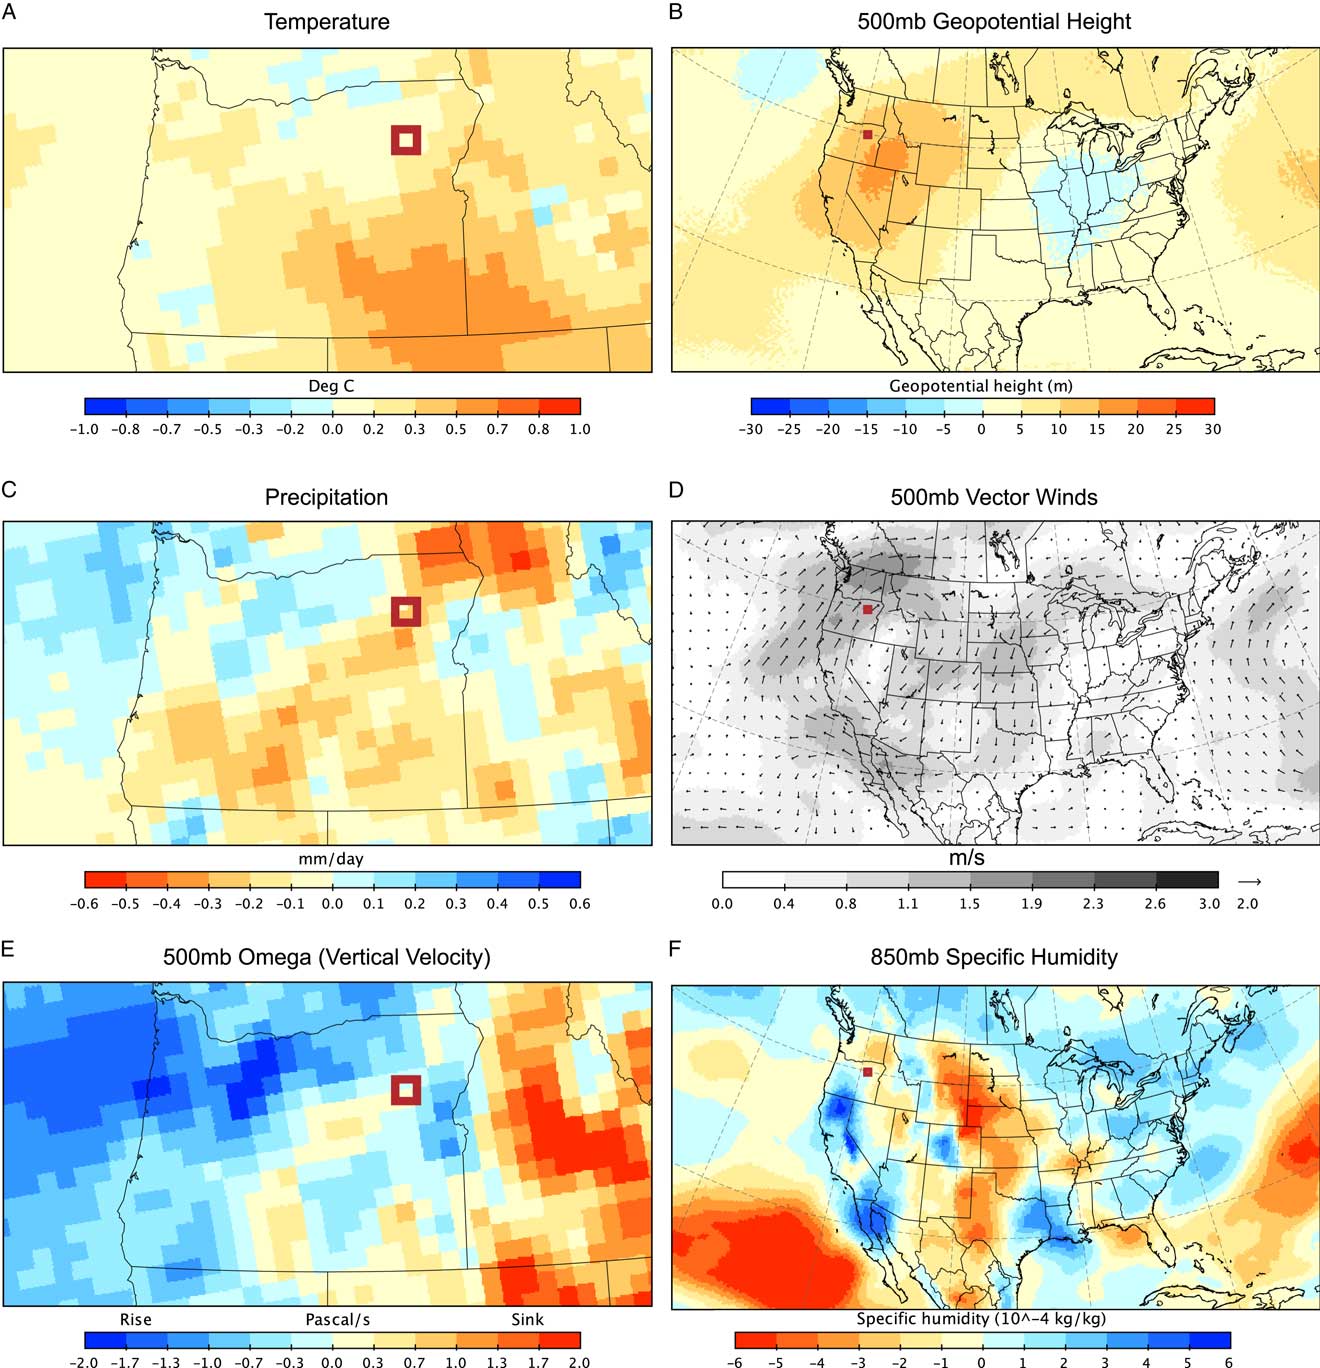
Composite-anomaly values for the month of July during high-fire years (1986, 1989, 1995, 1996, and 2006) are plotted in Figure 4 to illustrate modern surface and atmospheric processes as analogues to the past conditions that supported fire in the Anthony Lake region. During the high-fire case years, the region experienced higher-than-normal temperatures (Fig. 4A), which are associated with higher-than-normal 500 mb heights, indicating stronger-than-normal ridge and higher-than-normal pressure centered over the western Great Basin (Fig. 4B). Similar fire-temperature linkages were also evident in Great Basin paleoenvironmental reconstructions (see Reinemann et al., Reference Reinemann, Porinchu, Bloom, Mark and Box2009, and references therein; Lundeen and Brunelle, Reference Lundeen and Brunelle2016). Lower-than-normal precipitation occurs in the northeastern part of Oregon (Fig. 4B) during July of the modern climate-analogue case years. The stronger-than-normal ridge is associated with clockwise upper-level flow (based on 500 mb vector winds; Fig. 4D), indicating the anomalous component of southerly flow into the region. Overall, weak stronger-than-normal sinking motions at the 500 mb level (Fig. 4E, indicated in yellow) are evident within the region of Anthony Lake, indicating suppression of precipitation. There appears to be considerable spatial variability of available moisture, via specific humidity at the 850 mb level, during July months of the high-fire case years (Fig. 4F) with greater-than-normal specific humidity in northern California and lower-than-normal specific humidity in the western Great Basin region. However, because the vertical motions near Anthony Lake indicate greater-than-normal sinking motions, precipitation is generally suppressed despite available moisture. Overall lower-than-normal precipitation during July of the selected years is a function of stronger-than-normal high pressure in the region (500 mb geopotential height and vector winds) and enhanced sinking motions (500 mb Omega) suppressing uplift of atmospheric moisture (850 mb specific humidity) to induce low fuel moisture conditions conducive for fire.
Composite-anomaly maps for high-fire years 1986, 1989, 1995, 1996, and 2006. The box identifies the location of Anthony Lake. Each map contains composite-anomaly values for the months of July from the selected high-fire years compared to the long-term mean (1981–2010). (A) Surface temperature. (B) The 500 mb geopotential height indicating anomalous ridges (red) or troughs (blue). (C) Precipitation rate at the surface. (D) The 500 mb vector winds indicating anomalous component of flow. (E) The 500 mb Omega (vertical velocity) indicating rising or sinking motions. (F) The 850 mb specific humidity indicating moisture availability.
DISCUSSION
The environmental reconstruction from Anthony Lake is consistent with the general sequence of Holocene climate change outlined for the PNW (Thompson et al., Reference Thompson, Whitlock, Bartlein, Harrison and Spaulding1993 Hebda and Whitlock, Reference Hebda and Whitlock1997). The sequence consists of a warm and dry early Holocene, becoming cooler and wetter in the mid-Holocene, and transitioning into the present-day climate in the late Holocene. These changes are ultimately the result of long-term trends in solar radiation, related to orbital controls, which decreased seasonality from the early Holocene to the late Holocene (Bartlein et al., Reference Bartlein, Hostetler and Alder2014; Bartlein et al., Reference Bartlein, Harrison, Brewer, Connor, Davis, Gajewski and Guiot2011). At Anthony Lake, these periods are represented by early Holocene pollen zones AL1 and AL2, mid-Holocene pollen zone AL3, and late-Holocene pollen zones AL4 and AL5. In the early Holocene, forests in the Anthony Lake watershed were composed of pine, fir, and Douglas-fir, with some quaking aspen. Nonarboreal pollen abundance suggests that the understory was relatively open, with Artemisia and grasses dominating. Beginning around 7500 cal yr BP, forest composition became dominated by quaking aspen with some pine. Doerner and Carrara (Reference Doerner and Carrara2001) identified a similar abrupt decline in Pinus pollen at McCall fen in central Idaho. At Anthony Lake, pulses of fire events at this time, and again during the peak of quaking aspen abundance at 6300 cal yr BP, suggest that summer conditions were warm and dry. Pierce et al. (Reference Pierce, Meyer and Jull2004), working in the South Fork Payette River watershed in central Idaho, also suggest that regionally warm periods likely increased drought conditions and encouraged high-severity fire events.
Quaking aspen is considered a pioneer species in that it readily regenerates after disturbance, can endure short growing seasons, and tolerates low-nutrient soils (Jones et al., Reference Jones, Kaufmann and Richardson1985; Sims et al., Reference Sims, Kershaw and Wickware1990; Carter et al., Reference Carter, Brunelle, Minckley, Shaw, DeRose and Brewer2017). However, a limiting requirement is sufficient soil moisture during the growing season (Morelli and Carr, Reference Morelli and Carr2011). In addition to soil moisture, the presence of pine can influence aspen-fire interactions (Morris et al., Reference Morris, Brunelle, Munson, Spencer and Power2013; Shinnemann et al., Reference Shinneman, Baker, Rogers and Kulakowski2013; Lundeen and Brunelle, Reference Lundeen and Brunelle2016). Although soil moisture was not explicitly examined in our study, it is likely that the pattern of persistent cold from winter into summer between 7500 and 6300 cal yr BP may have led soil moisture to remain high throughout the summer, allowing quaking aspen to expand. Beginning at 6300 cal yr BP, quaking aspen abundance in the watershed diminished, but it was still a common tree through the mid-Holocene. Forest stands were composed of spruce, likely Engelmann spruce, and pine, with some subalpine fir. The understory was dominated by Artemisia and grasses, and fire events became less frequent, as demonstrated by a 2000 yr period from 5140 to 3130 cal yr BP in which only three fire events were identified. Conditions conducive for fires became less common, but the conditions necessary for quaking aspen regeneration must have been frequent enough for the species to remain a viable component of the forest. From 3000 to 1650 cal yr BP, there was a notable decline in quaking aspen, and it essentially disappeared from the watershed by 1650 cal yr BP. The forest understory composition has remained consistent over the last 3000 yr, with Artemisia and grasses being the dominant plants. Fire occurrence from 3000 to 1650 cal yr BP was similar to the previous 2000 yr, with the pattern of long fire return intervals continuing. However, beginning around 1650 cal yr BP, fire events became more frequent and biomass burning also increased, as indicated by a rise in BCHAR. This suggests that both the length and duration of summer drought increased. As a result, conditions associated with the expansion of quaking aspen ca. 3000 cal yr BP did not occur, whereas the conditions necessary for fire occurred more frequently. This pattern is akin to that found in the eastern Rocky Mountains following a quaking aspen expansion ca. 3400 cal yr BP (Carter et al., Reference Carter, Brunelle, Minckley, Shaw, DeRose and Brewer2017).
Modern climate analogues suggest that the positive 500 mb height anomalies identified by our analysis of modern fire years (Fig. 4) is a typical atmospheric scenario for generating fires (Bartlein et al., Reference Bartlein, Hostetler, Shafer, Holman and Solomon2003; Hostetler et al., Reference Hostetler, Bartlein, Holman, Shafer and Solomon2003). We suggest that this climatological configuration, and the associated weather extremes, stressed or suppressed quaking aspen over the last 1650 yr. It is likely that similarly persistent anomalous high pressure was responsible for periods when fires were more common, such as the period from 7500 to 6300 cal yr BP (Hermann et al., Reference Hermann, Oster and Ibarra2018). However, because quaking aspen’s presence expanded during that time, the overall (seasonal) precipitation and temperature characteristics were likely different from those of the last 1650 yr.
Intensified summer drought has been identified as an important factor in fire occurrence during the last several millennia in the PNW (Trouet et al., Reference Trouet, Taylor, Wahl, Skinner and Stephens2009). There is also evidence that winter precipitation anomalies, controlled by El Niño–Southern Oscillation and North Pacific sea-surface temperatures, can affect fuel moisture and lead to enhanced fire conditions during a normal summer (Trouet and Taylor, Reference Trouet and Taylor2010). Climate models suggest that high-elevation ecosystems will decrease in size because of unfavorable seasonal changes (warmer earlier spring, more mild winters) (Shafer et al., Reference Shafer, Bartlein, Gray and Pelltier2015). The record from Anthony Lake may be demonstrating a similar change that occurred as seasonal variability decreased over the last 3000 yr. If the modern climate analogs are representative of the future, the fire regime of the last 1650 yr will likely persist, and our results suggest quaking aspen populations could be threatened in the subalpine forests surrounding the Columbia River basin.
CONCLUSION
The vegetation reconstruction outlined here suggests that forest composition and abundance at Anthony Lake was relatively stable over the last 7600 yr with the exception of the early expansion and subsequent decline of quaking aspen. Fire was most active from 7400 to 6000 cal yr BP and from 1650 cal yr BP to the present. The expansion of quaking aspen coincides with the early Holocene increase in fires, but a similar response was not seen over the last 1650 yr, suggesting that other factors, such as soil moisture, were responsible for the pattern of quaking aspen abundance. Modern climate analogues of recent fires in the region indicate the presence of an anomalous ridge (higher-than-normal pressure) likely sets the stage synoptically for delivery of dry air from the Great Basin via southerly anomalous flow. The presence of the anomalous ridge over the Great Basin includes associated sinking motions that suppressed precipitation in the region of Anthony Lake, thus creating conditions to support fire. We suggest that this pattern has been more common over the last 1650 yr than during the period from 6300 to 1650 cal yr BP.
Our results provide geographic context for vegetation-fire-climate relationships in a region that lies between the PNW and the interior intermountain West (i.e., Rocky Mountains). Research within the PNW indicates the important linkages between the Pacific Ocean and climate on vegetation changes and fire (e.g., Hessl et al., Reference Hessl, McKenzie and Schellhaas2004; McKenzie et al., Reference McKenzie, Gedalof, Peterson and Mote2004; Kitzberger et al., Reference Kitzberger, Brown, Heyerdahl, Swetman and Veblen2007; Steinman et al., Reference Steinman, Abbott, Mann, Stansell and Finney2012). In contrast, evidence from sedimentary records in the Rocky Mountains (e.g., Minckley et al., Reference Minckley, Shriver and Shuman2012; Carter et al., Reference Carter, Power, Lundeen, Morris, Petersen, Brunelle and Anderson2018) indicates linkages between anomalous high pressure and delivery of dry air from the Great Plains as potential drivers for vegetation change and fire. Anthony Lake, which lies between the PNW and the Rocky Mountain region, exhibits similar climatic processes, although the anomalous high pressure is centered over the Great Basin. Anomalous flow from the Great Basin may be characteristic of the synoptic processes that control fire in the region and may contribute to an increase of fires in the future.
ACKNOWLEDGMENTS
CJL and PJB designed the project. CJL, JJS, TAM, and MJP performed the fieldwork and data analysis. CJL, JJS, TAM, MJP, and PJB wrote the manuscript with assistance from J. Preece. We thank two anonymous reviewers for their constructive comments on the original manuscript. This project was supported by National Science Foundation grants ATM 0117160 and ATM 0714146 to PJB and an American Association of Geographers Research Grant to CJL.