

I. INTRODUCTION
One important early post-WWII debate, which took place particularly in the UK, concerned the demand and inflationary pressures at which it was best to run the economy. The context for this debate was provided by early Keynesian theory with its absence of a unique full-employment equilibrium and its mainly forgotten, but still relevant, microeconomic underpinnings. The original Phillips curve was highly relevant to this debate. All this changed, however, with the introduction of the expectations-augmented version of the curve with its natural rate of unemployment, and associated unique equilibrium GDP, as the only values consistent with a stable inflation rate. This new view of the economy found easy acceptance partly because most economists seem to feel deeply in their guts—and their training predisposes them to do so—that the economy must have a unique equilibrium to which market forces inevitably propel it, even if the approach is sometimes, as some believe, painfully slow.
The current behavior of economies with successful inflation targeting is inconsistent with the existence of a unique non-accelerating inflation rate of unemployment (NAIRU) but is consistent with evolutionary theory in which the economy is constantly evolving in the face of path-dependent, endogenously generated, technological change, and has a wide range of unemployment and GDP over which the inflation rate is stable. This view explains what otherwise seems mysterious in the recent experience of many economies and makes the early post-WWII debates not seem as silly as they appeared to be when economists came to accept the assumption of a perfectly inelastic, long-run Phillips curve located at the unique equilibrium level of unemployment. One thing that stands in the way of accepting this view, however, is the tyranny of the generally accepted assumption of a unique, self-sustaining, macroeconomic equilibrium.
This paper covers some of the key events in the theory concerning, and the experience of, the economy’s behavior with respect to inflation and unemployment over the post-WWII period. The stage is set by the pressure-of-demand debate in the 1950s and the place that the simple Phillips curve came to play in it. The action begins with the introduction of the expectations-augmented Phillips curve and the acceptance by most Keynesians of its implication of a unique, self-sustaining macro equilibrium. This view seemed not inconsistent with the facts of inflation and unemployment until the mid-1990s, when the successful adoption of inflation targeting made it inconsistent with the facts. An alternative view is proposed, one that is capable of explaining current macro behavior and that reinstates the relevance of the early pressure-of-demand debate.
II. THE 1950s
During the 1950s, British economists engaged in debates over both theory and policy that were significantly different from those that occurred in period between the two world wars.
Keynes Triumphant
By the mid-1950s, Keynesian economics had been fairly well established in the profession. Critically, it contained no full-employment equilibrium. Instead, aggregate-desired expenditure could equal aggregate production at any level of GDP and employment. In modern terms, there were no natural rates of GDP, Y*, and unemployment, U*.
During the 1950s, extensive micro underpinnings had been provided for Keynesian macroeconomic theory. In particular, firms’ horizontal short-run marginal cost (SRMC) curves plus full-cost pricing explained why firms reacted to variations in demand mainly by altering output rather than prices in the short run. Numerous empirical studies had supported these two key observations. Footnote 1
Although there was strong evidence that the SRMC curve of the typical manufacturing firm was horizontal, there was confusion about how to interpret this observation. Footnote 2 The correct interpretation lies in the nature of the firm’s fixed factor. The standard textbook talks of spreading more or less of the variable factor, usually taken to be labor and materials, over a given quantity of a fixed factor, usually taken to be capital equipment in the case of manufacturing, or land in the case of agriculture. It then appeals to the law of diminishing returns to explain a U-shaped SRMC curve. But this applies only if the fixed factor is subject to a strong equality: K=K* (where K* is the fixed amount of capital available in the short run and K is the amount actually employed). In most situations, however, the fixed factor is subject to an inequality constraint: one can use less but not more than the fixed amount available in the short run, K < K*. By leaving some of its capital unemployed (e.g., by working shorter hours or closing one or more of a series of parallel production facilities), the ratio of capital to labor (and all other variable inputs) can be held constant, allowing the firm to produce at a constant marginal cost for any output up to full capacity.
Also, a substantial amount of direct questioning showed that firms claimed to follow a full-cost pricing rule: calculating full cost, adding a markup, then selling whatever was demanded at that price. Footnote 3 This seemed implausible to those who believed in a positively sloped SRMC curve, but it was eminently plausible given a horizontal SRMC curve. All that was then required was, first, that the markup at normal capacity was at or near the profit-maximizing markup and, second, either that the elasticity of demand did not change significantly as demand varied cyclically or that the benefit gained from constantly changing price by small amounts as the profit-maximizing markup changed cyclically was less than the cost.
So these two empirically supported and theoretically defensible propositions provided strong support for the prediction that cyclical variations in demand would be met by variations in output with prices more or less constant.
An excellent illustration of the cost of not educating students in the history of our subject is the almost total loss of any knowledge of the full-cost pricing controversy and of the empirical evidence for horizontal SRMC curves among modern economics students (but not all business school students). Footnote 4 Today, the assumption of a positively sloped SRMC curve over all relevant ranges of output is ubiquitous and is a key assumption in the proofs of many propositions that would not be true if SRMC curves were horizontal up to capacity. Footnote 5
The Pressure-of-Demand Debate Footnote 6
At that time, most economists accepted that, ceteris paribus, inflation was undesirable and that if it could be manipulated independently of other economic variables, zero inflation would be the obvious goal. But such independence of the inflation rate from other real economic variables was not generally accepted at the time. Instead, the debate concerned how much inflation should be tolerated as a price of achieving two other social goals: low unemployment and high growth. It was taken for granted that the economy could be operated with varying pressures of aggregate demand, unemployment, and inflationary pressure—higher unemployment being associated with lower inflationary pressures.
With respect to unemployment, some argued that inflation had to be kept under control even if that required a moderately high rate of unemployment. In contrast, most Keynesians argued that a mild rate of inflation was an acceptable price to pay for maintaining full employment.
But what about stimulating economic growth, an issue that had been a major concern of the British government in the immediate postwar period? Although there was lack of agreement about how to determine the UK’s optimal rate of growth, there was little doubt among UK policymakers in the late 1950s and early 1960s that the current growth rate was too low. Keynesians argued that running the economy with high aggregate demand pressure would provide the profits needed to finance investment, and the demand needed to induce firms to raise productivity—albeit at the cost of some mild inflationary pressure. In contrast to this ‘carrot theory’ of growth, others, of whom professor Frank W. Paish of the London School of Economics was a key advocate, argued that running the economy with low aggregate demand pressure would provide the stick that would encourage economic growth by making it imperative for businesses to raise productivity as the main method that would then be available for sustaining profits (Paish Reference Paish1958, Reference Paish1962, Reference Paish1970).
In the late 1950s, the Phillips curve was injected into this debate. To those Keynesians who accepted Alban William Phillips’s analysis, his curve seemed to apply mainly to the range of excess aggregate demand, while, in the range of deficient aggregate demand, its relative flatness seemed to provide evidence of a downward stickiness of prices that would prevent price reductions from ending periods of unemployment over any acceptable time period. With respect to inflation and unemployment, the Phillips curve seemed to show that the rate of unemployment consistent with a stable price level was about 2.5%. Footnote 7 Although no continuous trade-off was implied, this empirical estimate came into the debate like a thunderbolt. The relatively low figure seemed to support those who would accept some higher-than-necessary unemployment as a cost of restraining inflation and encouraging growth.
III. THE 1960s Footnote 8
Sometime in the 1960s, many economists came to see the Phillips curve as providing a stable trade-off between inflation and unemployment. When Richard G. Lipsey did adopt this trade-off version, as for example in Lipsey (Reference Lipsey and Ross1965), inflationary points on the Phillips curve represented disequilibrium points that had to be maintained by monetary policy that perpetuated the disequilibrium by suitable increases in the rate of monetary expansion. In the new Classical interpretation that began with Edmund S. Phelps (Reference Phelps1967), Milton Friedman (Reference Friedman1968), and Robert E. Lucas Jr. and Leonard A. Rapping (Reference Lucas and Rapping1969), each point was an equilibrium point because demands and supplies of agents were shifted from their full-information locations when they misinterpreted the price signals. Footnote 9 There was, however, only one full-information equilibrium of GDP, Y*, and unemployment, U*.
In this new version, recorded unemployment was actually voluntary-arising because workers sometimes expected higher rates of inflation than actually occurred. This induced them to reject some available jobs because they thought the real wage would be lower than it turned out to be. Footnote 10 Booms in which GDP exceeded its potential level and employment was unusually high were also possible if an unexpected inflation led firms and workers to misinterpret a general rise in prices as a rise in their relative price or wage, and produce and work more. Footnote 11 If the inflation continued, firms and workers would eventually come to expect it and revert to their full-information behavior. If the central bank wished to perpetuate the boom, it would have to generate a higher rate of inflation unexpectedly, but one which agents would sooner or later come to expect, and so on with the inflation rate ever accelerating.
This led to the expectations-augmented Phillips curve and its vertical, long-run shape. Now, any level of real GDP other than Y* would cause the price level to change at a rate shown by the short-run Phillips curve, and, if the money supply was not expanded in compensation, the economy would return to its natural rates of U* and Y*.
Such is the ingrained feeling among most economists that the economy must have a unique, market-clearing equilibrium, to which it returns after any deviation, that there was no significant protest at the abandonment of the Keynesian position that the economy could persist for long periods, if not forever, at positions other than U* and Y*.
IV. SUSTAINED INFLATIONS ESTABLISHED AND ENDED: 1970–1990
The early 1970s saw a new phenomenon brought on by the OPEC-induced dramatic rise in the price of oil (and hence also the prices of its many by-products): stagflation. Footnote 12 Partly in response to the confusion caused by this period of rising unemployment combined with rising prices, Keynesians combined the IS and LM curves into an aggregate demand (AD) curve and added a short-run aggregate supply (AS) curve. Stagflation was then explained by supply-side shocks that shifted the AS curve upwards, causing prices to rise and GDP to fall along the negatively sloped AD curve. The model was closed by an expectations-augmented Phillips curve that showed the speed with which equilibrium was re-established whenever it was disturbed. Footnote 13
In contrast, many New Classical economists argued that stagflation provided a conclusive refutation of Keynesian economics. Speaking for myself, I was so intent in showing that, contrary to this view, the AD-AS construction provided a simple Keynesian explanation of stagflation that I paid too little attention to the enormous importance of the new assumption introduced into Keynesian models. The addition of an expectations-augmented Phillips curve, negatively sloped in the short run but vertical in the long run, introduced a unique macroeconomic equilibrium at Y* and U* that would be reached sooner or later, whatever macroeconomic policy was adopted.
The decade of the 1980s was a period of rapid inflations in most developed countries, but ones that seemed more normal in the sense of appearing to respond more to demand than to cost pressures. Unorthodox theories of inflation gradually fell into disrepute, and it came to be accepted that only aggressive action by central banks could curtail inflation. Footnote 14 Slowly during the 1980s, many central banks came to this view. By altering short-term interest rates, they had a direct effect on interest-sensitive expenditures and, more importantly, an indirect effect on the rate of monetary expansion.
During the late 1980s and early 1990s, many countries drove inflation down from high to relatively low levels. This did not happen, however, without serious controversy, with many economists arguing that the high temporary unemployment rates that accompanied this policy were not an acceptable price to pay for lowering the inflation rate. For a coverage of the many conflicting contemporary views on this policy, see Lipsey (Reference Lipsey, Backhouse and Salanti2000).
Once low inflation rates had been established in the early 1990s, one by one, these countries adapted regimes of inflation targeting that began an era of sustained, low, and relatively stable inflation rates. The early target rates and bands varied somewhat, but most central banks eventually settled on a target of 2% and a permissible band of one percentage point on either side of the target. By 2014, twenty-nine central banks had officially adopted inflation targets (Steve Ambler Reference Ambler2014).
V. SUCCESSFUL INFLATION RATE TARGETING
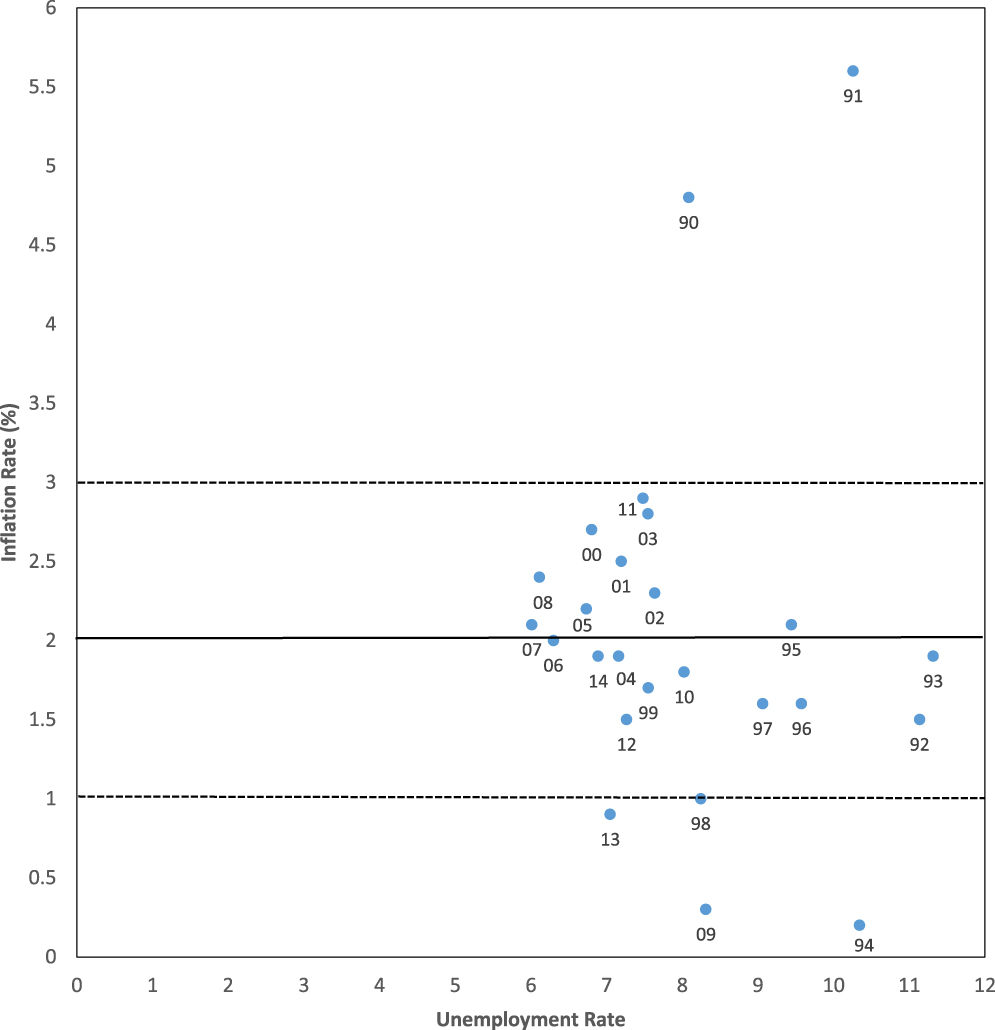
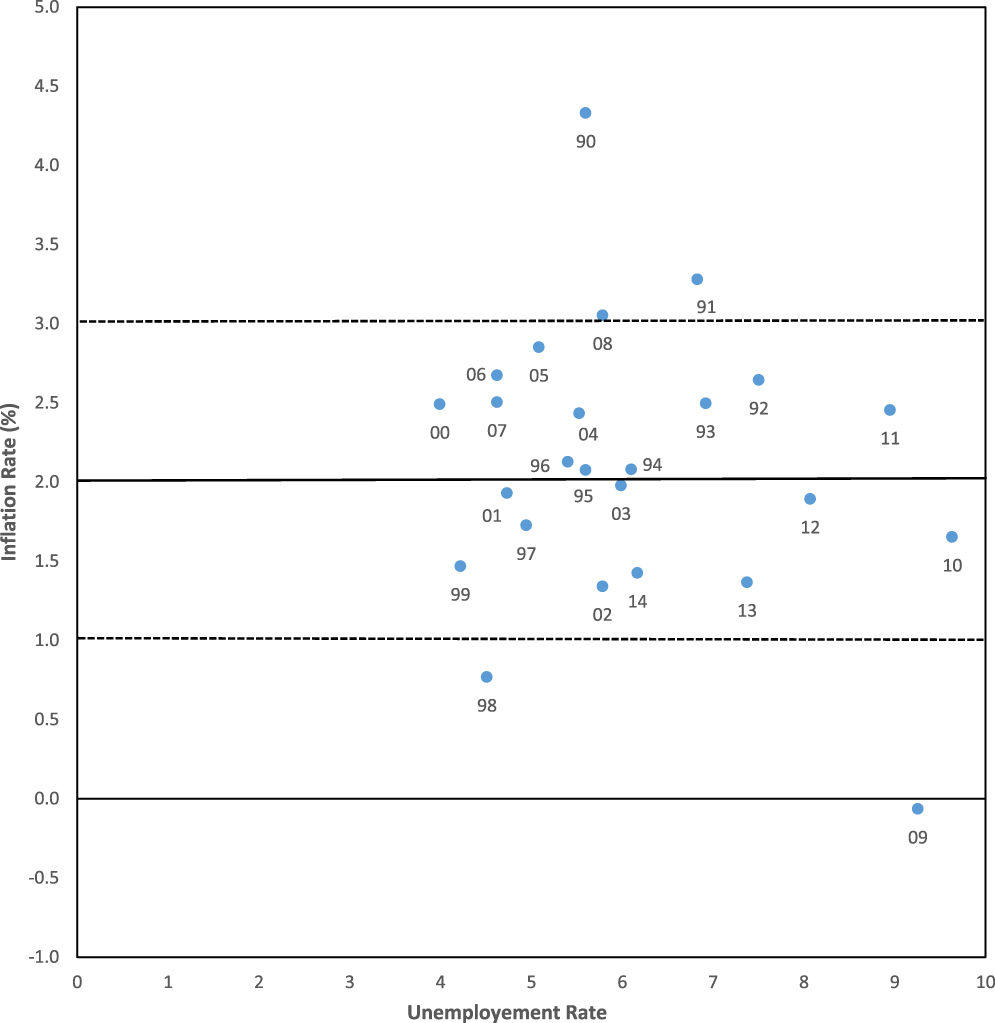
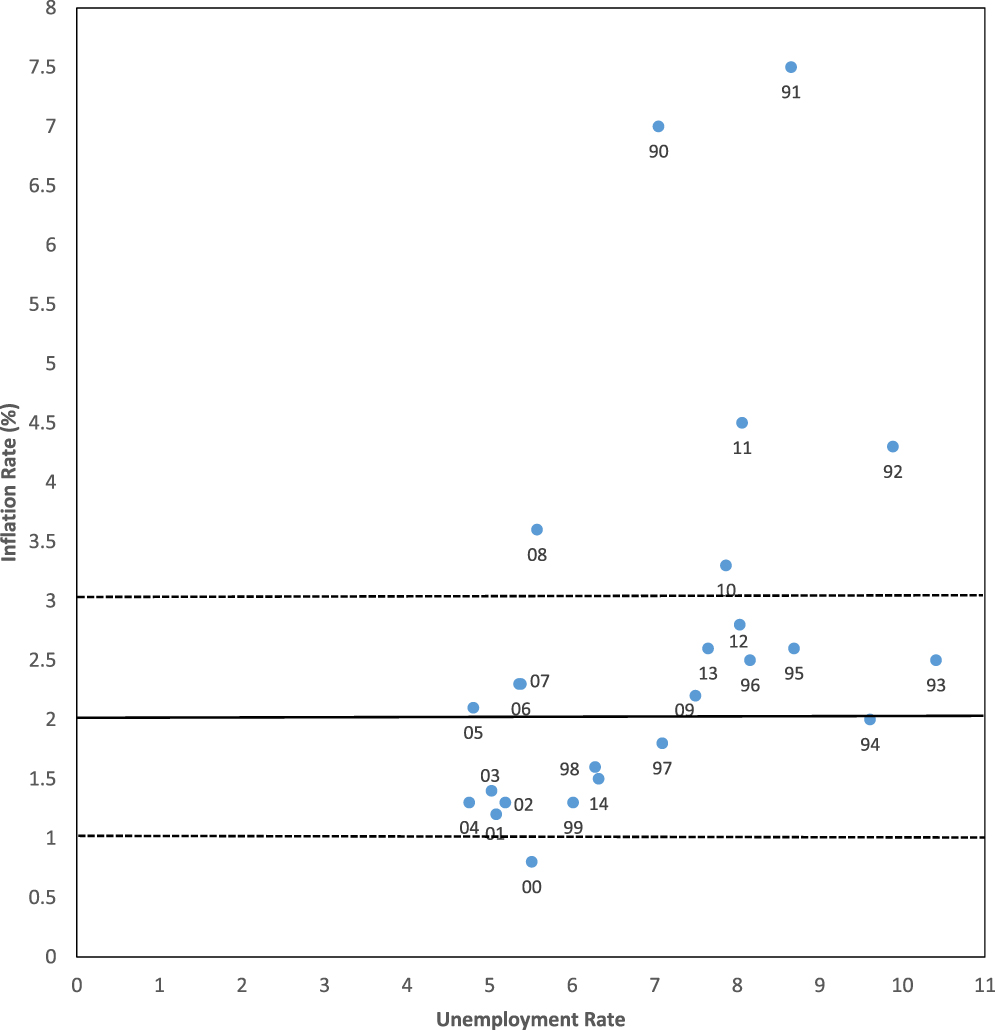
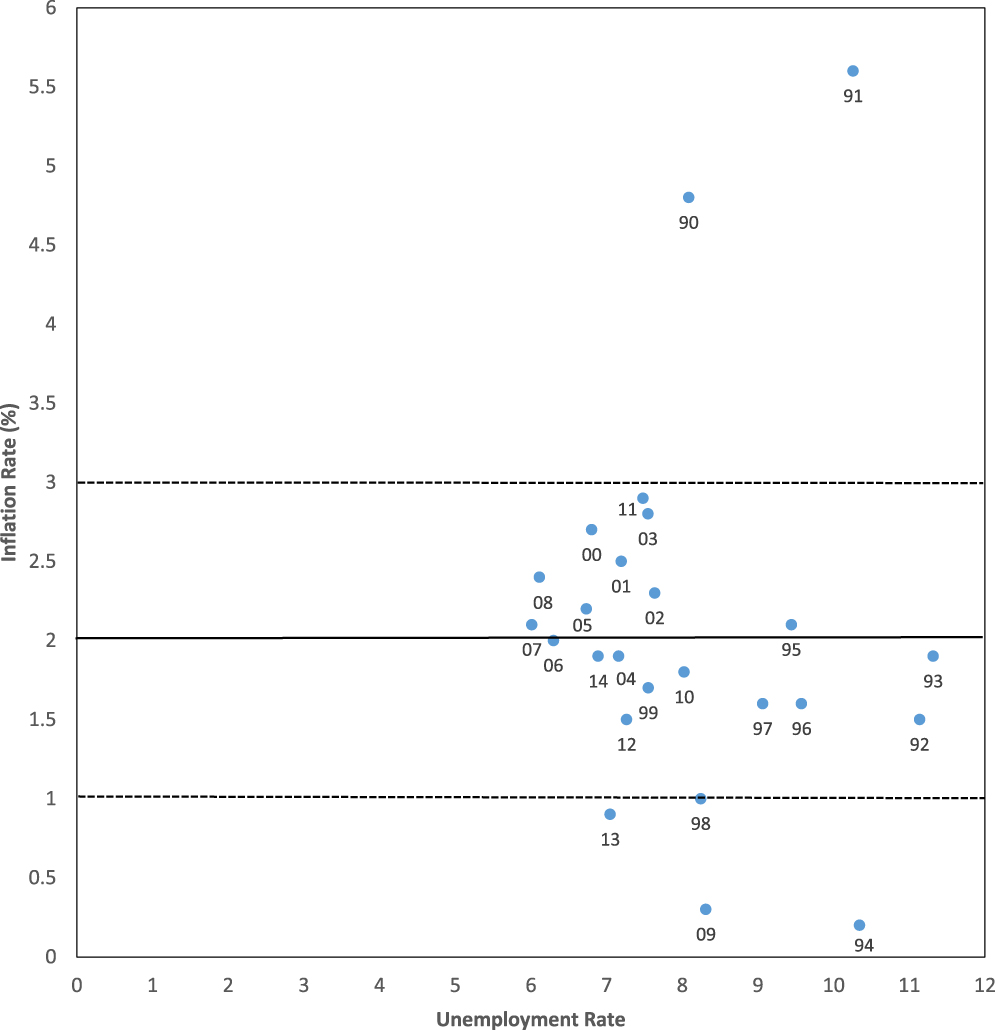
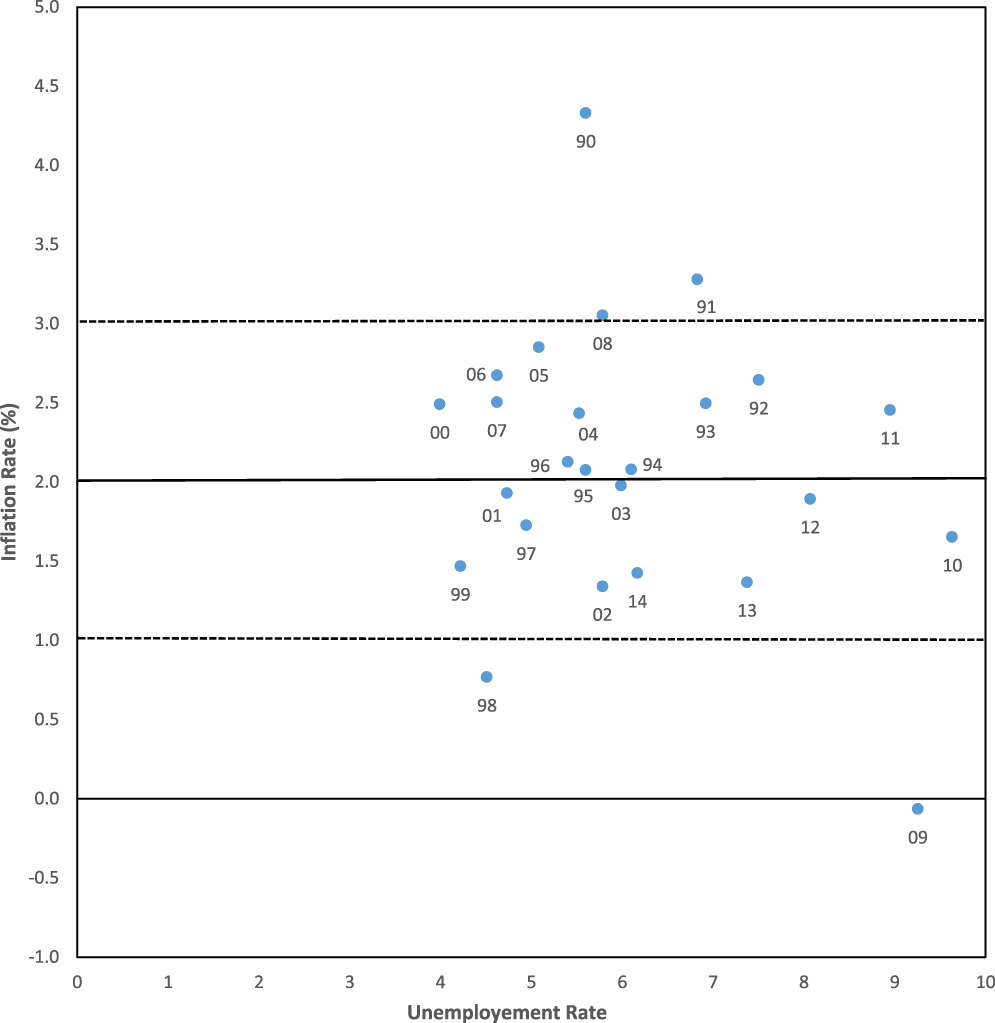
Figures 1 to 3 provide scatters of unemployment against the inflation rate as measured by the index that the relevant central bank is targeting—the CPI for Canada and the UK, and the personal consumption expenditures (PCE) price index for the Federal Reserve System. The charts show some interesting common behavior, with the high inflation rates of the 1980s continuing into the early 1990s but then being followed by two decades of much lower average rates. Although the inflation rates have varied since then, none of the countries have shown any clear, systematic tendency for its inflation rate to be negatively related to its unemployment rate—a rate that ranged over the period from 9.6% to 4.0% in the USA, from 10.2% to 4.7% in the UK, and from 11.4% to 6.0% in Canada).
CPI Inflation Rate and Percentage of the Labor Force Unemployed, Canada 1990–2014.
OECD (2013). “Main Economic Indicators – complete database,” Main Economic Indicators (database). doi: 10.1781/data-00052-en (accessed 15 October 2015).
PCE Inflation Rate and Percentage of the Labor Force Unemployed, USA 1990–2014.
US Bureau of Economic Analysis (2015). Personal Consumption Expenditures: Chain-type Price Index,” FRED (database), Federal Reserve Bank of St. Louis. https://research.stlouisfed.org/fred2/series/PCEPI/ (accessed 14 October 2015).
US Bureau of Labor Statistics (2015). “Employment Status of the Civilian Noninstitutional Population, 1944 to date,” Household Data Annual Averages, Labor Force Statistics from the Current Population Survey. http://www.bls.gov/cps/cpsaat01.htm (accessed 14 October 2015).
CPI Inflation Rate and Percentage of the Labor Force Unemployed, UK 1990–2014.
OECD (2013). “Main Economic Indicators – complete database,” Main Economic Indicators (database). doi: 10.1781/data-00052-en (accessed 15 October 2015).
UK Office of National Statistics (2015). “People by economic activity by age (seasonally adjusted),” Reference Table A01: Summary of labour market statistics. https://www.ons.gov.uk/ons/rel/lms/labour-market-statistics/october-2015/table-a01.xls (accessed 15 October 2015).
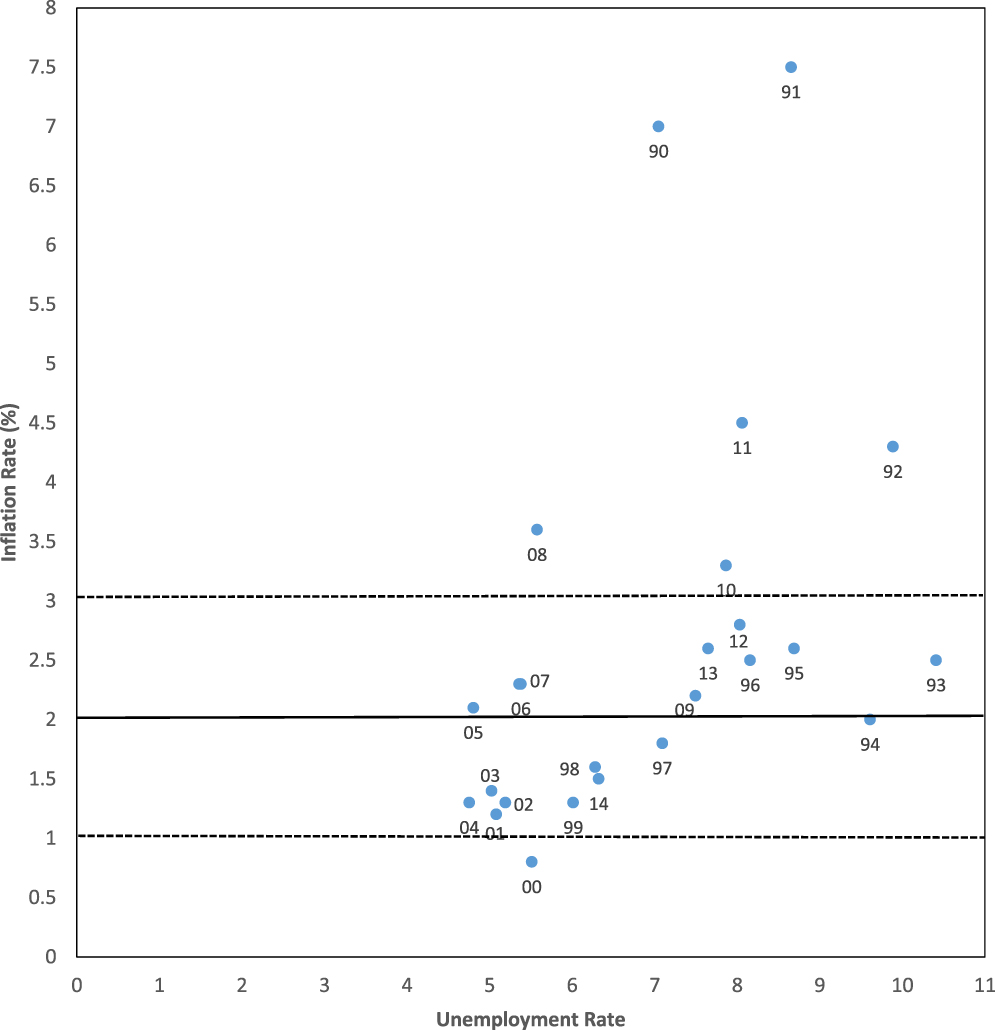
Within those broad similarities, there have been differences. In Canada, the rate has been within the Bank of Canada’s target band of ± 1% on either side of 2%, except when it fell below it in 1998, 2009, and 2013. In the US, the inflation rate was within the target band in every year except for 2008, when it was marginally above the upper bound, and 2009, when it was marginally below the lower bound. In the UK, inflation did not fall below 3% until 1993, one year behind the USA and Canada. Then, from 1993 until 2001, unemployment fell steadily from 8.5% to 5.0% while inflation fell from 2.7% to 1.3%. Inflation and unemployment stayed fairly constant from 2001 to 2004. Then, unemployment rose slightly while inflation rose dramatically from 1.3% to 3.6% in 2008 while unemployment fell slightly until 2008. With unemployment staying within the range 7.6%–8.0%, inflation rose from 2.1% in 2009 to 4.4% in 2011 and then fell back to 2.8% in 2012. Lipsey and Alec Chrystal (Reference Lipsey and Chrystal2015, p. 536) deal in some detail with the UK experience and show, among other things, that when core rather than full CPI inflation is considered, the inflation rate fell only once below the target band (1999) and rose only once above it (2010), the later breach being accounted for by a sharp increase in the UK’s value-added tax.
Simple inspection of these scatters suggests that these data are not consistent with a negative relation between the rate of inflation and unemployment, which is required if there is a unique Y* and U*, deviations from which set up inflationary or deflationary pressures to push the economy towards these values.
In a more detailed investigation of this type of data, Kenneth Carlaw and Lipsey (Reference Carlaw and Lipsey2012) correlate the inflation rate and unemployment for five countries: France, Italy, Spain, the UK, and the US. They also relate the acceleration of these countries’ inflations to their GDP gaps, defined as the difference between their actual unemployment rates and their NAIRUs, estimated using a Kalman filter. They conclude that starting in the early 1990s, the data for these countries are not consistent with either a negative relation between unemployment and the rate of inflation or a unique NAIRU below which inflation accelerates and above which inflation decelerates. Footnote 15
VI. SOME OLD IDEAS REHABILITATED AND NEW ONES ADDED
In the study just referred to, Carlaw and Lipsey distinguish three main types of macroeconomic theories. The first type they term “equilibrium with deviations (EWD) theories.” These are theories in which a full-information, unique equilibrium exists but can be deviated from due to such transitory forces as errors in perception or lagged reactions to random fluctuations in tastes and technology. They can be expressed in terms of the static concept of a general equilibrium to which the economy returns after a transitory disturbance or the textbook unique-equilibrium, balanced-growth path, along which agents wish to do the same thing, period by period, and to which the economy will return if disturbed. This class includes most New Keynesian and earlier New Classical theories. In all EWD theories, the past is repeatable and disturbances leave no trace once their effects have been worked out.
The second class may be termed “equilibrium always (EA) theories.” Theories in this class include some recent versions of New Classical models, which contain neither GDP gaps nor Phillips curves of any form. Instead, since all markets always clear, and all agents are farsighted and rational, all realized levels of GDP are equilibrium levels, representing optimal adjustments to the long-term growth path and the disturbances around it. Theories in these first two classes are all stationary (either in levels or first differences), in which history does not matter.
Theories in the third class my co-authors and I call “evolutionary” to draw a contrast between the unique, self-sustaining equilibrium concepts employed in both the EWD and EA classes and the path-dependent, evolving, historical processes that model the economy as constantly changing. Footnote 16 Because of the path dependency produced by endogenous technological change—new advances build on old advances—a disturbance that affects the immediate path of technological development can have lasting effects in the sense that the economy will never return to the path that it would have taken in the absence of that disturbance: history matters. These changes are continually altering the structure of the economy, causing waves of serially correlated investment expenditure that are a major cause of cycles, as well as driving the long-term growth that continually transforms our economic, social, and political structures. Footnote 17 Because agents operating in the evolutionary context typically make research and development decisions under conditions of genuine uncertainty, there is no objective way to decide in advance which of two alternative actions with respect to invention or innovation is the best one until the results are known. As a result, there is no unique line of behavior that maximizes agents’ expected profits. Footnote 18 Thus, there is no unique equilibrium, either static or dynamic, in the evolutionary world, so no adjustment mechanism is required to maintain it. Instead, the constantly changing economy can exist over a wide range of GDP, employment, and unemployment values, without behaving as it would if its inflation rate were determined by an expectations-augmented Phillips curve or any similar construct centered on unique general equilibrium values of Y and U. Thus, there is no stable, long-run vertical Phillips curve or aggregate supply curve. Although the economy clearly does cycle, there has never been any serious evidence that it cycles around a stable equilibrium GDP, Y*, such that whenever current Y does not equal Y*, pressures will be clearly operating to return the economy to Y*. Footnote 19
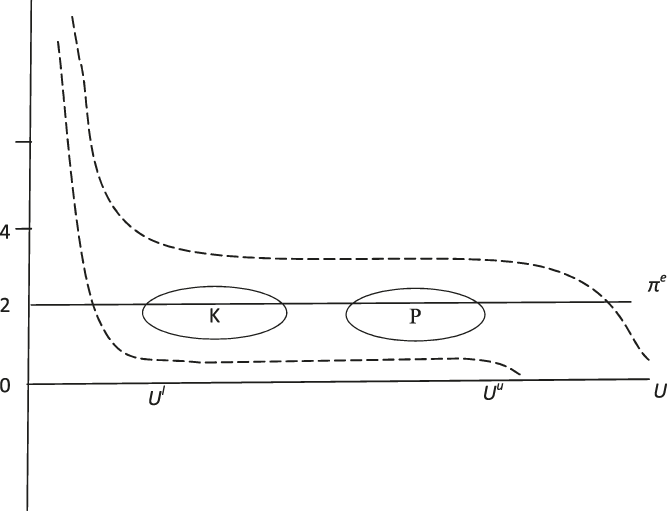
Given the evidence in Figures 1 to 3, which was discussed in the previous section, and the more detailed evidence given in the study by Carlaw and Lipsey (Reference Carlaw and Lipsey2012), I suggest that the explanation of the current behavior of inflation, output, and unemployment in modern industrial economies is provided not by any EWD theory but by evolutionary theories. Instead of the Phillips curve, there is a band, as shown in Figure 4. Its midpoint is at the expected rate of inflation. If the central bank has a credible inflation target that it sticks to, the expected rate will be that target rate, shown as πe in the figure. The actual rate will vary around the expected rate, depending on a number of influences, such as changes in productivity, or the price of oil and food, but not systematically on short-term variations in U or Y. At either end of this band, there may be something closer to a conventional Phillips curve, with prices and wages falling in the face of major depressions and rising in the face of a major booms financed by monetary expansion. Also, the whole band will be shifted up or down by anything that changes the expected rate of inflation.
The Band of Non-accelerating Inflation (NAIBU).
All Unemployment Rates Between U l and U u are NAIRUs.

One way of describing this behavior is to say that the Phillips curve has disappeared. Another way is to say that the perfectly elastic Phillips curve raised on Y* and its associated NAIRU, points on which were consistent with various, fully expected rates of inflation, has been rotated through 90o to become a NAIBU, a non-inflationary band of unemployment (and Y) located at the constant expected inflation rate, points on which are consistent with various levels of Y and U. (This is all short-term analysis in which full-capacity GDP can be regarded as roughly constant so that variations in Y mainly represent variations in the GDP gap.)
The change in policy implied by this change in how the economy is viewed is dramatic. In EWD theories, there is only one level of GDP and unemployment Y* and U* that the natural forces of the economy will sustain over the long run. Given fully rational expectations, no other levels of GDP and unemployment can persist. If expectations are less than fully rational, such as being adaptive or based on less than a perfect understanding of how the economy works, other levels of Y and U can be sustained by policy for some time, but will sooner or later be met by either accelerating inflation (if Y > Y* and U < U*) or deflation (if Y < Y* and U > U*). In contrast, evolutionary theories imply that policymakers have a range of Ys and Us on which they can target. Footnote 20 On the one hand, they could try to minimize unemployment consistent with staying within the NAIBU. They would do this by expanding the economy until inflation threatened to accelerate. On the other hand, they could seek to hold the economy near the high unemployment end of the NAIBU range. They could do this by depressing it until the inflation rate showed signs of falling persistently below the NAIBU’s lower band. Since the economy will cycle whatever the authorities do, these policies would have the effect of making the economy cycle within the area marked K (for Keynesian) in the former case and the area marked P (for Pashian) in the latter case.
So we seem to have gone full circle from the early Keynesian view in which there was no unique level of GDP to which the economy was inevitably drawn, through a simple Phillips curve with its implied trade-off, to an expectations-augmented Phillips curve (or any of its more modern equivalents) with its associated unique level of GDP, and finally back to the early Keynesian view in which policymakers had an option as to the average pressure of aggregate demand at which economic activity could be sustained. However, the modern debate about whether to aim for the K or P area is not a debate about inflation versus growth, as it was in the 1950s, but between those who would risk an occasional rise of inflation above the target band as the price of getting unemployment as low as possible and those who would risk letting unemployment fall below that indicated by the lower boundary of the NAIBU as the price of never risking an acceleration of inflation above the target rate.
Perhaps [then] Keynesians were too hasty in following the New Classical economists in accepting the view that follows from static [and all EWD] models that stable rates of wage and price inflation are poised on the razor’s edge of a unique NAIRU and its accompanying Y*. The alternative does not require a long term Phillips curve trade off, nor does it deny the possibility of accelerating inflations of the kind that have bedeviled many third world countries. It merely states that industrialized economies with low expected inflation rates may be less precisely responsive than current theory assumes because they are subject to many lags and inertias, and are operating in an ever-changing and uncertain world of endogenous technological change, which has no unique long term static equilibrium. If so, the economy may not be similar to the smoothly functioning mechanical world of Newtonian mechanics but rather to the imperfectly evolving world of evolutionary biology. The Phillips relation then changes from being a precise curve to being a band within which various combinations of inflation and unemployment are possible but outside of which inflation tends to accelerate or decelerate. Perhaps then the great [pre-Phillips curve] debates of the 1940s and 1950s that assumed that there was a range within which the economy could be run with varying pressures of demand, and varying amounts of unemployment and inflation[ary pressure], were not as silly as they were made to seem when both Keynesian and New Classical economists accepted the assumption of a perfectly inelastic, one-dimensional, long run Phillips curve located at a unique equilibrium Y* and NAIRU. (Lipsey Reference Lipsey, Blaug and Lloyd2011, p. 389)