Inflation is a smaller political concern in recent years than in the late
1970s and early 1980s, as yearly price changes have fallen from as high as
12% then to less than 3% in recent years. Nevertheless, inflation remains
politically significant for a number of reasons:
[bull ] Low inflation is a goal of economic policy and a measure of its
success;
[bull ] Inflation-adjustment for government benefits affects payments to
Social Security recipients and some others. The Boskin Commission (discussed
below) estimated that by 1983 the Consumer Price Index (CPI) adjustments to
Social Security, using what they believed to be a flawed CPI, resulted in
$8.76 billion benefit overpayment, 5.55% of total benefits (Boskin
Commission Report in Baker 1998, 15);
[bull ] Inflation-adjustment of federal tax brackets and other elements of
the national government income tax affects the amount of national government
revenue and of tax payments. A CPI measure that showed lower inflation than
the current CPI would change tax brackets and other elements much less and
thereby sharply increase federal revenues, with very large cumulative
effects;
[bull ] Cost-of-living adjustments (COLAs) affect the pay of those employees
who have automatic price escalators in their contracts, although in recent
years evidently fewer than 5% of all private-sector employees have such
contracts1
Estimate is from Schultze and
Mackie 2002, 207 (specific estimate: “not
been much more than 3 percent of the labor force,” as contrasted
with at least 15% of the labor force in 1976).
;
[bull ] Even relatively low levels of inflation produce, cumulatively, large
changes over time. For example, an inflation rate of 2.4% per year, the
average during 1998 to 2002, changes price levels about 11% in five years,
21% in 10 years, 38% in 20 years, and 61% in 40 years.
Given the variety of self-interests it is not surprising that measures of
price changes, most importantly the Consumer Price Index (CPI), are
themselves sometimes the object of policy dispute. Because of its political
importance, changes in the CPI are often controversial. That is, the
measurement of inflation is not simply a technical issue; many individuals
and groups have an interest in how inflation is measured.
The potential for conflict is illustrated by the Boskin Commission, named for
its chair, Michael Boskin.2
Concerning the
Boskin Commission and controversies about inflation measures, see
the analysis by Commission member Robert J. Gordon 1999, and also selections in Baker 1998, esp. Baker, “Does the CPI Overstate
Inflation?: An Analysis of the Boskin Commission Report,”
79–155.
The Boskin Commission served from June 1995 to
December 1996, examined the CPI, and considered various changes.
3 The “Boskin Commission Report” formally was
titled Toward a More Accurate Measure of the Cost of Living:
Final Report to the Senate Finance Committee from the Advisory
Commission to Study the Consumer Price Index, December 4,
1996. It is available online at
http://www.ssa.gov/history/reports/boskinrpt.html,
and in Baker 1998, 5–77.
The
Commission concluded that the CPI overstated inflation by an average of 1.1
percentage points each year and suggested major changes in the index.
Not surprisingly, the Commission itself was controversial, partly because its
members were chosen partly in light of an expected outcome. The “Senate
Finance Committee established the commission to determine not whether but
how much the CPI overstated inflation [and] the committee explicitly sought
a finding that the CPI overstated inflation in the hope of facilitating tax
increases and spending cuts.” The Committee chose as members of the
Commission only economists who previously had indicated a personal belief
that “the CPI substantially overstated inflation” (Baker 1998, 81).
Although the Boskin Commission proposals were not fully implemented, the
Bureau of Labor Statistics, the national government agency having primary
responsibility for inflation data, continues to change the CPI.
Inflation Policy and Public Understanding
During the 1970s many argued that government spending, specifically
deficits, were a primary, possibly the major, cause of inflation. Ronald
Reagan as candidate in 1980 said that he would reduce inflation by
balancing the national government budget. The sharp decline in inflation
despite a tripling of the deficit during Ronald Reagan's first term,
however, suggests that inflation is not simply a result of the national
government spending more than it receives in revenues.
Why did inflation fall from 12.4% in 1980 to 3.8% in 1983? Economists
from the Urban Institute examined the fall in inflation during the early
1980s and concluded that a number of factors produced lower inflation
(Stone and Sawhill 1984, 12–20, especially
Table 4, p. 19). They suggested that 1.6 percentage points, 18.6% of the
decline, resulted simply from a new measure of inflation, starting in
1983, in which the cost of homeownership was measured differently in the
CPI than in previous years. In addition, 2.9 percentage points, 33.7% of
the change, resulted from changes in the prices of food and energy, and
in the international value of the dollar. Finally, 4.1 percentage
points, 47.7% of the change, resulted from “economic slack,” that is
high unemployment. Some of these elements can be influenced directly by
policy changes but others are only indirectly, if at all, amenable to
policy action.
The preferred policies one uses to deal with inflation depend at least
partly on one's assumptions about the economy, judgments of causal
relationships among various components, and judgments of the ability,
tools, and resources of government to address inflation. In addition,
ideological orientations—views of what government should do—strongly
influence judgments of appropriate economic policy. All this is further
complicated in the U.S. context by separation of powers, checks and
balances, and the division of economic policy arenas among the
president, Congress, the Federal Reserve, and others.
All parties have self-interests in policies directed toward inflation,
unemployment, and other economic problems. The gainers and losers from
inflation are less clear than those from high unemployment, that is,
recessions. The “main relative gainers from recessions are the upper
quintiles of the distribution, particularly the highest quintile.”4
Hibbs 1987, 81,
and ch. 3. The Phillips curve suggested a tradeoff between
unemployment and inflation, but this appears less clear in
recent years.
The primary gainers from inflation, on
the other hand, are less clear. Despite the usual view that the poor,
those “on fixed incomes,” suffer most from inflation, it appears that
inflation, over time, may slightly benefit those low in the income scale
though the effects are small and not totally clear (Hibbs
1987, Ch. 3, especially p. 77–89).
Reflecting a combination of self-interest and ideology, identifiers with
the two political parties diverge in their orientations toward the
relative importance of inflation and unemployment as policy goals.
Republicans generally emphasize low inflation as a primary goal while
Democrats emphasize low unemployment (Hibbs 1987, Ch. 1–4).
Clarifying Terms: Inflation, the Consumer Price Index (CPI),
and Cost of Living
The U.S. Bureau of Labor Statistics (BLS) has collected systematic data
about prices since 1913, making CPI data available beginning that year.
Economic historians, the BLS, and other organizations and individuals
have estimated price levels for earlier years; Historical Statistics
of the United States, last fully updated in 1975, presents
price level estimates starting 1800. More recently, economic historians
have revised and updated those earlier estimates and have produced price
level estimates starting with 1665 (see McCusker 2001; the data he presents will be used in later editions of
Historical Statistics). Although very large social,
economic, and political changes have occurred since 1665, those
estimates present at least a rough approximation of price levels and
changes during a long period of American history. This paper uses those
data—“re-based” so that 2003 is the base year, that is, equal to 1.000
or 100—to present U.S. historical data about politically relevant topics
that involve dollar figures.
It is important to recognize that the CPI has strengths and limits.
Although the CPI often is referred to as a “cost of living” index, in
reality it more accurately can be described as a “cost of goods” index
because it is based on changes in the prices of a “fixed market basket”
of goods (Schultze and Mackie 2002, Executive
Summary and especially ch. 1). The CPI (usually the CPI-U, for urban
consumers, rather than the narrower CPI-W, for workers, which represents
a smaller part of the U.S. public) is based on a “market-basket” of
goods and services with many components and weightings to approximate
purchasing patterns of U.S. households. The BLS and Census Bureau
regularly sample the prices of the items in the market basket and use
those prices to produce the CPI. The market basket, of course, changes
over time, and a potential weakness of the CPI is that over time the
components and weightings in the market basket diverge increasingly from
actual purchasing patterns until adjustments occur. In addition,
economists have long recognized that quality improvements may not be
reflected directly in prices and so in the CPI, as illustrated by
falling prices but rising quality for computers.
For these and a variety of other reasons, the CPI is changed
periodically, with small revisions occurring periodically. The most
recent major revision occurred starting in 1983, when a new measure of
housing costs was introduced. Economists had long thought that the
former CPI exaggerated the effect of changes in housing prices, so the
post-1982 measure corrects for that. (As noted earlier, Urban Institute
economists have estimated that 18.6% of the total reduction in inflation
from 1980 to 1983 was due to this change in the CPI measure.) To provide
historical continuity, the BLS and Census Bureau also calculated what
price levels from 1950 to 1982 would have been using the new measure;
that series is called CPI-U-X1. The BLS, the Census Bureau, and several
other government agencies have developed various experimental measures
of inflation.5
Much confusion accompanies measures of inflation on the part of officials
and especially among the public. Because the inflation “market basket”
attempts to reflect an average market basket of purchases, to some
degree it does reflect cost of living. However it does not directly
measure “standard of living,” which reflects changes in income and other
measures of resources relative to changes in price levels.
One effect of this distinction is that low inflation is not necessarily
associated with increases in standard of living. For example, if prices
rise an average of 10% but wages rise an average of 12%, a net increase
in average purchasing power occurs. If inflation falls to, say, 4%, but
wage increases fall even more, say to 2%, a net decrease in purchasing
power occurs.
An important set of limits in relation to inflation measures is that both
price changes and income data are averages, and there is much variation
in both. The various elements of the “market basket” on which the CPI is
calculated often rise at different rates.6
The BLS and other government agencies provide a variety of
inflation measures to reflect this, especially “core inflation,”
that is, price changes excluding food and energy. In addition,
the BLS price reports include the data for the various
components of the CPI and not simply for overall
inflation.
Because the CPI represents an average, probably
no specific individual's personal “market basket” exactly matches that
of the CPI. As a result, those who purchase items whose prices rise less
than overall price changes may experience a different effect on standard
of living than implied by CPI changes. Similarly, there is large
variation in income changes, so that some individuals experience income
changes that offset price-level changes while others do not.
It also is important to recognize that living standards are affected not
only by price changes but also by improvements in quality and other
changes in various components of items purchased and by emergence of new
items that improve standard of living. CPI, as noted, is changed
periodically to reflect new items, improvements in quality, and so on,
but the changes might not perfectly reflect the product changes and
involve a lag in reflecting items in the CPI.
Probably a better measure of changes in standard of living is to
denominate items purchased not only in inflation-adjusted dollars but
also in terms of “work-hours,” “work-days,” or similar. For example, the
income from the work of how many minutes, hours, or days was needed to
purchase such items as specific types of food, or an automobile, or a
long-distance telephone call in, say, 1950 and 2000?7
For an example, see Federal Reserve Bank of Dallas,
Time Well Spent: The Declining Real Cost of Living in
America.
Even this, of course, does not
reflect changes in preferences over time, the emergence of new products
(say, cell phones or VCRs), or the fact that new inventions available
only to the wealthy (e.g., the automobile, the PC) eventually become
necessities.
Data limits and public views affect the ability to examine many potential
comparisons over time. Price data for particular items are spotty over
long time periods, and particularly there are limits on earnings data
prior to the 1940s. However, some economists have examined family budget
and similar data over long periods of time and economic historians have
developed estimates of the pay of various parts of the workforce.8
See, for example, the Bureau of Labor
Statistics report A Century of Family Budgets in the United
States 1996.
Still, public views of inflation
may be confused not only by incomplete understanding of inflation
measures but also by daily experience. For example, the prices of some
relatively small items that are purchased regularly tend to rise in
increments that may be relatively steep, for example, the rise in price
for pay phones calls from 25 to 35 to 50 cents over a short time period.
These increases may lead to public judgments of inflation that differ
sharply from the official measures of price changes.
9 Two especially interesting analyses are Clair Brown,
American Standards of Living 1918–1988 (Cambridge,
MA: Blackwell, 1994), which examines standards of living in
1918, 1935, 1950, 1973, and 1988, and Stanley Lebergott,
Pursuing Happiness: American Consumers in the Twentieth
Century(Princeton: Princeton University Press, 1993),
especially the appendices about major trends 1900 to 1990 in
food, clothing, housing, lighting, recreation, and various other
consumption and living-standard categories. Concerning pay of
various parts of the workforce see, for example, Robert Margo,
Wages and Labor Markets in the United States,
1820–1860 (Chicago: University of Chicago Press, 2000),
and various contributions in Stanley Engerman and Robert
Gallman, eds., Cambridge Economic History of the United
States (three volumes; Cambridge: Cambridge University
Press, 2000). A convenient source of selected long-term data on
prices and incomes is the Economic History Net web site, at
http://www.eh.net/databases/.
Using Inflation Measures to Examine Politically Relevant
Topics
Many elements of political history involve dollar figures over time, yet
news accounts and even scholarly analyses often do not take into account
the effects of changes in price levels. Because inflation adjustment may
reveal trends that are not evident using “current” (that is,
non-inflation-adjusted) dollars, this paper shows historical trends of
selected politically relevant topics taking into account changes in
price levels, that is, inflation or deflation.
The web site http://www.orst.edu/
Dept/pol_sci/fac/sahr/sahr.htm includes the data presented
here and many other examples. It also provides links to other sources of
information about inflation and related topics and provides tables of
“conversion factors” which can be used to convert dollars of any year
from 1665 to dollars of recent years. Inflation estimates for this year
are used to produce conversion factors to dollars of this year, but
because these are only estimates this paper uses 2003 conversion factors
based on final 2003 CPI.
The data used to produce the conversion factors were collected by many
organizations using various methods, some of which have changed over
time. Generally, estimates for the distant past—for example, spending in
the 1860 presidential election campaign, or price levels in the late
1600s—are less complete and accurate than for more recent time
periods.
The following graphs show data in constant (inflation-adjusted,
or real) dollars. Some graphs also present data in current
dollars (that is, non-inflation-adjusted).
What follows, then, must be read with the recognition that seemingly
precise measures have numerous limits, so changes must not be taken too
literally. Nevertheless, examining politically relevant data over time
using inflation-adjusted dollars often shows striking, and sometimes
surprising, patterns.
The Size of the US Economy through U.S. History, Overall Price
Levels, and Price Level Changes (Inflation or Deflation)
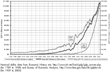
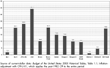
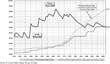
Graph A shows the size of the American economy
(Gross Domestic Product, GDP) for the period 1789 to 2003 in billions of
inflation-adjusted (2003) dollars. (The current-dollar data are from
Economic History Net, at
http://www.eh.net/hmit/gdp/gdp_answer.php.) It also shows
GDP per capita in inflation-adjusted dollars. (Reliable GDP data are
available starting 1930; economic historians have estimated GDP for
earlier years.)
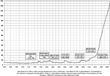
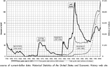
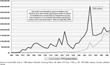
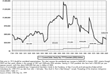
Graph B shows price levels and estimates for
the period 1665 to 2014. (Estimates for 2004 to 2009 are averages of
estimates by the Office of Management and Budget and the Congressional
Budget Office; after 2009, only CBO.) As the graph shows, the U.S. price
level in 1945 was essentially the same as price levels at several
earlier peaks: the War of 1812, the Civil War, and the early 1920s. The
graph also shows that price level changes involve both increases
(inflation) and decreases (deflation). Deflation has not occurred since
the 1930s in the United States, though it has occurred in Japan and some
fear its reemergence in the U.S.
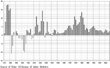
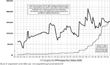
Graph C shows price level changes (inflation or
deflation) year-by-year for the period 1915 to 2003. The chart shows the
deflation associated with the Great Depression and the high inflation
associated with wars and during much of the period beginning in the late
1960s.
Levels of National Government Spending and the National
Debt
Examining national government budget trends using dollars adjusted for
inflation often shows counter-intuitive results. That is, national
government spending and the national debt adjusted for inflation show
quite different trends than when presented in “current” dollars.
Similarly, spending changes during presidential terms also show quite
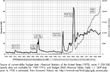
sharp differences when price level changes are accounted for. Graph D shows national government outlays
(spending in a particular fiscal year) from 1792 to estimated 2004, in
inflation-adjusted (2003) dollars. (Yearly data are not available for
1789–1791.) It also shows national government spending relative to the
size of the economy (GDP; reliable data of which began in 1930).
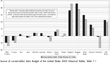
Graph E shows change in inflation-adjusted
national government spending (outlays) by presidential term, from 1952
to estimated 2004 calculated from current-dollar data in Bush
administration budget documents for fiscal year 2005, in early 2004.
(This graph uses CPI-U-X1, which applies the same CPI measure to the
entire period starting from 1950. All graphs here that involve only the
period starting from 1950 use the CPI-U-X1.)
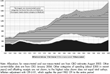
Graph F shows U.S. national debt (accumulated
deficits) from 1792 to estimated 2004 in three ways: current dollars,
constant (2003) dollars, and as percent of GDP. Graph
G shows changes in inflation-adjusted national debt by
presidential term for Presidents Truman to estimated George W. Bush. As
noted on that graph, the broader measure “gross debt” generally is
considered less important economically than “debt held by the public,”
which excludes debt held by the Social Security trust funds and similar
national government units. (For comparability over the entire time
period, Graph F shows total or gross national
debt rather than separately showing debt owned by the public.)
The Composition of National Government Spending
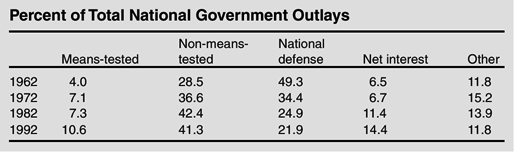
The composition of the national government budget has changed sharply
during the second half of the twentieth century. The table shows that as
percent of total outlays the share for both means-tested and
non-means-tested programs has increased and the share for national
defense spending has decreased.
The table shows four major categories of national government
spending—defense, net interest, means-tested social spending, and
non-means-tested social spending—and a residual “other” category for the
period starting 1962. (The 1962 budget year is the first for which
consistent data for these spending categories, from the Congressional
Budget Office, are available.) The largest nonmeanstested programs are
Social Security and Medicare. The largest meanstested program is
Medicaid. Graph H shows outlays in constant
(2003) dollars for each of those categories for the period 1962 to
estimated 2004.
Graph I enlarges on long-term trends for the
largest federal-funds item of the national government budget, national
defense. Although defense has fallen during recent decades as percent of
outlays and of the economy, from the 1950s through the 1970s it stayed
within the relatively narrow band of $250 to $300 billion in dollars of
2003, except for increases during the Vietnam War. Since the buildup in
defense spending under President Reagan, defense spending fell to a low
point of slightly below $300 billion before rising during the late
Clinton presidency and increasing even more during the George W. Bush
presidency.
Although national defense spending has fallen as percent of total
national government spending, it has remained in recent years at about
half of total national government discretionary spending, the part
“controllable” by Congress and the president through the appropriations
process. At the same time defense spending fell as percent of total
spending, discretionary spending share of total spending also fell
sharply, from 67.5% in 1962 to 43.7% in 1982, and to 36.5% in 2002.
A major reason defense spending has such large impact on presidential and
congressional budgetary decisions is that it is by far the largest
single category of discretionary spending. In budget year 2002 defense
was 47.5% of discretionary spending; it is a larger share more recently
and in the near future. Defense is not only a very large share of
discretionary spending but it vastly dwarfs all the other discretionary
spending items. Defense was $348.9 billion in budget year 2002 and the
second largest discretionary category, education, was a very distant
second, about one-eighth as large, at $43.3 billion or 5.9% of
discretionary spending. Because defense spending is increasing and other
growth in other discretionary spending is slowing (or in some instances
decreasing in real dollars), defense spending soon will rise to more
than half of discretionary spending.
Governor and presidential candidate George W. Bush in 2000 stated that
when examining changes in state, and presumably national, government
spending, both inflation and population change should be taken into
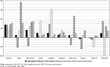
account. Graph J shows change in
inflation-adjusted outlays per-person by presidential term for overall
spending and for each of the earlier categories, from President Johnson
through President George W. Bush. This graph shows change, using Census
Bureau population data, to control not only for price changes but also
population changes.
Graph J challenges a number of elements of
“conventional wisdom” (CW) about spending by Republican and Democratic
presidents, for example that Democratic presidents increase and
Republican presidents decrease social spending and that Republican
presidents increase and Democratic presidents decrease defense spending.
That graph instead emphasizes that changes in domestic spending are
related to policy changes somewhat independent of presidential party.
For example, large increases in social spending occurred under
Republican President Nixon as Social Security and other policies were
changed. Similarly, defense spending levels are related more to
historical circumstances—the beginning and ending of wars, for
example—and less to the party of the president. For example, until the
current Bush presidency, the only Republican president since Dwight
Eisenhower to increase defense spending was Ronald Reagan. Increases
during his terms may have been the most important factor in establishing
the CW about presidential parties and defense spending.
Social insurance programs in the United States are much more widely
supported than public assistance programs. This difference is reflected
in changes in inflation-adjusted benefit levels for programs in each
category. Prior to 1974, Social Security benefit levels were changed by
congressional and presidential action, often resulting in large
increases in “even numbered” (election) years. Legislation in 1974
produced automatic adjustment of Social Security benefits starting in
1976. Welfare programs, on the other hand, are not adjusted
automatically to offset price level changes. Notice that in 1970 the
benefit levels of the two programs were relatively close but since that
time there has been large divergence. Graph K
shows inflation-adjusted benefit levels for Social Security and
“welfare” (first AFDC, later TANF) for the period starting 1936 (data
are not available for both series for all years). The dollar values of
each are indicated for 1970 and 2000 to illustrate divergent trends in
benefit levels.
Similarly, the minimum wage has been a subject of political conflict
since its establishment in 1938. During long periods it has fallen in
inflation-adjusted dollars. Graph L shows
inflation-adjusted minimum wage for each year from its origination in
1938, indicating its peak in the late 1960s and its decline during long
periods. The graph also shows what its current-dollar value would have
had to be in various years to equal the peak level (1968) in
inflation-adjusted value.
Campaign Spending and Campaign Contribution Limits
Surprising trends appear when examining campaign spending. The quality
and completeness of data, especially for the earlier periods, almost
certainly vary. So, as with some of the other data presented here, the
underlying data almost certainly are not complete or precisely
comparable for the entire period. Graph M
shows spending for presidential general election campaigns from 1860 to
2000.
Contribution limits have been a central element of recent campaign
finance issues. The following two graphs show the limits established in
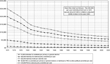
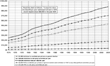
1974 in two ways: First, Graph N shows the
value in dollars of 2003 of the 1974 spending limits for each year
starting 1974. Second, Graph O shows what the
1974 contribution limits would have had to be each year to maintain the
same purchasing power as 1974. These data provide ammunition for those
who argue that, at the least, campaign contribution limits should be
increased given their sharp decrease in purchasing power since the
1970s.10
Data for presidential
general election costs are drawn from the following sources:
pre-1992: Alexander 1992, Table 5–1,
p. 80, including party contributions 1976–1988; 1992: Alexander and Corrado 1995, ch. 5, pp. 115 (including soft
money) and 136; 1996: Corrado 1999,
Table 4.1, p. 75; and 2000: Corrado 2002, Table 4.1, p. 89 and personal communication.
See also Ansolabehere, de Figueiredo, and Snyder 2003, esp. pp. 119–121.
Most people appear to believe that the pay of government officials always
increases. Yet for both presidents and members of Congress, pay in
recent years is less, adjusted for inflation, than in many earlier
years. For example, Graph P shows presidential
pay from George Washington to President 2004. As that indicates,
President Clinton's $200,000 yearly pay made him, in inflation-adjusted
dollars, the lowest paid president in American history, with an average
in 2003 dollars of $230,000 during his two terms. When yearly
presidential pay had been increased from $100,000 to $200,000 in 1969,
that equaled about $3005,000 2003 dollars; it had fallen to about
$214,000 2003 dollars in Clinton's last year, before rising to $400,000
($415,000 2003 dollars) with the inauguration of the new president.
William Howard Taft's $75,000 per year, the equivalent of about
$1,400,000 2003 dollars, made him by far the highest paid. And the pay
of members of Congress, $158,100 in 2004, reached a peak, adjusted for
inflation, in 1969, at about $214,000 in dollars of 2003, as Graph Q shows.
The pay of both presidents and members of Congress have declined sharply
since 1960 relative to the pay of corporate officials. In 1960, the pay
of top-500 CEOs, using Business Week data, was 1.9 times that
of the president and 8.5 times that of members of Congress; in 1970 the
ratios were 2.7 and 24.4, respectively, in 1980, 3.1 and 14.7
respectively, and in 1992 17.5 and 27.0,
respectively. During the 1990s the ratios zoomed upward, to 28.9 and
43.3 in 1996 and to 65.5 and 92.7 in 2000, before declining the past two
years.
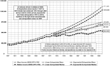
In addition, trends in family income in inflation-adjusted dollars
suggest that if 1947 to 1973 average growth in inflation-adjusted family
income had continued after that time, the median family income in 2001
would have been about $110,000 (assuming exponential growth best fit),
nearly twice as high as the actual median (linear growth would have
produced a median of 70–75,000), as Graph R
shows. That faster rising family income during the post-1973 period
would have had very large political effects.
Trends in many other politically relevant topics show surprising results
when examined using inflation-adjusted dollars. (All those shown here,
and many others, are shown on the web site indicated earlier.)
All these data, using inflation-adjusted dollars, help illuminate trends
in American politics that are less clear if non-inflation-adjusted
dollars are used. Many of these also challenge “conventional wisdom”
about such topics as presidents, the size of government, and other
elements. And, at the least, they emphasize the importance for careful
political analysis of adjusting dollar figures over time for the effects
of price changes.