Introduction
Nutritional circumstances from childhood could manifest themselves later on in the form of morbidity or mortality. It is important to study the impacts that these early childhood conditions could have on adult health and well-being. However, such life course transitions cannot be analysed properly without longitudinal data, preferably starting from birth and continuing on through adult years. Much of the existing research analysing anthropometrics over the life course has been conducted using longitudinal studies in higher-income countries (Braddon et al., Reference Braddon, Rodgers, Wadsworth and Davies1986; Power et al., Reference Power, Lake and Cole1997; Van Abeleen et al., Reference van Abeelen, Elias, Roseboom, Bossuyt, van der Schouw, Grobbee and Uiterwaal2012), with very little having been done in contexts where studies are arguably most needed. Although birth cohort studies have been conducted in less-developed contexts, they often did not cover a long enough period for the participants to reach adult ages. The few papers that have used such cohort studies have results that are somewhat inconclusive and in need of further research.
Guatemala, a less-developed country, was an appropriate country for this investigation due to the anthropometric status of its constituents. Despite gradual improvements in levels of undernutrition over recent decades, the prevalence of stunting in children under 5 years of age was 46.5% in 2014–2015. To put this into perspective, the value is considered to be very high by the standards of public health significance as set by the World Health Organization (FANTA, 2017). Meanwhile, at the other end of the nutritional spectrum, more than 50% of Guatemalan women were reported to be overweight in 2016, and more than 20% were obese (WHO, 2016a).
While this might seem contradictory, human biology could explain why undernutrition as a child might in fact place a person at higher risk of becoming overweight as an adult. The Fetal Origins Hypothesis states that if a child lacks nutrients, either in utero through the mother’s body or in early postnatal care, the child’s natural biological reaction is to conserve energy. With this survival mechanism in place, such a child then develops ‘a thrifty phenotype in which the metabolic and endocrine control systems are tuned to expect a meager substrate supply and are ill-adapted for later nutritional excess’ (Adair & Prentice Reference Adair and Prentice2004). As a result, any improvement in nutrition later in life could actually be detrimental in the long run, as it could result in excess accumulation of energy and body fat (Barker, Reference Barker2004; Caballero, Reference Caballero2005). Caballero (Reference Caballero2005) stated: ‘Because intrauterine growth retardation and low birth weight are common in developing countries, this mechanism may result in the establishment of a population in which many adults are particularly susceptible to becoming obese.’ While this refers specifically to fetal growth, the concept also extends to early-life environments (Barker, Reference Barker2004).
The Young Lives cohort study found that early-life stunting of Peruvian children was not associated with increased body mass index (BMI) when they became older, though the children were only around 12 years of age at the end of this study (Andersen et al., Reference Andersen, Stein, Reynolds, Behrman, Crookston and Dearden2016). Another study used the Consortium of Health-Orientated Research in Transitioning Societies (COHORTS), which consisted of birth cohorts from five low- and middle-income countries. This study showed that adult BMI appeared to be strongly and positively associated with weight indices in childhood. This finding seems to contradict the Fetal Origins Hypothesis and the above-mentioned result. However, body mass consists of both lean and fat masses, and since these masses result from distinct biological processes, the implications of having high BMI might be different depending on the kind of body mass (Victora et al., Reference Victora, Adair, Fall, Hallal, Martorell, Richter and Sachdev2008).
The potential implications of early-life nutritional experiences could be more far reaching than just anthropometric status. Undernutrition is commonly linked with infectious diseases, and overnutrition with chronic diseases (Belahsen, Reference Belahsen2014). Yet even if under-nourished individuals survive their childhood years, they might still have a higher risk of chronic diseases as adults (Barker, Reference Barker1997; Roseboom, Reference Roseboom2012; Shrimpton & Rokx, Reference Shrimpton and Rokx2012). However, was this because under-nourished children transition into over-nourishment as an adult? Or was overnutrition in the middle of the pathway a sufficient, but not necessary, condition?
Due to irreversible changes through programming of organs and biological systems earlier in life, those who face poor nutritional circumstances early in life could be at a higher propensity of not only obesity, but also chronic conditions later in life (Barker, Reference Barker1997). Permanent alterations to the programming of the body that can result from early undernutrition include ‘change[s] in the distribution of cell types, hormonal feedback, metabolic activity, and organ structure’ (Barker Reference Barker1997). A previous study conducted on Finnish data demonstrated that lower birth weight was associated with a higher risk of coronary heart disease and that rapid weight gain during childhood increased such risk for those who were thin at birth, as measured by the ponderal index (Eriksson et al., Reference Eriksson, Forsén, Tuomilehto, Osmond and Barker2001). Many chronic conditions have been discussed in relation to the Fetal Origins Hypothesis, including diabetes, hypertension and cardiovascular diseases (Delisle, Reference Delisle2002).
Weight gain in childhood, in addition to under-nourishment, has been implicated in chronic disease risk. In the COHORTS countries, rapid weight gain after infancy for under-nourished children was shown to be linked with various adult outcomes, though the authors stressed that policies should be designed to take into account the age range in which that gain had occurred as well as the chronic disease indicators of interest (Victora et al., Reference Victora, Adair, Fall, Hallal, Martorell, Richter and Sachdev2008). This is not surprising, since complicated biological mechanisms that vary by early size, age of exposure to weight gain and impacted organs are at play (Calkins & Devaskar, Reference Calkins and Devaskar2011).
With rich Guatemalan longitudinal data, transitions between undernutrition and overnutrition over the life cycle were studied in this paper. Additionally, which characteristics were associated with adult BMI? Childhood nutritional status and growth were considered, alongside other adulthood characteristics. This study then explored the relationships of various chronic disease indicators, used as proxies for chronic disease risk, with childhood size and growth trajectories at various childhood age intervals in a Guatemalan birth cohort, with an eye to understanding potential associations and policy implications.
Methods
Study sample
The COHORTS study is a collaboration of five birth cohort studies spanning a large geographical area including Brazil, Guatemala, India, the Philippines and South Africa (Richter et al., Reference Richter, Victora, Hallal, Adair, Bhargava and Fall2012). The present study used data from the Institute of Nutrition of Central America and Panama (INCAP) Nutrition Trial Cohort study for Guatemala, which was part of the COHORTS study. This has one of the longest time spans of the five studies – an important consideration in a study of nutritional outcomes during childhood and their association with chronic diseases at older ages.
The study cohort consisted of children under 7 years of age in 1969 and children born between then and 1977 in four Guatemalan villages (Stein et al., Reference Stein, Melgar, Hoddinott and Martorell2008). The original size of the birth cohort was 2392, though the sample size in subsequent waves decreased for various reasons, including death, migration, and the inability to trace respondents; in the 2002–2004 follow-up 1570 individuals were available for data collection. Their characteristics could be found in a paper by Stein et al. profiling these cohort members (Stein et al., Reference Stein, Melgar, Hoddinott and Martorell2008). Many analyses had been conducted using these data (Maluccio et al., Reference Maluccio, Hoddinott, Behrman, Martorell, Quisumbing and Stein2009; Hoddinott et al., Reference Hoddinott, Behrman, Maluccio, Melgar, Quisumbing and Ramirez-Zea2013; Ford et al., Reference Ford, Martorell, Mehta, Ramirez-Zea and Stein2016), though usually not with an end goal of studying chronic diseases.
Anthropometric measurements
In the INCAP Nutrition Trial Cohort study, recumbent length and weight were measured at several age points throughout childhood. From these data, length-for-age, weight-for-age and weight-for-length z-scores were calculated at all available age points up to the age of 5 years using WHO software (WHO, 2011). The present study was based on length-for-age z-scores, although analyses were also run using weight-for-age and weight-for-length z-scores to test whether results were sensitive to the choice of anthropometric measure. However, there were often missing data and there was a lack of consistency as to which age points contained information. To take advantage as much as possible of the available information, z-score means over age intervals were used to ascertain nutritional status, and slopes of the best-fitting lines among the z-scores were used to measure growth trajectory. For nutritional status at adulthood, BMI calculated from height and weight measurements in the year 2004 was used, though height and weight from 1998 were also used for sensitivity checks.
How were age intervals selected? In the first year of a child’s life measurements had been taken once a month. In the second and third years measurements had been taken once every 3 months. In the fourth and fifth years measurements had been taken once every 6 months. Between ages 0 and 5 years the data were split into three segments according to the frequency of measurement: between ages 0 and under 1, denoted as [0, 1), between ages 1 and under 3, denoted as [1, 3) and between ages 3 and 5, denoted as [3, 5]. Doing so in the regression studies allowed for investigation of how various dependent variables were associated with nutritional status and growth at different ages.
The changes in z-scores per month (referred to here as ‘slopes’) were classified into ‘downward’, ‘stagnant’ or ‘upward’. In most cases, there were no significant differences between models with continuous slopes versus models with categorical slopes (as determined by Vuong’s closeness test). From boxplots, it appeared that the outliers were usually below 0.1 and above 0.1. If different growth patterns might lead to different consequences, it would be important to distinguish such outliers. Therefore, decreases in slope of more than 0.1 and increases in slope of more than 0.1 were used as the ‘downward’ and ‘upward’ categories, respectively, though different thresholds were also tested.
Analysis
Ordinary least squares regressions were run with two sets of models. The general forms of these models are shown in equations (1) and (2). The first looked at how these childhood anthropometrics and growth trajectories, as well as other characteristics, were associated with adult BMI in 2004. It should be noted that adult BMI was not measured for pregnant women or women less than 6 months postpartum (Stein et al., Reference Stein, Melgar, Hoddinott and Martorell2008). The second looked at how all of these same variables, along with adult BMI, were associated with various chronic disease indicators, namely blood pressure (systolic and diastolic), cholesterol (high-density lipoprotein [HDL] and low-density lipoprotein [LDL]), triglycerides and fasting blood glucose. These data, measured using fasting samples in 2004, served as proxies for the propensity to become afflicted by a range of chronic diseases. High levels of blood pressure and cholesterol (except HDL, or ‘good cholesterol’, which has the opposite relationship) are usually considered to be associated with an increased risk of heart disease and stroke (NIH, 2005, 2015). High levels of fasting blood glucose have been linked with type two diabetes (NIH, 2012).
 $$\eqalignno{ & {\rm Adult \ BMI}{\equals}{\rm \alpha }_{0} {\plus}{\rm \alpha }_{1} {\asterisk}{\rm sex}{\plus}{\rm \alpha }_{2} {\asterisk}{\rm mean }\ 0 \ {\rm to \; under} \ 1{\plus}{\rm \alpha }_{3} {\asterisk}{\rm mean } \ 1 \ {\rm to \ under }\ 3 \cr & {\plus} {\rm \alpha }_{4} {\asterisk}{\rm mean }\ 3\ {\rm to } \ 5{\plus}{\rm \alpha }_{5} {\asterisk}s{\rm lope }\ 0\ {\rm to \ under} \ 1{\plus}{\rm \alpha }_{6} {\asterisk}{\rm slope \ }1 \ {\rm to \ under } \ 3 \ \cr & {\plus} {\rm \alpha }_{7} {\asterisk}{\rm slope } \ 3 \ {\rm to } \ 5{\plus}{\rm \alpha }_{8} {\asterisk}{\rm educational \ attainment}{\plus}{\rm \alpha }_{9} {\asterisk}{\rm socio \hskip-3pt \ economic \ status} \cr & {\plus} {\rm \alpha }_{{10}} {\rm {\asterisk}place \ of \ residence}{\plus}{\rm \alpha }_{{11}} {\asterisk}{\rm ever \ smoked}{\plus}{\rm error} $$
 $$\hskip -7pt\eqalignno{ &{\rm Chronic \ disease \ indicator}{\equals}\beta _{0} {\plus}\beta _{1} {\rm {\asterisk}sex}{\plus}\beta _{2} {\rm {\asterisk}}{\rm mean }\ 0 \ {\rm to \;under } \ 1 \ \cr &{\plus}\beta _{3} {\rm {\asterisk}mean } \ 1 \ {\rm to\ under } \ 3 {\plus} \beta _{4} {\asterisk}{\rm mean }\ 3\ {\rm to } \ 5{\plus}\beta _{5} {\asterisk}{\rm slope } \ 0 \ {\rm to \ under } \ 1 \cr &{\plus}\beta _{6} {\asterisk}{\rm slope } \ 1 \ {\rm to \ under } \ 3 {\plus} \beta _{7} {\asterisk}{\rm slope } \ 3 \ {\rm to } \ 5{\plus}\beta _{8} {\asterisk}\rm e{\rm ducational \ attainment}\cr & {\plus}\beta _{9} {\asterisk}{\rm socioeconomic \ status} {\plus} \beta _{{10}} {\asterisk}{\rm place \ of \ residence}{\plus}\beta _{{11}} {\asterisk}{\rm ever \ smoked}\cr & {\plus}\beta _{{12}} {\asterisk}{\rm adult \ BMI}{\plus}{\rm error} $$
In these regression models, the independent variables sex (reference group ‘male’), slope (reference group ‘downward trajectory’), place of residence (reference group ‘rural’) and smoking status (reference group ‘never smoked’) were categorical. All the other variables were continuous. Educational attainment was in grades completed, socioeconomic status was a combination of a wealth index and durable goods/household characteristics, blood pressure was in mmHg and the other chronic disease indicators were in mg/dl. It should be noted that while age was significant as a covariate for adult BMI, it was not significant as a covariate for chronic disease indicators; in fact, the adjusted R 2 values usually decreased with the addition of age. This might be because most of these observations were in the same birth cohort and there was not enough variation in age. As a result, age was not included.
The two sets of regressions above, while certainly useful, did not consider certain indirect effects on the chronic disease indicators. While sex, childhood anthropometrics, childhood growth, adulthood characteristics and adult BMI were included as independent variables in equation (2), the first four were also embedded in adult BMI. As a result, if adult BMI was indeed significant for chronic disease indicators, part of the association might be the direct effect of BMI, and part of it the indirect effect of sex, childhood anthropometrics, childhood growth and adulthood characteristics working through BMI. Structural equation modelling (SEM) was used to parse out the direct and indirect effects of each variable. Specifically of interest here were the direct and indirect effects of the childhood z-scores and growth.
All analyses were run using the statistical software R (version 3.3.2) (R Core Team, 2017). The R package lavaan was used for SEM (Rosseel, Reference Rosseel2012). Models were run after list-wise deletion for missing data. When discussing results, the term ‘significant’ means significant at the level of p<0.05.
Results
Distribution of nutritional states and transitions
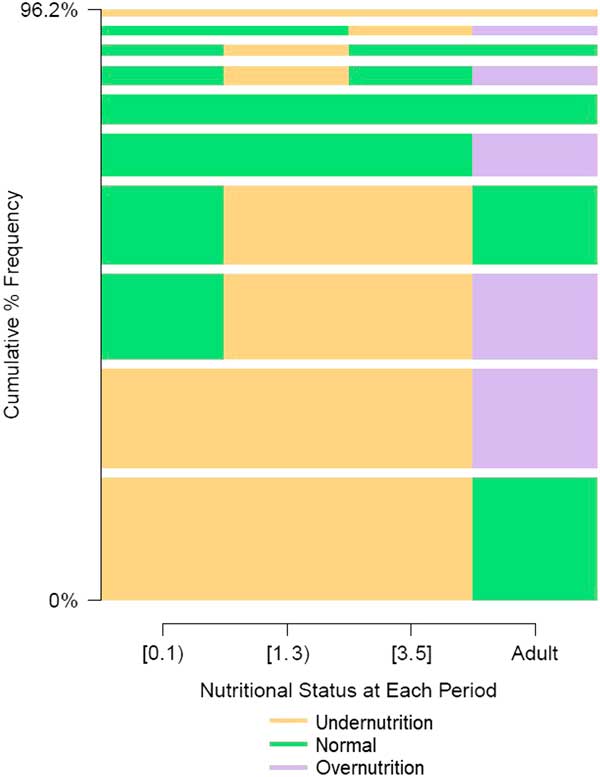
First, the distribution of nutritional states at childhood and adulthood, and the transitions in these made by individuals, were determined. Figure 1 depicts the most common transitions of the study participants using data for all three childhood periods and adulthood. The childhood categories were determined using mean length-for-age z-score, with child undernutrition defined as having a length-for-age z-score of under –2, overnutrition as having a z-score of over 2 and the normal range being in between (WHO, 2016b). The adulthood categories were determined using BMI in the year 2004, with adult undernutrition defined as having a BMI under 18.5 kg/m2, overnutrition as having a BMI of 25 kg/m2 or above and the normal range being in between (WHO, 2006). By 2004, the study participants were between 25 and 42 years of age.
Frequencies of nutritional status sequences from birth to adulthood.

In Figure 1 the colours in the horizontal bars represent different sequences that a person could take from childhood to adulthood. The height of each horizontal bar is the relative frequency of children with such a sequence. For example, the lowest horizontal bar shows that almost 20% of children were under-nourished in the age interval [0, 1) (0 to under 1 year), under-nourished in the age interval [1, 3) (1 to under 3 years), under-nourished in the age interval [3, 5] (3 to 5 years) and normal as adults. It should be noted that the width of the rectangles does not represent a scale of duration. The ten sequences depict the pathways of 96.2% of the study participants. In none of these sequences does over-nourished appear in any of the childhood age intervals. In fact, none of the study participants was considered over-nourished as a child based on length-for-age z-scores. The most common sequence is being under-nourished throughout childhood and then transitioning to normal weight as adults, followed by being under-nourished throughout childhood and then transitioning to over-nourished. These sequences show that upward trajectories in nutritional status were common in this Guatemalan birth cohort, though much of the growth occurred after the age of 5 years.
Adult BMI
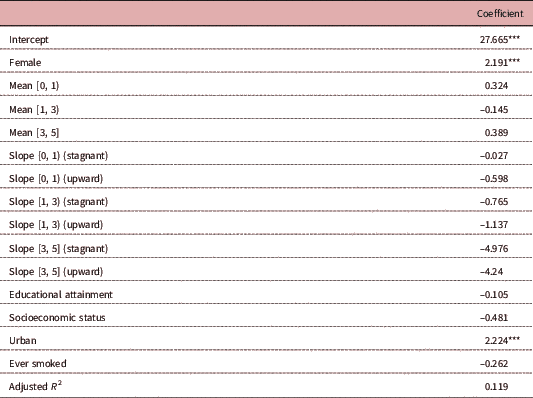
Table 1 shows which childhood length-for-age z-score means and slopes, and adult characteristics, were significantly associated with adult BMI as measured in the year 2004. The numbers in the table are coefficient estimates. In this regression, with length-for-age as the anthropometric measure, females and urban dwellers had a significantly higher average adult BMI than males and rural dwellers. Means and slopes did not appear to be significant; this would suggest that childhood nutritional status and growth trajectory using length-for-age as the anthropometric measure were not very influential for adult BMI.
Regression of adult BMI as measured in 2004 on sex, length-for-age childhood anthropometrics and growth trajectories, and adulthood characteristics

The reference group is ‘male’ for sex, ‘downward trajectory’ for slope, ‘rural’ for place of residence and ‘never smoked’ for smoking status.
Between ages 0 and under 1 is denoted as [0, 1), between ages 1 and under 3 as [1, 3) and between ages 3 and 5 as [3, 5].
*p<0.05; **p<0.01; ***p<0.001.
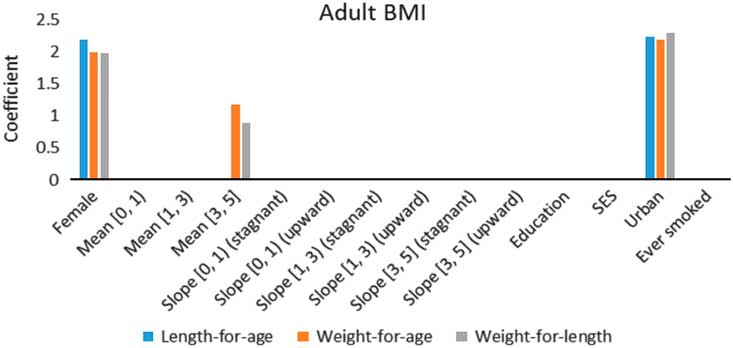
The significance was similar for models based on weight-for-age and length-for-weight z-scores. Figure 2 displays the significant variables and their coefficient estimates in the same model using length-for-age, weight-for-age and weight-for-length measures. There is one caveat: although the vertical bars for the same independent variable give a visual representation of the magnitudes of the coefficient estimates across the three measures, the vertical bars of different independent variables are not comparable, because different independent variables have different scales of measurement. The significant variables had the same directions and similar coefficient magnitudes across measures. For weight-for-age and weight-for-length, the z-score mean in [3, 5] was positively associated with adult BMI. That is, nutritional status at a young age (though not too young) was significant for nutritional status as an adult. If the three age-segment weight-for-age (respectively weight-for-length) z-score means were replaced with the overall weight-for-age (respectively weight-for-length) z-score mean, the z-score mean was significant, indicating that significance was driven by childhood anthropometrics between the ages of 3 and 5 years. ‘Slope’ was not at all significant, suggesting that there was no evidence pointing to an association between childhood growth trajectories and adult BMI.
Significant variables for adult BMI by anthropometric measure.
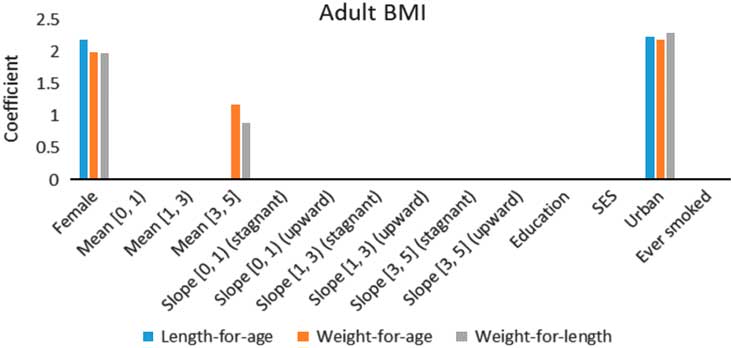
In all of these models, sex and place of residence were consistently significant. However, adulthood characteristics such as educational attainment, socioeconomic status and having ever smoked (current or former smoker) were never significant at the p<0.05 level. Neither their inclusion nor their exclusion from the models had much of an impact on the significance levels of the other variables or signs and magnitudes of their coefficient estimates.
Chronic disease indicators
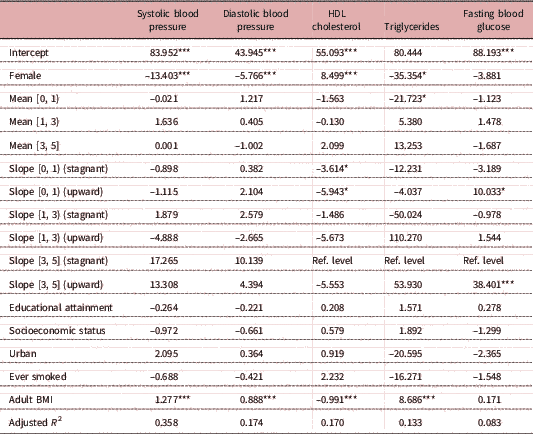
Finally, the associations of chronic disease indicators with childhood anthropometrics, childhood growth trajectories, adulthood characteristics and adult BMI were investigated (Table 2). The continuous dependent variables of interest were systolic blood pressure, diastolic blood pressure, HDL cholesterol, triglycerides and fasting blood glucose. Regressions with LDL cholesterol, or ‘bad cholesterol’, did not inform much, as the models were extremely weak, so they were not included.
Regressions of chronic disease indicators on sex, length-for-age childhood anthropometrics and growth trajectories, adulthood characteristics and adult BMI

The reference group is ‘male’ for sex, ‘downward trajectory’ for slope, ‘rural’ for place of residence, and ‘never smoked’ for smoking status. However, the reference category for slope between ages 3 and 5 switched from ‘downward’ to ‘stagnant’. There were no observations in the downward category for slope between ages 3 and 5 that also have information on HDL cholesterol, triglycerides and fasting blood glucose, so the reference category changed.
Between ages 0 and under 1 is denoted as [0, 1), between ages 1 and under 3 as [1, 3) and between ages 3 and 5 as [3, 5].
*p<0.05; **p<0.01; ***p<0.001.
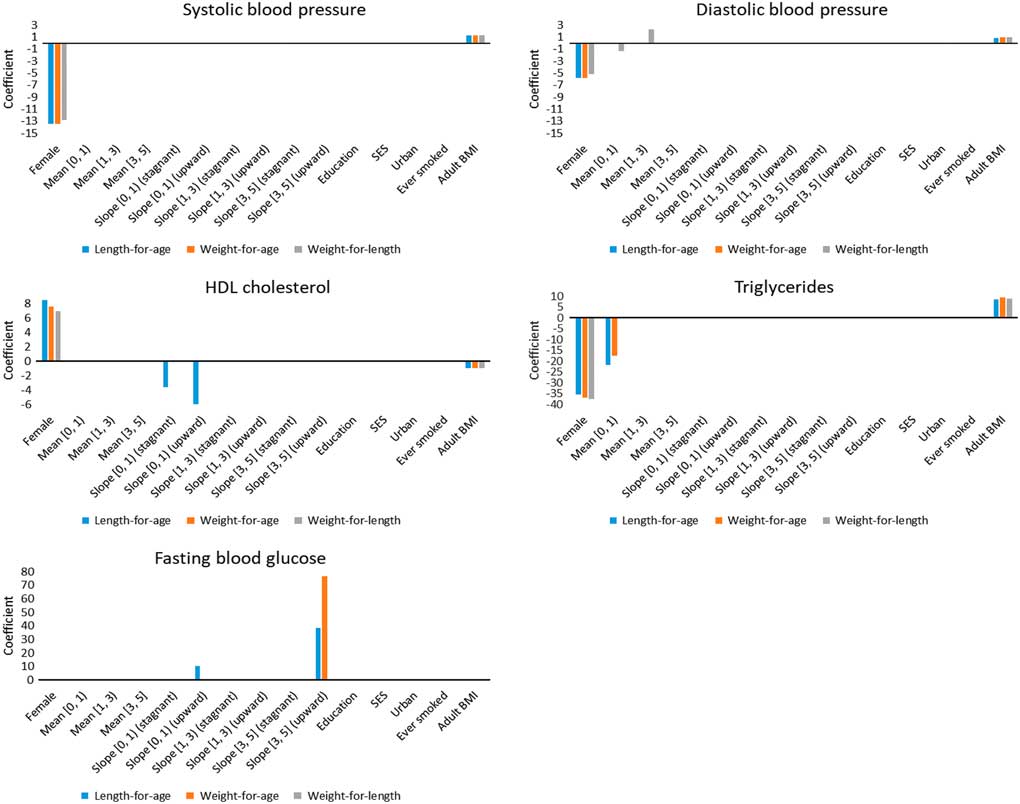
Sex and adult BMI were significant for systolic and diastolic blood pressure. Both kinds of blood pressure tended to be higher for males than for females, and adult BMI was positively associated with blood pressure. However, early-life anthropometrics and early-life growth did not seem to be associated with either blood pressure variable. The model for systolic blood pressure was noticeably stronger than that for diastolic blood pressure.
With HDL cholesterol, or ‘good cholesterol’, as the dependent variable, adult BMI was a significantly negative variable. Females had a significantly higher HDL cholesterol level. With ‘downward’ as the reference category, both stagnant and upward growth trajectories on [0, 1) were significant and negative. This result would suggest an association of growth in the first year of life with lower levels of good cholesterol as an adult. Furthermore, ‘upward’ was more negative, signifying that more growth might have greater adverse consequences.
Females had a significantly lower triglycerides level. Nutritional status on [0, 1) was significantly negatively associated with triglycerides, i.e. having a higher mean z-score in the first year of life was associated with a lower level of triglycerides. And as with the other chronic disease indicators, adult BMI was significantly associated with triglycerides, with the association being positive.
Upward slopes on [0, 1) (relative to downward) as well as on [3, 5] (relative to stagnant) were significantly positively associated with fasting blood glucose, though it was more positive and more significant for slope between ages 3 and 5 years. Having an upward slope between ages 0 and 1 year or between ages 3 and 5 years increased the level of fasting blood glucose. Adult BMI was not a significant variable for fasting blood glucose, though it was for all the other models with chronic disease indicators as dependent variables. Figure 3 shows the results using different anthropometric measures.
Significant variables for chronic disease indicators by anthropometric measure.

Sex and BMI were consistently significant for all dependent variables (except fasting blood glucose) regardless of the anthropometric measure used. Nutritional status at [0, 1) registered as significant and negative on a couple of occasions – for diastolic blood pressure using weight-for-length and triglycerides using length-for-age (reported in Table 2) and weight-for-age. However, using weight-for-length, nutritional status at [1, 3) registered as significant and positive for diastolic blood pressure. While the adjusted R 2 values for the fasting blood glucose models were not as high, there was a clear pattern across measures. Upward slope at [3, 5] was significant using length-for-age and weight-for-age (marginally insignificant for weight-for-length) and the coefficient estimates were always positive.
The interactions between childhood and adulthood nutritional statuses were not reported in the tables due to their insignificance. Various specifications of interactions were tested between the three childhood means and adult BMI, both as continuous variables, one as a continuous variable and the other as a categorical variable, and both as categorical variables. However, none of these interactions ever registered as significant. This would suggest that, in this cohort, childhood z-scores and adult BMI made their impacts additively and did not interact. However, this lack of interaction significance could simply be due to the relatively small size of the sample.
Structural equation modelling
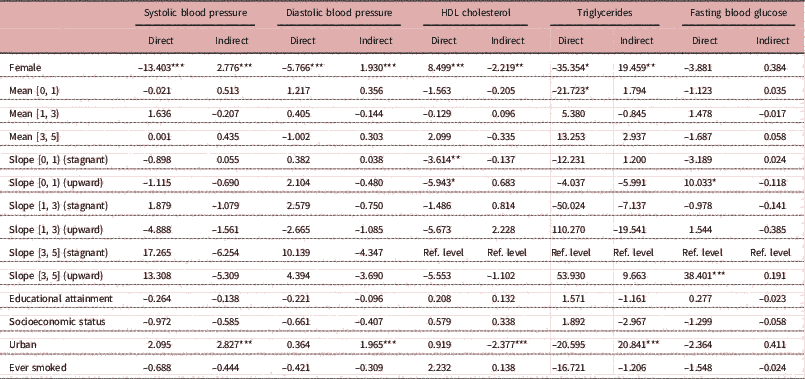
Body mass index was a significant variable for almost all chronic disease indicators. However, was adult BMI truly a significant variable, or was it just a mediating factor through which sex, adulthood characteristics or childhood nutritional status and growth affected the development of chronic diseases? In the former case, policies with adult BMI as a goal could have a significant effect on chronic diseases. However, if adult BMI only acted as an intermediary between a component of sex, adulthood characteristics or childhood nutrition and chronic diseases, then the focus should be on such a component. As a result, it would be important to study both the direct effects of these variables on chronic disease indicators and the indirect effects of these variables on chronic disease indicators that worked through BMI. Structural equation modelling (SEM) could help evaluate the full role, which might have been partially hidden in the regression models, that these variables played. Table 3 shows the coefficient estimates of the direct effects and indirect effects (through adult BMI) of sex, adulthood characteristics and childhood nutrition variables in the model. It should be noted that the coefficient estimates for the direct effects were the same as those reported in Table 2.
Direct and indirect (through adult BMI) effects of sex, length-for-age childhood anthropometrics and growth trajectories, and adulthood characteristics on chronic disease indicators using structural equation modelling (SEM)

The reference group is ‘male’ for sex, ‘downward trajectory’ for slope, ‘rural’ for place of residence and ‘never smoked’ for smoking status.
Between ages 0 and under 1 is denoted as [0, 1), between ages 1 and under 3 as [1, 3) and between ages 3 and 5 as [3, 5].
*p<0.05; **p<0.01; ***p<0.001.
Being female was directly associated with significantly lower blood pressure and triglycerides compared with being male. However, sex had indirect effects on blood pressure and triglycerides in the opposite way. These opposite indirect associations were expected, as being female was associated with having a higher BMI, which was positively associated with blood pressure and triglycerides. This general pattern was reversed for HDL cholesterol. In addition, direct effects were generally stronger than indirect effects. Although place of residence usually did not have a direct association with chronic diseases, it had significant indirect association. Living in an urban area was indirectly positively associated with both kinds of blood pressure and triglycerides, and indirectly negatively associated with HDL cholesterol. Again, these might be due to the strong association of urban dwellers with having a higher BMI.
Childhood nutritional status and growth were not significant (directly or indirectly) for systolic blood pressure or diastolic blood pressure. For HDL cholesterol, triglycerides and fasting blood glucose, there were some significant direct effects for the z-score means and slopes, but none of the indirect effects was significant. The z-score means and slopes that were significant worked directly with the chronic disease indicators themselves, and did not manifest themselves through adult BMI. This was not too surprising, since these variables were almost always insignificant when used as independent variables for adult BMI. These results would indicate the importance of the direct relationship between adult BMI and chronic diseases, as well as the direct relationship between childhood nutrition and chronic diseases.
Discussion
Transitioning out of under-nourished as a child to being either normal or over-nourished as an adult was a common trajectory within this Guatemala sample, though it did not appear that under-nourished children were at significantly different risk from those who began in the normal category. Being female and living in an urban area were found to be associated with a higher adult BMI, as has been found previously in other contexts (Mascie-Taylor & Goto, Reference Mascie-Taylor and Goto2007; Wang et al., Reference Wang, Chen, Shaikh and Marthur2009; Ramachandran, Reference Ramachandran2011).
Using an earlier iteration of these Guatemalan data, researchers found that while risk factors for cardiovascular disease were related to adult adiposity, they were not associated with birth weight for young adult women (and only weakly inversely associated for men) (Stein et al., Reference Stein, Conlisk, Torun, Schroeder, Grajeda and Martorell2002). As expected, adult BMI was found to be important in models for chronic disease indicators in this analysis. Additionally, it was demonstrated in this analysis that childhood nutritional status and growth trajectories did not consistently register as significant across anthropometric measures. The only cases in which significance appeared for more than one measure were for triglycerides and fasting blood glucose levels. Nutritional status in the first year was negatively associated with triglycerides when length-for-age and weight-for-age were used as anthropometric measures, and having an upward growth trajectory between the ages of 3 and 5 years was positively associated with higher levels of fasting blood glucose using these same two measures. These results would suggest that childhood undernutrition and growth might have consequences for adult health, corroborating the work that had been done in more developed countries (Barker, Reference Barker2004). Furthermore, these were direct effects, and did not work through BMI as a mediating factor.
The results suggest that those who are under-nourished as children or those who experienced above-average growth in certain windows within the first 5 years of life might be at a disadvantage later in life. This was found to be the case for triglycerides and fasting blood glucose. However, none of these childhood status or growth variables was significant for blood pressure. A similar result has previously been obtained by Stein et al. (Reference Stein, Barros, Bhargava, Hao, Horta and Lee2013) using an aggregation of the COHORTS data. They found that being born preterm or small was not related to blood pressure as an adult. However, they found that these were also not related to fasting blood glucose. Such a relationship between anthropometrics and fasting blood glucose was found in this study, but the significance came from the childhood growth variables. Further research on biological processes linking childhood growth with various chronic diseases would be illuminating.
A notable insignificant result was that interactions between childhood and adulthood nutritional statuses were not significant. Nutritional status and growth trajectory in specific windows between ages 0 and 5 years were sometimes individually significant for various chronic disease indicators, but childhood z-scores and adult BMI did not interact multiplicatively in their association with chronic disease indicators. The Fetal Origins Hypothesis posits that those who are under-nourished as children and experience growth later in life could be at a disadvantage as adults, in terms of both adult BMI and chronic disease outcomes, and it was thus important to study the interaction model that included an interaction between early and later size (Lucas et al., Reference Lucas, Fewtrell and Cole1999; Delisle, Reference Delisle2002). However, the lack of significant interactions between childhood undernutrition and adulthood overnutrition for chronic disease indicators would seem to counter this hypothesis. While this could be just a statistical artifact stemming from the sample size, perhaps either starting nutritional status or growth within a certain window in childhood, as opposed to the combination of the two, is what matters.
There were other potentially interesting results here as well, specifically for nutritional status between the ages 0 and under 1 and between the ages 1 and under 3, and growth trajectory between the ages of 0 and under 1. However, the significance of these variables often differed depending on which anthropometric measure was used. It was not surprising that length-for-age, weight-for-age and weight-for-length produced different results, as these three measures were all calculated using different components. While having a low value for any of these measures is not desirable, different measures reflect different conditions. For example, having a low length-for-age (stunting) reflects chronic undernutrition, whereas having a low weight-for-height (wasting) reflects acute undernutrition (FANTA, 2011). Similar substantive conclusions were generally obtained in this study, independent of the measure used. However, there were certain instances where the significance results did not all line up. These measures should not be used interchangeably, and researchers should understand the nuances of these anthropometric measures before choosing an appropriate one for analysis.
There might be some concern that the adjusted R 2 values for the models presented were not high. However, the objective of creating these models was not to get the highest R 2, but to ascertain which variables were associated with various outcomes. However, there were probably other variables also associated with these outcomes of interest, but which had not been taken into account. There might also be concern about potential multicollinearity between the mean and slope variables, but variance inflation factors (VIFs) were calculated for each model, and these were never at worrisome levels.
Sensitivity checks were performed, especially on the mean and slope variables, to test the robustness of the results. The way in which mean and slope variables were separated into various age segments did not make much of a difference. Three segments were used since that would make the most sense given the frequency of measurements. Two-segment models with ages 0–1 and 1–5 years, as well as 0–2 and 2–5 years were tried. The results remained relatively consistent between models. Regressions using only the three means, but without the slopes, were also run. The models with the additional slope variables were stronger, and they also revealed the significance of some of the slope variables. Other thresholds to classify slopes, such as 0.05, were also used to test the sensitivity of the models to the data-driven choice of 0.1. Similar conclusions were obtained.
To further validate the chronic disease models, BMI measured in 1998 instead of in 2004 was used, as there could have been some lag between nutritional status as measured by BMI and chronic disease incidence. The conclusions were very similar, though the models using BMI in 2004 were stronger, perhaps due to the larger sample sizes and typically higher correlations between BMI and chronic disease indicators in the same year. Different variables for smoking status were also tested. Regardless, smoking status never registered as significant in these models.
What do these results mean for policy? Assistance from higher-income countries and international organizations often goes to children who are under-nourished. This analysis showed that those with a lower mean z-score in the first year of life, on average, had a higher level of triglycerides as adults, already placing them at a disadvantage. Consequently, it would seem natural to try to help children with lower nutritional status to avoid further detriment from under-nourishment. However, policy implementation might be precarious here, as promoting catch-up growth might also not be the best form of assistance for other long-term outcomes (Ong, Reference Ong2007; Thureen, Reference Thureen2007; Nobili et al., Reference Nobili, Alisi, Panera and Agostoni2008). Here, it was shown that upward growth between ages 3 and 5 years was associated with higher levels of fasting blood glucose in adulthood. The Fetal Origins Hypothesis conjectures that quick growth in childhood could actually have undesirable consequences later in life, and these analyses suggested that both nutritional status and growth at young ages might be associated with at least some chronic diseases.
While the results of this analysis were not definitively causal, policymakers should take into account the timing (age of children) and allocation (variations in the amount of aid throughout childhood) of nutritional assistance. The concept of ‘healthy catch-up growth’ is critical, but additional exploration is necessary to further flesh it out. This has been cited as an important ‘goal of future research’ (Ong, Reference Ong2007). The important link between mother and child suggests that it might also be worthwhile to consider interventions directed towards the previous generation. Education and nutritional supplementation for mothers could have important inter-generational impacts that could end up being crucial for their children (Bhutta et al., Reference Bhutta, Das, Rizvi, Gaffey, Walker and Horton2013).
In conclusion, these analyses on a Guatemalan birth cohort demonstrated how demographic characteristics and nutritional processes are associated with later health outcomes. Since the data came from only one country, any generalization should be cautious. Nevertheless, the context in which this was being studied is novel, as analyses from birth to adulthood are rare in the developing context. This study provides a good first step in the analysis of nutritional transitions over the life course and chronic disease risk in developing countries, as well as a discussion on the implementation of assistance. More research is needed to study the underlying biological processes and to determine how strong these associations are, with a view to optimally implementing the timing and allocation of assistance to prevent exacerbating the harm to those who might already have been handed a disadvantage at birth.
Acknowledgments
The author would like to thank Professors Jere Behrman, Michel Guillot and Samuel Preston for their time and guidance throughout the development of this paper. The author would also like to thank Professor Aryeh Stein for granting access to some of the INCAP data. The INCAP data used in the analysis were collected with funding from the US National Institutes of Health.
Ethical Approval
The author asserts that all procedures contributing to this work comply with the ethical standards of the relevant national and institutional committees on human experimentation and with the Helsinki Declaration of 1975, as revised in 2008.
Conflicts of Interest
The author has no conflicts of interest to declare.
Funding
This research received support from the Population Research Training grant (NIH T32 HD007242) from the Eunice Kennedy Shriver National Institute of Child Health and Human Development (NICHD).