

INTRODUCTION
Sign languages are independent, fully fledged languages created by deaf people in different countries (for a review, see Brentari, Reference Brentari2010). Lexical items, be they signed or spoken, are mappings between a phonological form and a meaning or set of meanings. As children's vocabulary grows, items become organized into a semantic network, with strong links between items that are closely related, weaker links between items that are less closely related, and a hierarchical organization that reflects taxonomic relationships (for a review of lexical acquisition, see Clark, Reference Clark1993). The learning of lexical items, and their organization within a semantic network, is just as central to the acquisition of a signed language as it is to spoken language acquisition.
This article investigates lexical organization in two groups of deaf children who are acquiring British Sign Language (BSL): those who are learning BSL without any difficulty, and those who have Specific Language Impairment (SLI) in BSL. We investigate these children's lexical organization using a semantic fluency task adapted for BSL. This is the first investigation of semantic fluency with deaf children in any signed language.
This ‘Introduction’ is structured as follows. After a general introduction to lexical acquisition in deaf signing children, we discuss the main features of (hearing) children's performance on the semantic fluency task and discuss what the task measures. We also discuss the only previous study of semantic fluency in signers, which tested deaf adults who use BSL. We then turn our attention to the characteristics of SLI in signed languages, and to previous results of semantic fluency in hearing children with SLI. We end by setting out our predictions on the semantic fluency task for two groups of deaf signing children: those whose language is developing appropriately, and those who have SLI in BSL.
Lexical acquisition in deaf children is interesting for several reasons that can be linked to the nature of language exposure in this group. Research on language development in deaf native signers (i.e. those who acquire a natural sign language from birth, and from their parents) has shown that early exposure to sign enables children to reach developmental milestones at the same pace as their hearing peers acquiring spoken languages (Anderson & Reilly, Reference Anderson and Reilly2002; Lillo-Martin, Reference Lillo-Martin, Lust, Suñer and Hermon1994; Woolfe, Herman, Roy & Woll, Reference Woolfe, Herman, Roy and Woll2010). However, only 5–10% of deaf children receive sign language input from their deaf parents (Mitchell & Karchmer, Reference Mitchell and Karchmer2004), which leaves the remaining 90–95% of children who are born to hearing parents with little or no early experience of sign language. This latter group of children grow up with widely differing language-learning backgrounds. Research on deaf children growing up with hearing parents suggests a slower pace of sign lexical acquisition and a smaller lexicon size (Anderson, Reference Anderson, Schick, Marschark and Spencer2006; Blamey, Reference Blamey, Marschark and Spencer2003; Lederberg & Spencer, Reference Lederberg and Spencer2009; Prezbindowski & Lederberg, Reference Prezbindowski and Lederberg2003). This may be largely due to reduced incidental exposure to sign language: hearing parents tend to use sign only when directly addressing their deaf child and not with other hearing family members. This means that the child has few opportunities for picking up vocabulary through observing the interactions of others (Marschark, Reference Marschark1997).
What are the consequences of these differences in language exposure for lexical acquisition and the ensuing organization of the lexicon? There are very few studies on this topic. In some ways, sign vocabulary acquisition in native signers appears to be very similar to that of hearing children in spoken languages. For example, Anderson and Reilly (Reference Anderson and Reilly2002) report that native deaf signers' acquisition of American Sign Language (ASL) vocabulary within particular semantic domains, such as question words, emotion words and cognitive verbs, is comparable to that found in hearing peers. On the other hand, a recent study on early British Sign Language development in deaf children of hearing parents suggests a higher frequency of certain verbs or signs based on actions (e.g. CATCH, PLAY, SWIM, CROCODILEFootnote 1), compared to native signing children and hearing children who are acquiring a spoken language (Marschark & Woll, unpublished observations). This action bias is also seen in deaf children's homesigns (conventionalized gestures created between children and their hearing parents; Goldin-Meadow, Butcher, Mylander & Dodge, Reference Goldin-Meadow, Butcher, Mylander and Dodge1994).
In the present study we investigated the lexical organization of nouns, within two particular semantic domains: food and animals. These domains have been widely studied in spoken language (Crowe & Prescott, Reference Crowe and Prescott2003; Lucariello, Kyratzis & Nelson, Reference Lucariello, Kyratzis and Nelson1992; Nelson, Reference Nelson1974, inter alia). The task we use – semantic fluency – is straightforward to administer: participants name as many exemplars as they can from a particular semantic category within a limited period of time (usually one minute). Semantic fluency has been used in many spoken languages with a range of age groups and with children who have various developmental disorders, including Down Syndrome (Nash & Snowling, Reference Nash and Snowling2008), High Functioning Autism (Boucher, Reference Boucher1988), and Attention Deficit/Hyperactivity Disorder and Tourette's Syndrome (Mahone, Koth, Cutting, Singer & Denckla, Reference Mahone, Koth, Cutting, Singer and Denckla2001). It also has the advantage that many different aspects of performance can be analyzed beyond just the number of items produced. We therefore considered it an appropriate tool for adaptation into BSL, for testing deaf children with SLI, and for investigating potential group differences in lexical organization between deaf children with SLI and those with typically developing signing skills.
When a word is spoken (or a sign produced) it is assumed that this will in turn activate other words or concepts that are semantically similar or associatively related to it (Crowe & Prescott, Reference Crowe and Prescott2003). Hence it is also assumed that the order in which words are produced during the semantic fluency task will indicate, indirectly, their proximity to each other in the lexicon. Given the limited amount of time that participants are given to respond, the task does not provide an exhaustive list of the words that they know, but it does reveal those items that come most readily to mind.
Performance on this task shows a number of consistent characteristics, termed ‘cognitive signatures’ (Koren, Kofman & Berger, Reference Koren, Kofman and Berger2005; Riva, Nichelli & Devoti, Reference Riva, Nichelli and Devoti2000; Sauzéon, Lestage, Raboutet, N'Kaoua & Claverie, Reference Sauzéon, Lestage, Raboutet, N'Kaoua and Claverie2004; Troyer, Moscovitch & Winocour, Reference Troyer, Moscovitch and Winocur1997). There is a hyperbolic decline in the rate of production of new items over the duration of the task, and items are produced in bursts of semantically related words. More prototypical category exemplars are produced with higher frequency (i.e. by more participants) than less typical ones. The task is generally considered to provide a measure of both semantic organization and executive function. If participants can generate exemplars in response to a superordinate label, e.g. ‘food’, then this suggests that semantic knowledge is organized taxonomically. Furthermore, there is internal clustering, whereby words that are even more closely related are produced together (for example, a cluster of farm animals, or a cluster of fruits). Good performance on the task requires good semantic memory, i.e. the component of long-term memory that contains the permanent representation of our knowledge of objects, facts and concepts as well as words and their meaning. The task also requires the use of word-retrieval strategies, which in turn rely on executive functions, namely switching (i.e. set-shifting between different clusters), working memory (to keep track of items that have already been produced), and inhibition (so as to avoid repeating previous responses, and irrelevant responses). These skills enable the participant to retrieve lexical items more efficiently.
An obvious question is whether semantic fluency in a signed language shows the same cognitive signatures as those reported for spoken languages. Despite its widespread use as a tool in spoken language, there is only one other study of semantic fluency in a signed language (Marshall, Rowley & Atkinson, unpublished observations). Marshall et al. tested thirty native or near-native users of BSL aged between eighteen and sixty years old, with the same categories used in the present study, namely ‘food’ and ‘animals’. They discovered the same cognitive signatures as reported for spoken language fluency, i.e. a hyperbolic decline in the rate of production of new items over the duration of the task, clusters of semantically related words, and more prototypical category exemplars being produced by more participants than less typical ones. Importantly, the number of items produced in each category was comparable to reports of adults in spoken languages (e.g. English: Harrison, Buxton, Husain & Wise, Reference Harrison, Buxton, Husain and Wise2000; Greek: Kosmidis, Vlahou, Panagiotaki & Kiosseoglou, Reference Kosmidis, Vlahou, Panagiotaki and Kiosseoglou2004; Hebrew: Kavé, Reference Kavé2005; Spanish: Buriel, Gramunt, Bohm, Rodes & Peña-Casanova, Reference Buriel, Gramunt, Bohm, Rodes and Peña-Casanova2004), despite the smaller established lexicon of BSL compared to spoken languages (Sutton-Spence & Woll, Reference Sutton-Spence and Woll1999).
The existence of fingerspelling (i.e. a manual alphabet) is another difference between spoken and signed languages. Fingerspellings of a few highly-frequent and short items (e.g. HAM, h-a-m; EGG, e-g-g) have become lexicalized. However, fingerspelling is also used for low-frequency items for which there is no established sign. In addition, In Marshall et al.'s study, fewer than 2% of items were fingerspellings, indicating that during the semantic fluency task signers were retrieving signs from the established BSL lexicon, rather than retrieving items from their English lexicon and spelling them out.
The present study is the first documented investigation of semantic fluency in signing children. In addition to reporting data from deaf children who are acquiring BSL without any evidence of difficulty, we investigate semantic fluency in deaf children with SLI in their acquisition of BSL.
SLI is a significant impairment in acquiring language despite normal non-verbal IQ and no gross level of impairment in neurological function, motor development or social interaction, alongside normal hearing (Leonard, Reference Leonard1998). The requirement for normal hearing means that profoundly deaf children are excluded from a diagnosis of SLI by default. Yet given that 7% of the general hearing child population have SLI (Tomblin, Records, Buckwater, Zhang, Smith & O'Brien, Reference Tomblin, Records, Buckwater, Zhang, Smith and O'Brien1997), this would also be expected to be the case for deaf children, including those whose primary mode of communication is a signed language.
The characterization of SLI in signed languages is just beginning, and has so far been reported in only two signed languages: BSL (Mason et al., Reference Mason, Rowley, Marshall, Atkinson, Herman, Woll and Morgan2010; Morgan, Herman & Woll, Reference Morgan, Herman and Woll2007), and ASL (Quinto-Pozos, Forber-Pratt & Singleton, Reference Quinto-Pozos, Forber-Pratt and Singleton2011). A major difficulty in identifying SLI with confidence in children acquiring a signed language is the aforementioned confound with delayed language exposure – over 90% of deaf children are born to hearing parents, who are not able to provide fluent sign language input. Deaf children may be exposed to fluent models of sign language outside the family, for example if they attend preschool settings with deaf signing staff, but for most their first contact with sign language will be when they start school. Their language development will hence be delayed, although many will go on to be proficient signers. Yet experienced teachers of the deaf and speech and language therapists do report working with children who are not acquiring sign language as well as would be expected in comparison to peers who have had the same (delayed) language experience (Edwards, Reference Edwards, Marschark and Spencer2010; Mason et al., Reference Mason, Rowley, Marshall, Atkinson, Herman, Woll and Morgan2010; Quinto-Pozos et al., Reference Quinto-Pozos, Forber-Pratt and Singleton2011).
Alongside the issue of late language exposure, another important factor that complicates the diagnosis of SLI in signed languages (in common, indeed, with many lesser-studied spoken languages) is the lack of standardized language assessments. For many signed languages, even those in the developed world, reliable language assessments are not available (Haug, Reference Haug2005). Professionals may, of course, be able to draw upon their own knowledge of sign language acquisition to determine when a child seems to be learning language more slowly than expected. Yet in these cases identification relies on many years of experience on the part of the professional.
One of the few signed languages for which standardized measures of receptive and expressive language are available and suitable for children is BSL, the assessment instruments being the BSL Receptive Skills Test (Herman, Holmes & Woll, Reference Herman, Holmes and Woll1999) and the BSL Production Test (Herman, Grove, Holmes, Morgan, Sutherland & Woll, Reference Herman, Grove, Holmes, Morgan, Sutherland and Woll2004). These two tasks have been used as the basis for identifying SLI in deaf children who use BSL in a couple of studies to date (Mason et al., Reference Mason, Rowley, Marshall, Atkinson, Herman, Woll and Morgan2010; Morgan et al., Reference Morgan, Herman and Woll2007). In Mason et al.'s group study of SLI in signers, children were considered to have SLI when a teacher of the deaf or a specialist speech and language therapist reported language concerns after comparing their development to other deaf children in the same classes with comparable exposure to BSL. Children with additional diagnoses of special educational need, e.g. autism, were excluded, but those with reading difficulties were not, given the close relationship between language and literacy development (Cain, Reference Cain2010) and the difficulties that many deaf children face in learning to read (Allen, Reference Allen, Schildroth and Karchmer1986; Conrad, Reference Conrad1979). In addition, the children were required to display non-verbal abilities in the normal range but impaired performance on one or both of the BSL standardized assessments.
Mason et al.'s (Reference Mason, Rowley, Marshall, Atkinson, Herman, Woll and Morgan2010) study of thirteen deaf children with SLI, aged 5 ; 10–14 ; 08 showed that sven out of thirteen children scored −1·3 SD or worse on the BSL Receptive Skills Test and that all scored at or below the 10th percentile on one or more subtest of the BSL Production Test. Children's narratives almost invariably showed minimal use of grammatical morphology, unclear signing, and no introduction of characters or setting. A more in-depth characterization of the linguistic features of SLI in sign language users is required, and the present study contributes to this endeavour.
Only a small number of studies have used the semantic fluency task with hearing children who have SLI in spoken language. Recently, Henry, Messer and Nash (Reference Henry, Messer and Nash2012) reported that a group of English-speaking children with SLI performed below their chronological age-matched controls on both verbal and non-verbal fluency tasks. However, their difficulties were particularly marked for phonological fluency, a task where participants are asked to generate as many words as they could that began with a particular sound or letter. For phonological fluency, children performed more poorly than they did for semantic and non-verbal fluency (Nash, Henry & Messer, Reference Nash, Henry and Messer2010).
In a different test probing lexical organization, an association task whereby children were asked to generate three words associated to each of a list of forty-eight words, a subgroup of children with SLI performed more poorly than typically developing peers matched for expressive vocabulary ability (Sheng & McGregor, Reference Sheng and McGregor2010). Such children generated fewer semantically related responses and more unrelated responses than expected. However, the SLI group as a whole was characterized by variable performance, and some children performed age-appropriately.
The findings from these studies confirm the general view in the field of SLI research that although these children vary greatly in their lexical abilities, lexical deficits do not characterize the disorder in the way that morphological and syntactic impairments do (Leonard, Reference Leonard1998). Moreover, in their case study of a deaf native signer with SLI, Morgan and colleagues report that the boy had a good sign vocabulary. Even though he was five years old he mostly communicated with single signs, and his deficits were argued to lie principally in the morphology and syntax of BSL (Morgan et al., Reference Morgan, Herman and Woll2007). That preliminary study raises the possibility that lexical deficits may not characterize SLI in signed languages either. However, this has not yet been tested in a fluency task, which measures lexical organization and speed of access to lexical representations.
Predictions for our study
We set out to investigate semantic fluency performance in deaf children who are acquiring BSL typically, and in deaf children who have SLI in their signing. Semantic fluency offers a rich dataset over which several different analyses can be undertaken. In particular, we calculated various measures and made the following predictions:
1. Total number of responses and number of correct and incorrect responses. We predicted that the task would be sensitive to development, and therefore that the total and correct number of responses given by both groups would increase with age. We compared the total number of correct responses with figures available from the spoken language literature. Given that both of our experimental groups contain children with late exposure to BSL, productivity (i.e. total number of responses) was predicted to be lower than for children of the same age who are acquiring spoken language.
2. Rate of decline of responses. We calculated the number of responses during each quadrant of the time available for the task, i.e. at 1–15 seconds, 16–30 s, 31–45 s and 46–60 s. For both groups we predicted a decline in response rate over the course of the minute, as has been reported for spoken language and in deaf adults doing the task in BSL.
3. Semantic clusters. We calculated the number of semantic clusters, where clusters were defined as two or more successive words belonging to a conventional subcategory. We predicted that, as has been reported in previous studies of deaf adults and of hearing children and adults, such clusters would be identifiable. We also calculated how many items there were in each cluster, and how many switches there were between clusters and/or non-clustered items. This allowed us to investigate whether increased productivity was related to an increase in the number of clusters generated and the number of times children switched between clusters, or alternatively to an increase in the size of the clusters.
4. Item analysis. We investigated which items emerged as most ‘typical’, and how these compared to studies of hearing children from the USA and the UK doing the task in English. Given that hearing English-speaking children and children who use BSL are growing up in the same Westernized society, we did not expect differences here.
STUDY 1: TYPICALLY DEVELOPING DEAF CHILDREN
INTRODUCTION
We first investigated semantic fluency in typically developing deaf signers, with the aim of comparing performance to that of hearing children doing the task in spoken languages, and to provide a comparison group to the children with SLI who participated in Study 2.
METHODS
Participants
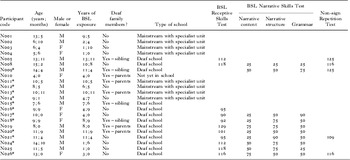
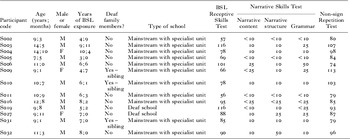
Twenty-two deaf signing children, aged 4 ; 00 to 15 ; 2, participated in this study. None had any identified educational need (e.g. Autism, Attention Deficit/Hyperactivity Disorder, intellectual disability) other than deafness. All were acquiring BSL without any difficulties, as reported by their teachers and parents. Table 1 shows the range of backgrounds with respect to whether there is a Deaf family member and the type of school attended. This range is representative of the variable language background of deaf children. Current scores on one or both of the standardized tasks of BSL (BSL Receptive Skills Test: Herman et al., Reference Herman, Holmes and Woll1999; BSL Production Test: Herman et al., Reference Herman, Grove, Holmes, Morgan, Sutherland and Woll2004) and/or the Nonsense Sign Repetition Test (Mann, Marshall, Mason & Morgan, Reference Mann, Marshall, Mason and Morgan2010) were available for only twelve of these children, and were made available to us by their schools. All twelve had scores within the normal range, and these are reported in Table 1. As we already had an experimental battery lasting between one and two hours, we were not able to ask for an additional hour to administer the tests ourselves to the other ten children. However, each child was seen for the experimental battery and a warm-up conversation by the second author, who is a Deaf native signer experienced at working with deaf children. In no case did she suspect any difficulty in BSL acquisition – in her judgement, all children had BSL skills at the expected level for their age and exposure.
Background information for typically developing children in Study 1

note: The asterisks indicate the children who took part in Study 2, as age-matched controls to the children with SLI.
Procedure
We used two semantic categories – ‘food’ and ‘animals’ – which are the most widely used categories in the spoken language literature (Koren et al., Reference Koren, Kofman and Berger2005; Kosmidis et al., Reference Kosmidis, Vlahou, Panagiotaki and Kiosseoglou2004; Nash & Snowling, Reference Nash and Snowling2008; Riva et al., Reference Riva, Nichelli and Devoti2000; inter alia). Instructions were delivered in BSL by the experimenter (second author, a Deaf native signer, or third author, hearing signer with advanced BSL skills). The instructions were straightforward: “Please tell me the names of as many animals/food items as you can. Be as quick as possible. You have one minute. Ready? Go”. No examples were given, but ‘colours’ was used as a practice category. Responses were filmed and subsequently glossed into English.
RESULTS
Data loss
Two children (N004 and N010; the youngest children at 5 ; 6 and 4 ; 0 respectively) appeared not to understand the task and were unable to respond without prompting. Another child (N016; aged 9 ; 9) responded to just one category (‘animals’), and so her partial data were excluded from the analysis. We therefore present data from only nineteen of the twenty-two children who participated.
Coding of responses
The signs were glossed into English semantic equivalents, timed (i.e. it was noted how many seconds into the minute they were produced) and coded as correct/incorrect by the second and third authors working together. Each incorrect response was coded as one of three types, and these categories captured all the errors:
• Repetition of an item
• Intrusion (i.e. an item that was from a category other than food/animals)
• Uninterpretable
The coding was checked by the first author (hearing linguist with advanced BSL skills), who discussed the very few discrepancies (all involving uninterpretable items) with the second and third authors until a consensus was reached. The first author then further coded the correct and repeated responses according to semantic clusters. A cluster was defined as two or more adjacent responses that were semantically related in some way. We allowed categories to emerge from the data, rather than imposing them. For example, in one recent study the taxonomic categories ‘mammal’, ‘bird’, ‘reptile’, ‘amphibian’, ‘fish’ and ‘insect’ were used to code data from hearing children (Nash & Snowling, Reference Nash and Snowling2008). However, in our view this coding scheme does not reflect how our participants were grouping their responses. We therefore followed an emergent approach to coding clusters (e.g. Kosmidis et al., Reference Kosmidis, Vlahou, Panagiotaki and Kiosseoglou2004). Animal categories were: ‘zoo’, ‘pet’, ‘farm’, ‘water’, ‘invertebrate’, ‘bird’ and ‘British wild’. The number of food categories was much greater, and included: ‘fruit’, ‘vegetables’, ‘meat’, ‘carbohydrates’, ‘desserts’, ‘snacks’, ‘meals with chips’, ‘takeaway meals’, ‘breakfast foods’, ‘Italian foods’ and ‘roast dinner foods’.
This emergent approach is supported by evidence from Crowe and Prescott (Reference Crowe and Prescott2003) that children cluster animals around their environmental context (e.g. home, farm, zoo). It meant, however, that certain responses could potentially fall into more than one category. For example, the animal FISH could fall into the categories ‘pet’ or ‘water’, and DUCK into ‘farm’, ‘bird’ or ‘water’. In each case the category was chosen based on the answers before and after. For example, CROCODILE was coded as ‘reptile’ when it occurred in the sequence ‘SWAN–SNAKE–CROCODILE–SHARK’ but in the category ‘zoo’ when it occurred in the sequence ‘LION–CROCODILE–ELEPHANT’. In assigning categories we endeavoured to be as inclusive as possible, meaning that we tried to ensure that as many responses as possible fell within clusters. An example of the coding for one child's responses is presented in the ‘Appendix’.
Responses for eight children (four typical, four SLI (i.e. for Study 2)) were then independently coded by the fourth author (hearing Speech and Language Therapist with advanced BSL skills) with respect to semantic clusters using the coding instructions exactly as they appear below. Despite allowing categories to emerge from the data rather than imposing them, and despite more categories emerging for food than for animals, inter-coder agreement was high and equivalent across food and animals: 88·71% for animals and 88·53% for food.
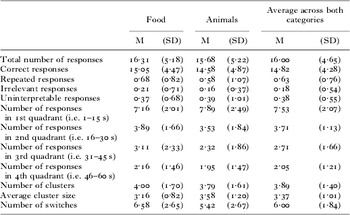
Table 2 presents the total number of items within each category, and the mean score across both categories. There was no significant difference between the number of responses to food and animals (t(18) = 0·594, p = 0·560). Nor did the two categories differ in the number of correct items, repeated items, irrelevant items or uninterpretable items (all ts <0·6). Error rates across all three error types were low.
Results for ‘food’ and ‘animals’ in Study 1

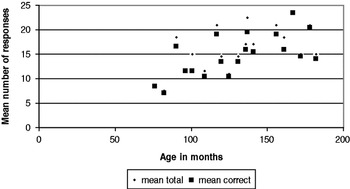
A correlational analysis with age revealed that both the number of total responses and the number of correct responses (averaged across ‘food’ and ‘animals’) increased with age, as shown in Figure 1 (r(19) = 0·601, p = 0·007; and r(19) = 0·648, p = 0·003, respectively). The correlations between total responses and years of BSL exposure, and between correct responses and BSL exposure, were not significant, however (r(19) = 0·144, p = 0·556; and r(19) = 0·192, p = 0·430).
Mean total and mean number of correct responses for each participant in Study 1, plotted against age.

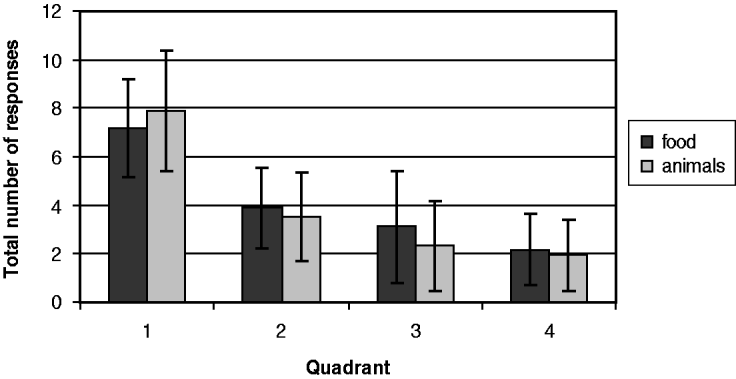
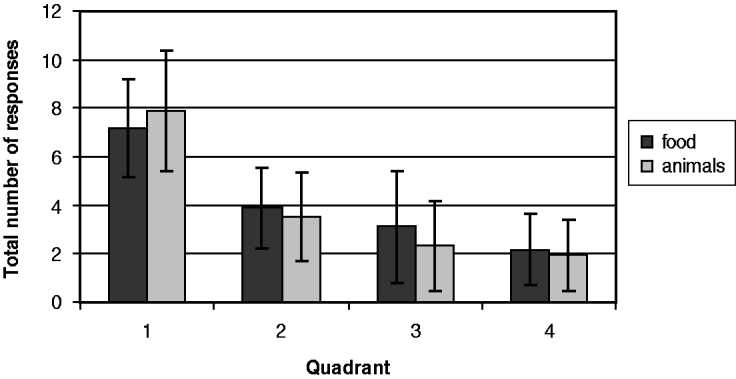
The total number of responses in each quadrant of the minute did not differ significantly between ‘food’ and ‘animals’; for quadrant 1 (i.e.1–15 s: t(18) = −1·764, p = 0·095; for quadrant 2 (16–30 s): t(18) = 0·601, p = 0·555; for quadrant 3 (31–45 s): t(18) = 1·326, p = 0·201; and for quadrant 4 (46–60 s): t(18) = 1·312, p = 0·206). The decline in responses over the course of the minute is shown for each category in Figure 2. Bars indicate 1SD above and below the mean.
Rate of decline of responses over the four quadrants of the minute for participants in Study 1.
No significant differences were found between ‘food’ and ‘animals’ in terms of the number of clusters produced or average cluster size (t(18) = 0·515, p = 0·613; and t(18) = 1·249, p = 0·228, respectively). Nor was the number of switches significantly different (t(18) = 1·312, p = 0·206). Responses to ‘food’ and ‘animals’ were therefore collapsed in the analysis that follows.
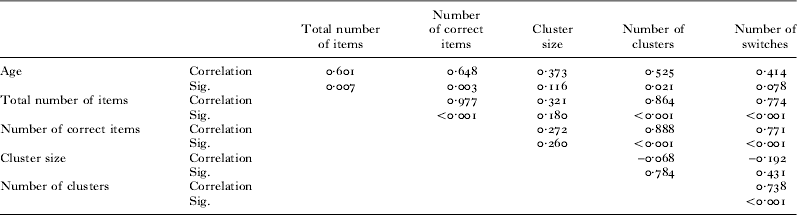
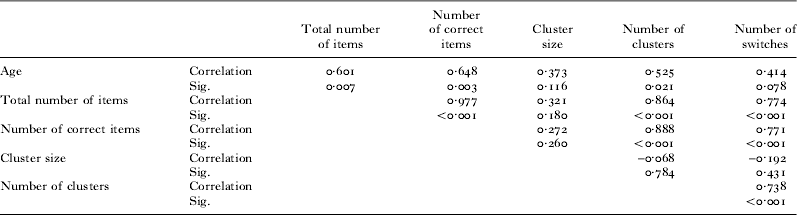
In order to investigate how cluster size, cluster number and the number of switches relate to age and productivity (i.e. do children who produce more correct responses do so because they produce bigger clusters, or because they produce more clusters, and switch more often between clusters and/or individual items?), correlations between number of correct responses and those three measures were carried out. The number of correct responses correlated significantly with the number of clusters (r(19) = 0·888, p < 0·001) and number of switches (r(19) = 0·771, p < 0·001), but not with cluster size (r(19) = 0·272, p = 0·260). The full correlation matrix between number of correct responses, total number of responses, age, number of clusters, cluster size and number of switches is shown in Table 3.
Correlation matrix for number of age, total number of responses, correct responses, cluster size, number of clusters and number of switches in Study 1
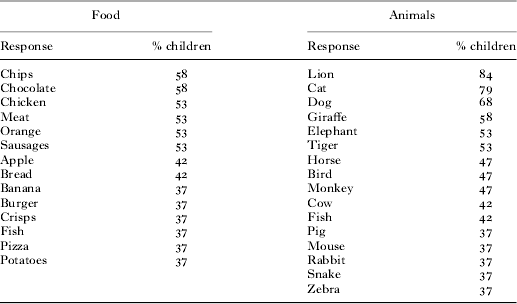
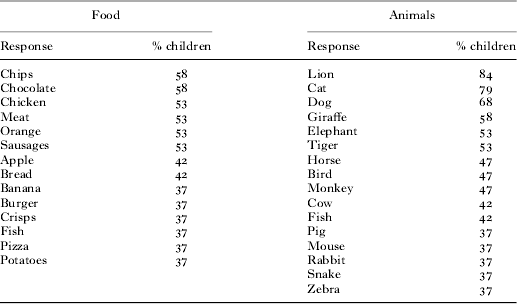
Finally, all responses given by more than 33% of the children (a cut-off selected arbitrarily) are shown in Table 4.
Responses from 33% or more of children in Study 1
DISCUSSION
The aim of Study 1 was to investigate the cognitive signatures of semantic fluency in typically developing deaf children who use BSL. We expected to find an increase in fluency with age. We also expected to find the same cognitive signatures as have been found in children and adults who use spoken language and in deaf adults who use BSL, namely the production of items in bursts of semantically related words, similar category exemplars produced with high frequency (i.e. by a large proportion of participants), and a decline in rate of production of new items over the course of the minute. All of these signatures were indeed found to characterize semantic fluency in children acquiring BSL.
The mean of 14·82 correct responses (SD 4·28) is difficult to compare directly to that reported in the literature for hearing children, as there are few studies encompassing the wide age range of the present study. Nash and Snowling (Reference Nash and Snowling2008) found a mean fluency of 13·24 (averaged across ‘food’ and ‘animals’) for English-speaking children aged 5 ; 6–9 ; 5. In Italian, Riva et al. (Reference Riva, Nichelli and Devoti2000), found that for children aged 5 ; 11–11 ; 4, productivity increased from a mean of approximately 10 items in the youngest children to 17 items in the oldest group (again, averaged across ‘food’ and ‘animals’). Koren et al. (Reference Koren, Kofman and Berger2005) reported for Hebrew-speaking children aged 9–11 a mean production of 15 ‘animal’ and 10 ‘food’ items. Therefore the children in the present study were performing at an approximately similar level to the reported literature, despite many of the group not having exposure to BSL from birth (only 5/22 were native signers). Therefore, it does not appear that deaf children, providing they are able to understand the task requirements, find the task in BSL more difficult than hearing children doing the task in a spoken language.
Nevertheless, despite the small sample size, and the variability in BSL exposure across the group, we found an increase in productivity with age, as has been reported for spoken languages (Koren et al., Reference Koren, Kofman and Berger2005; Riva et al., Reference Riva, Nichelli and Devoti2000; Sauzéon et al., Reference Sauzéon, Lestage, Raboutet, N'Kaoua and Claverie2004). There is still the potential for a developmental increase in productivity, given that native adult signers averaged 23 items in BSL (Marshall et al.). We found that increased productivity was related to an increase in cluster number and the number of switches, rather than to cluster size. Again, this mirrors the results for spoken language (Koren et al., Reference Koren, Kofman and Berger2005). In other words, the most fluent children produce more responses because they retrieve a greater number of subcategories within ‘food’ and ‘animals’, and not because they produce more items in each subcategory. The standard interpretation in the literature is that it is an increase in cognitive flexibility that drives the switch to a new semantic subcategory once lexical retrieval within a particular subcategory slows down (Koren et al., Reference Koren, Kofman and Berger2005; Troyer et al., Reference Troyer, Moscovitch and Winocur1997). Older children do of course also tend to have larger vocabularies (although we were unable to measure this directly in our study because there was no standardized BSL vocabulary test available), but with respect to the increase in fluency, it appears that executive functions are the main driver.
The items produced by the deaf children in BSL are very similar to those reported in studies of English. For example, Nelson (Reference Nelson1974) reports amongst five- and eight-year-olds in the USA that the most common animal responses are ‘giraffe’, ‘lion’, ‘elephant’, ‘tiger’, ‘horse’, ‘cat’ and ‘dog’. Crowe and Prescott (Reference Crowe and Prescott2003) also report a high frequency of these items in the responses of five- to ten-year-old children from England. These were also the most common responses in our study. Nelson (Reference Nelson1974) additionally tested the category ‘fruit’ and found the most common fruits were ‘orange’, ‘apple’ and ‘banana’, also the three most common fruit responses in our food category. This similarity in responses is not surprising given the similar experiences that children in Westernized cultures are likely to have, regardless of their hearing status.
Finally, the characteristic decline in the number of items produced during the course of the minute was also observed in our data, with most items produced in the first 15 seconds and fewest items in last 15 seconds.
STUDY 2: CHILDREN WITH SLI
INTRODUCTION
We next tested semantic fluency in a group of deaf signing children who have SLI in their signing. We compared their performance to that of a subset of children from Study 1 matched for age and years of exposure, in order to investigate any differences in semantic fluency between typically developing signers and signers with SLI.
METHODS
Participants
Thirteen deaf signers (10 male), identified as having SLI in their acquisition of BSL by teacher report and follow-up testing with standardized tests of BSL, were recruited to the study. All had non-verbal abilities in the normal range as measured by the matrices, recall of designs and pattern construction subtests of the British Ability Scales 2nd edition (Elliott, Smith & McCullouch, Reference Elliot, Smith and McCullouch1996), yet scored at or below −1·3SD on the BSL Receptive Skills Test (Herman et al., Reference Herman, Holmes and Woll1999) and/or below the 10th percentile on one or more of the BSL Production Test subtests (Herman et al., Reference Herman, Grove, Holmes, Morgan, Sutherland and Woll2004). Aside from deafness and SLI, they had no additional recognized special needs other than teacher-reported difficulties with reading (N = 12), which is not unusual for deaf children (Conrad, Reference Conrad1979; Kyle & Harris, Reference Kyle and Harris2006). They ranged in age from 7 ; 5–14 ; 10, (mean 10 ; 9, SD = 2 ; 2). Background details for each of the SLI participants are shown in Table 5. Ten of these thirteen were participants in Mason et al.'s (Reference Mason, Rowley, Marshall, Atkinson, Herman, Woll and Morgan2010) study, and the additional three were selected according to the same criteria as those described in that study.
Background information for participants with SLI in Study 2

Thirteen control children (9 male) were selected from Study 1 and individually matched with SLI children to within + or – six months of age. The age range of the control group was 7 ; 6–14 ; 10 (mean = 10 ; 10, SD = 2 ; 2). The groups had similar experience of BSL: for the SLI group, years of exposure to BSL ranged from 3 ; 0–10 ; 4 (mean 6 ; 8, SD = 2 ; 1); for the control group, years of exposure ranged from 1 ; 6–11 ; 9 (mean 7 ; 5, SD = 3 ; 7). Two independent samples t-tests revealed no significant differences between the groups with respect to either age (t(24) = 0·106, p = 0·917) or years of BSL exposure (t(19·30) = 0·640, p = 0·528).Footnote 2 Note that the control children were selected before the data were coded, in order to avoid the risk of selection bias. Note also that this group contained N016, one of the children whose data could not be analyzed for Study 1 as she responded only to the ‘animals’ category.
PROCEDURE
The procedure for the deaf children with SLI was identical as for the children in Study 1.
RESULTS
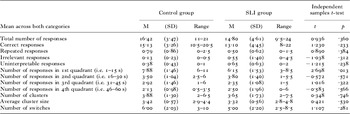
Two children with SLI did not understand the task and did not provide responses. One of these was the youngest, at 7 ; 5, but the other was older, at 10 ; 9. A third child did respond but refused to be filmed. As filming was essential for accurate glossing of the responses and for timing how many seconds into the minute they were produced, this child's data could not be used. We therefore present data from ten children with SLI, compared to the twelve remaining controls. Rerunning the t-tests to compare age and years of BSL exposure in these smaller groups revealed that the groups were still well matched for both measures (both ts <0·4). The data are averaged across both categories (i.e. ‘food’ and ‘animals’) and presented in Table 6.
Data for group of children with SLI and their age-matched controls

A set of t-tests was carried out to compare the two groups on the following measures: total number of responses, number of correct responses, number of incorrect responses (repetitions, irrelevant and uninterpretable responses), number of clusters, average cluster size, and the number of switches. None of these comparisons was significant (see Table 6).
We also compared the two groups' number of responses per quadrant of the minute, using a 4 (quadrant) × 2 (group) ANOVA. We found a significant interaction between group and quadrant (F(3, 60) = 4·35, p = 0·008, partial eta2 = 0·179). There was no main effect of group (F(1, 20) = 0·88, p = 0·360, partial eta2 = 0·042). The main effect of quadrant was strongly significant (F(3, 60) = 84·02, p < 0·001, partial eta2 = 0·808), reflecting a sharp decline in responses over the course of the minute.
To investigate the interaction, we conducted four independent samples t-tests comparing the two groups' performance in each quadrant, with the alpha level reduced to p = 0·013 in order to compensate for multiple comparisons (N = 4). As shown in Table 6, there is a significant difference between groups only for the first quadrant (t(20) = 2·698, p = 0·013). This difference is accounted for by the control group producing significantly more items in the first 15 seconds of the minute compared to the SLI group.
The interaction was further investigated with a set of paired samples t-tests for each group comparing items produced in successive quadrants, again with the alpha level reduced to p = 0·013. For the control group, there were significantly more responses for the first versus the second quadrant (t(11) = 8·742, p < 0·001), but the difference between the second and third quadrant did not reach significance (t(11) = 1·541, p = 0·152), and nor did the difference between the third and fourth quadrants (t(11) = 2·191, p = 0·051). The SLI group showed the same pattern as the controls over the course of the minute, with significantly more responses for the first versus the second quadrants (t(9) = 8·728, p < 0·001), and no significant difference between the second and third (t(10) = 2·795, p = 0·021), and the third and fourth (t(9) = −0·307, p = 0·766).
In an attempt to understand what might be driving fluency, we ran correlations to investigate whether the total number of responses and the number of responses in each of the four quadrants were related to performance on the only standardized test of BSL for which there was sufficient variance in the scores: the BSL Receptive Skills Test (Herman et al., Reference Herman, Holmes and Woll1999). The correlation with BSL Receptive Skills score was significant for the first quadrant (r(10) = 0·674, p = 0·033), but not (at the 2-tailed level) for overall number of items produced (r(10) = 0·578, p = 0·080), nor for the remaining three quadrants (r(10) = 0·456, p = 0·185; r(10) = 0·285, p = 0·425; and r(10) = 0·353, p = 0·318, respectively). Because we had BSL Receptive Skills scores for six of the controls, we added them to the sample, and reran the correlations. While the relationship between Receptive Skills performance and fluency in quadrants two to four remained not significant, for the first quadrant it remained significant (r(16) = 0·6662, p = 0·005), and was now also significant for the total number of items produced (r(16) = 0·645, p = 0·007). Correlations with such small group sizes have to be treated with caution, but they are consistent with the interpretation that children who are more fluent, particularly in the first fifteen seconds of the task, also have better BSL skills as measured by a sentence comprehension task.
Given the small numbers in the SLI group, it would be misleading to produce a list of the items produced by 33% or more of participants as we did for the children in Study 1. However, the five most common ‘food’ responses by children with SLI, APPLE, CHIPS, ORANGE, BANANA and CHICKEN, were all produced by more than 33% of the typically developing deaf children in Study 1, as were the top eight ‘animals’: CAT, DOG, ELEPHANT, RABBIT, COW, LION, MONKEY and TIGER.
Finally, it was observed that five children in the SLI group made types of errors that weren't found in the control group. One child, S019, fingerspelt EGG incorrectly as g-g-e-e, which could reflect uncertainty with the phonology of the fingerspelt form and/or the orthography of the English word. Four children evidenced word-finding difficulties, and made the following errors. Child S004 signed MOUSE IN WHEEL – YOU KNOW – (7 seconds later) HAMSTER! Child S027 signed ORANGE BUT NOT HORSE, and never found the correct sign for the animal she was searching for. Child S002 signed the letter S, and then the signs for DOG and WHISTLE. He was given credit for DOG, but presumably he was searching for SHEEPDOG. S003 created many compound signs which in some instances were acceptable (DOGFISH, CATFISH, GOLDFISH), but in other instances were not (REDBERRY, SEABIRD (not specific enough – SEAGULL would have been acceptable), SILVERFISH (as a fish, not an insect). There were no examples of any such word-finding behaviours in the control group.
GENERAL DISCUSSION
We carried out two studies of semantic fluency in children with typical and atypical sign language development. The task probes both the semantic organization of the lexicon and executive functions related to lexical retrieval. The aim of Study 1 was to investigate semantic fluency in typically developing deaf children, aged four to fifteen years. The aim of Study 2 was to compare the performance of children with SLI in BSL to a subset of the children in Study 1, matched for chronological age and years of exposure to BSL. Both groups of children produced the same characteristic ‘cognitive signatures’ as are reported for studies of semantic fluency in hearing children and adults, and in signing adults. These were: (i) a decline in the rate of production of new items over the course of the task; (ii) the production of items in semantically related bursts (‘clusters’); and (iii) production of more prototypical category members by a greater number of participants. It appears that, despite the difference in modality between signed and spoken languages, their lexicons are semantically organized in similar ways.
Although the task can be successfully completed by deaf children who are acquiring a signed language, it proved harder for certain participants: 2/22 children in Study 1, and 2/13 children with SLI in Study 2, were unable to understand the demands of the task, at ages four to ten years, and a further child in Study 1, aged nine, could only do the task for ‘animals’ and not for ‘food’. These are ages where no difficulties, as far as we are aware, have been reported for hearing children. For example, in Nelson's (Reference Nelson1974) study, all sixty-three children aged 4 ; 6–5 ; 7 were able to attempt ‘animals’, and in Nash and Snowling's (Reference Nash and Snowling2008) study all seventeen children aged 5 ; 6–9 ; 5 were able to respond to ‘animals’ and ‘food’. It is possible that the semantic fluency task is more demanding in BSL, perhaps linked to deaf children having smaller vocabularies. We also speculate that the metalinguistic nature of the task might be challenging for some deaf children, but that with some training they would be able to do it.
Nevertheless, for those participants (the majority) who did complete the task, the number of responses is within the range that has been reported for hearing children in a variety of spoken languages. This is despite our expectations of lower productivity given delayed BSL exposure for many of our participants. Presumably ‘foods’ and ‘animals’ are categories that contain enough early acquired items for deaf children of the age range tested here to be able to produce a similar number of items to hearing children. Very little age of acquisition data is available for ‘foods’ and ‘animals’ in BSL, so this is speculation, but it seems plausible. There is only one norming study of BSL with just twenty signers (Vinson, Cormier, Denmark, Schembri & Vigliocco, Reference Vinson, Cormier, Denmark, Schembri and Vigliocco2008), and it contains only nine food items (of which ICE CREAM is the earliest acquired, at 3·6 years), and eleven animals (of which DUCK and RABBIT are the earliest acquired at 4·5 years). The semantic task is therefore an appropriate one for use with deaf children who are learning a signed language.
There is nevertheless still room for development beyond the ages that we tested here; the two groups averaged around 15 or 16 items, but adults (Marshall et al.) averaged 23 or 24. Adults not only produce more clusters (an average of 6, compared to 3·9 and 3·7 for the control and SLI groups, respectively, in Study 2), but their clusters are a little larger, with a mean number of 3·8 per cluster (compared to 3·4 and 3·3 for the control and SLI groups). This indicates that there is development between childhood and adulthood in both the number of lexical items that signers are able to retrieve in these categories (as indexed by larger clusters), which is presumably linked to their larger vocabulary size, and in their ability to switch to new clusters in order to continue to retrieve items fluently (as indexed by the number of clusters produced). Given that in Study 1 productivity was very strongly related to the number of clusters rather than to cluster size, it would appear that the development of executive functions is the principal driver of improved performance on this task. Here, as throughout our analysis, we are struck by the comparability of our results compared to those reported for spoken languages: for example, Koren et al. (Reference Koren, Kofman and Berger2005) also found that cluster number rather than cluster size drives productivity in Hebrew. We further found that fluency, particularly in the first 15 seconds, is related to BSL skills as indexed by accuracy on the BSL Receptive Skills test (Herman et al., Reference Herman, Holmes and Woll1999). Unfortunately, there does not exist a standardized vocabulary test for BSL, but it seems likely that fluency is also related to vocabulary skills more generally.
The group of children with SLI in BSL did not differ from the control group on any measure related to the number of responses produced (whether correct or incorrect), types of responses, or to anything related to semantic clusters. We therefore conclude that there are no significant differences between the two groups in terms of the types of words that they know, the semantic organization of their lexicon, or executive functions related to word retrieval. We do of course recognize that this is only one particular semantic task, and other tasks (e.g. the word association task used by Sheng & McGregor, Reference Sheng and McGregor2010), might probe the organization of the lexicon in a different and perhaps more sensitive way. We also recognize that significant differences might come to light with a larger sample size, but the population of deaf children with SLI in a signed language is, by its very nature, small. Furthermore, the diagnosis of SLI in a signed language is tentative, as so far we are the only research team to investigate a group of deaf children with SLI: our results need to replicated by other teams, and in signed languages other than BSL.
Nevertheless, there are two ways in which the SLI group differed from their controls on the semantic fluency task: they produced significantly fewer responses in the first 15 seconds, and there were some examples of word-finding behaviours (although these were not frequent and not demonstrated by every child). We interpret both these differences as resulting from the same underlying cause, namely access to signs being slower in the SLI group. This could be due to slower access to the semantic component of the sign, or to less efficient mapping from the semantic to the phonological form, meaning that the phonological form of the sign is retrieved more slowly or not at all. Slow picture naming, even for successfully retrieved high-frequency words, has been reported in hearing children with SLI (Leonard, Nippold, Kail & Hale, Reference Leonard, Nippold, Kail and Hale1983). Kail has since taken this work further, and hypothesized that children with SLI have generalized slow processing across a range of linguistic and non-linguistic tasks (Kail, Reference Kail1994). Similarly, word-finding difficulties in hearing children with SLI were reported in some very early studies of the disorder (Menyuk, Reference Menyuk1975; Wiig, Semel & Nystrom, Reference Wiig, Semel and Nystrom1982). However, word-finding difficulties are not found in all children with SLI and there is debate over whether these reflect semantic or phonological impairments (Messer & Dockrell, Reference Messer and Dockrell2006; Sheng & McGregor, Reference Sheng and McGregor2010; inter alia).
Despite the subtle difficulties of the group of deaf signers with SLI on the semantic fluency task, their overall success on this particular word-level task contrasts with their very poor performance on sentence level tasks (Mason et al., Reference Mason, Rowley, Marshall, Atkinson, Herman, Woll and Morgan2010; Morgan et al., Reference Morgan, Herman and Woll2007) and narrative tasks (Mason et al., Reference Mason, Rowley, Marshall, Atkinson, Herman, Woll and Morgan2010; and data for ASL reported in Quinto-Pozos et al., Reference Quinto-Pozos, Forber-Pratt and Singleton2011). What emerges from these studies is that for children with SLI in a signed language, it may not be the acquisition of vocabulary that is challenging, but the acquisition of morphology, syntax and discourse-level language. Of course, it is also possible that the potentially slower lexical access we have identified in this study does affect morphosyntactic processing in deaf signers with SLI, but this is a question for future research. Research into SLI in signed languages is only just beginning, but we see that, at least at a broad level, it is remarkably similar to SLI in spoken languages.
APPENDIX
An example of the coding: Participant N021, category ‘animals’