Introduction
Intraspecific and interspecific variation is a key concept within the field of biology, and skeletal variation within and between taxa can come from a variety of sources. In modern taxa, shape can be separated into symmetric and asymmetric variation. All organisms that display bilateral symmetry have some degree of asymmetry as a result of normal, nonpathological developmental instability, which leads to deviations from symmetry. This asymmetry encompasses fluctuating asymmetry, the random left–right deviations from symmetry among individuals, and directional asymmetry, the consistent difference in shape between the two sides of the body, such as would be present in athletes that predominantly use one arm. However, the magnitude of asymmetry is typically small in bilaterally symmetric organisms due to developmental stability—the ability of an organism to buffer against developmental noise—and to the effects of canalization—the ability of a population to produce the same phenotype regardless of environmental factors (Mardia et al. Reference Mardia, Bookstein and Moreton2000; Klingenberg et al. Reference Klingenberg, Barluenga and Meyer2002; Leamy and Klingenberg Reference Leamy and Klingenberg2005; Willmore et al. Reference Willmore, Klingenberg and Hallgrímsson2005; Dongen Reference Dongen2006). Typically, asymmetric variation is considered a nuisance parameter and may be factored out of analyses examining the relationship between shape and functional morphology (e.g., Zelditch et al. Reference Zelditch, Wood, Bonett and Swiderski2008). The relative magnitude of asymmetric variation is generally small in extant taxa (<10% of total variation), and few analyses have examined the effects of asymmetry and its relationship to function (Swaddle Reference Swaddle2003). Hypotheses as to why asymmetry would be low relate to sexual selection (Møller and Thornhill Reference Møller and Thornhill1998) and decreased functionality (Galleoti and Sacchi 2005; Rivera and Claude Reference Rivera and Claude2008; Rivera and Stayton Reference Rivera and Stayton2013).
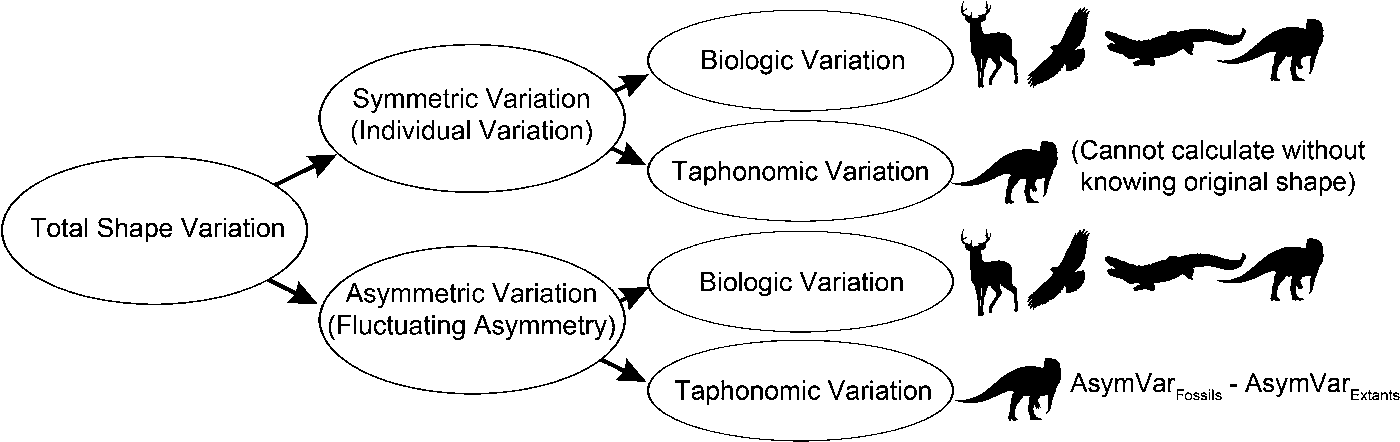
As for modern taxa, shape in fossil taxa can be subdivided into symmetric and asymmetric variation; however, both of these sources of variation can further be divided into biologic variation and variation generated by taphonomic distortion (Fig. 1). Because taphonomic processes are central to the fossilization process, the relationship between fossils and taphonomy is somewhat inextricable. In one extreme case of mistaking taphonomic variation for original biologic variation, 462 named bivalve species were synonymized into only 62 species after accounting for the impacts of taphonomic distortion on many specimens (Fank Reference Fank1929; Cooper Reference Cooper1990). Researchers have long attempted to circumvent the confounding issue of taphonomic distortion, most recently through retrodeformation techniques (e.g., Motani Reference Motani1997; Angielczyk and Sheets Reference Angielczyk and Sheets2007). Skeletal asymmetry is a potentially useful measure of taphonomic distortion, and it has long been recognized that strong departures from symmetry are indicators of deformation (White Reference White2003).
Flowchart showing how total variation was broken up in the study into symmetric (measured by individual variation), asymmetric (measured by fluctuating asymmetry), biologic, and taphonomic variation.

Geometric morphometrics (GM) is a powerful quantitative tool for the analysis of organismal shape and has largely supplanted more traditional morphometric techniques based on linear measurements (Zelditch et al. Reference Zelditch, Swiderski, Sheets and Fink2012; Schmieder et al. Reference Schmieder, Benítez, Borissov and Fruciano2015). Paleobiologists have embraced GM as a method for quantitatively comparing morphologies through landmark configurations, with studies ranging from the evolution of form and function (e.g., Pierce et al. Reference Brusatte, Sakamoto, Montanari and Harcourt Smith2009; Brusatte et al. Reference Maiorino, Farke, Kotsakis and Piras2012; Foth et al. Reference Foth, Hedrick and Ezcurra2016) to the testing of phylogenetic hypotheses (e.g., Hedrick and Dodson Reference Hedrick and Dodson2013; Maiorino et al. Reference Maiorino, Farke, Kotsakis and Piras2013). Given that fossils are all subject to some degree of taphonomic distortion, it is critical that the amount of variation attributable to taphonomy is quantified to better understand how nonbiologic taphonomic distortion impacts GM results. Even so, there have been few attempts to evaluate distortion quantitatively (Arbour and Currie Reference Arbour and Currie2012; Hedrick and Dodson Reference Hedrick and Dodson2013; Tschopp et al. Reference Tschopp, Russo and Dzemski2013; Baert et al. Reference Baert, Burns and Currie2014), and only a handful of studies have examined the effects of distortion in the context of GM data (e.g., Angielczyk and Sheets Reference Angielczyk and Sheets2007; Hedrick and Dodson Reference Hedrick and Dodson2013).
Although all organisms display asymmetry, taphonomic distortion can potentially increase asymmetry by affecting different sides of a fossil in nonhomogenous ways. Thus, if there were no taphonomic shape distortion of a fossil specimen, the degree of fluctuating asymmetry measured for any particular fossil specimen should be relatively low, as expected for extant forms. To estimate the magnitude of the impact of taphonomic distortion on fossil morphology, we used GM to quantify effect sizes of symmetric and asymmetric variation in a sample of the fossil dinosaur Psittacosaurus lujiatunensis, for which a large number of complete and relatively undistorted specimens exist (for a review, see Sereno Reference Sereno, Ryan, Chinnery-Allgeier and Eberth2010), and compared this with three extant taxa: the American alligator (Alligator mississippiensis), the white-tailed deer (Odocoileus virginianus), and the red-tailed hawk (Buteo jamaicensis).
Using these data, we sought to answer three primary questions: (1) Is the magnitude of fluctuating asymmetry significantly higher in fossil specimens than in extant specimens? (2) After the asymmetric component of variation is removed from comparative data, how much biologically relevant variation––nontaphonomically-derived variation estimated by the total symmetric component of variation––remains in fossil taxa? (3) Do bones with different gross morphologies (e.g., flat vs. columnar) deform similarly or are they differentially affected by taphonomic distortion?
We predicted that the fossil specimens would have significantly higher fluctuating asymmetry as a result of taphonomic distortion, but given past successful application of GM on fossils, a substantial amount of biologic information would remain after removing the asymmetric component of variation. We also predicted that robust, columnar fossils such as the femur and humerus would show less fluctuating asymmetry than flat bones such as the scapula and ilium, potentially leading to bone-specific corrections for taphonomic distortion. The difference in the effect size of fluctuating asymmetry in the fossil and extant specimens provides a conservative estimate for the amount of variation attributable to taphonomic distortion in an intraspecific sample. Our results suggest that shape studies incorporating fossils may have a substantial amount of noise that could potentially reduce the statistical power to detect trends or result in identifying false trends, although a considerable amount of biologic variation remains when asymmetry is removed. This is the first study to assess what magnitude of total shape variation in a given fossil data set might be attributable to taphonomy.
Materials and Methods
Sampling
To determine the asymmetric component of morphological variation within a taxon, it is necessary to obtain a suitably high within-species sample size. Therefore, we focused on four species of terrestrial vertebrates for measuring differences in fluctuating asymmetry between fossil and extant organisms. For our fossil representative, a small ceratopsian (horned) dinosaur from China was chosen, Psittacosaurus lujiatunensis. Psittacosaurus is known from more than 100 specimens, many of which are nearly complete (Sereno Reference Sereno, Ryan, Chinnery-Allgeier and Eberth2010), facilitating the generation of a robust data set for quantifying within-species fluctuating asymmetry in a fossil taxon. Three extant taxa were also chosen for comparison with our fossil data set, including A. mississippiensis and B. jamaicensis, which together bracket the Dinosauria phylogenetically (Witmer Reference Witmer and Thomason1995). Odocoileus virginianus was also included as a functional analogue to the facultatively bipedal or quadrupedal, deer-sized Psittacosaurus (Maidment and Barrett Reference Maidment and Barrett2012; Zhao et al. Reference Zhao, Benton, Sullivan, Sander and Xing2013).
Four appendicular bones were analyzed: the scapula, ilium, humerus, and femur. Postcranial material was chosen for this study rather than skulls for the following reasons: (1) skulls are full of open spaces, making them prone to damage; (2) skulls are variably kinetic or akinetic ontogenetically and phylogenetically, potentially leading to bone being out of place; and (3) limb and girdle bones have a simple geometry, making it easier to determine whether they have undergone brittle deformation.
Geometric Morphometrics
Two-dimensional GM was used to characterize both symmetric and asymmetric components of shape variation. The Psittacosaurus variation was further subdivided into symmetric biologic, symmetric taphonomic, asymmetric biologic, and asymmetric taphonomic variation (Fig. 1). Biologic shape was defined as the original shape that the organism showed in life, whereas the taphonomic shape component represents modifications to biologic shape that result from taphonomic processes. This included both brittle (open cracks and breaks) and plastic deformation (deformation without fracture), which each contribute to symmetric and asymmetric taphonomic variation. Our study focused on plastic deformation, as the fossils sampled have limited breakage. Plastic deformation is less obvious than brittle deformation and thus more commonly ignored in paleobiological studies. We further focused on asymmetric taphonomic variation. Without undeformed samples, it is not possible to analyze symmetric taphonomic variation, and what constitutes “undeformed” is often subjective (Arbour and Currie Reference Arbour and Currie2012).
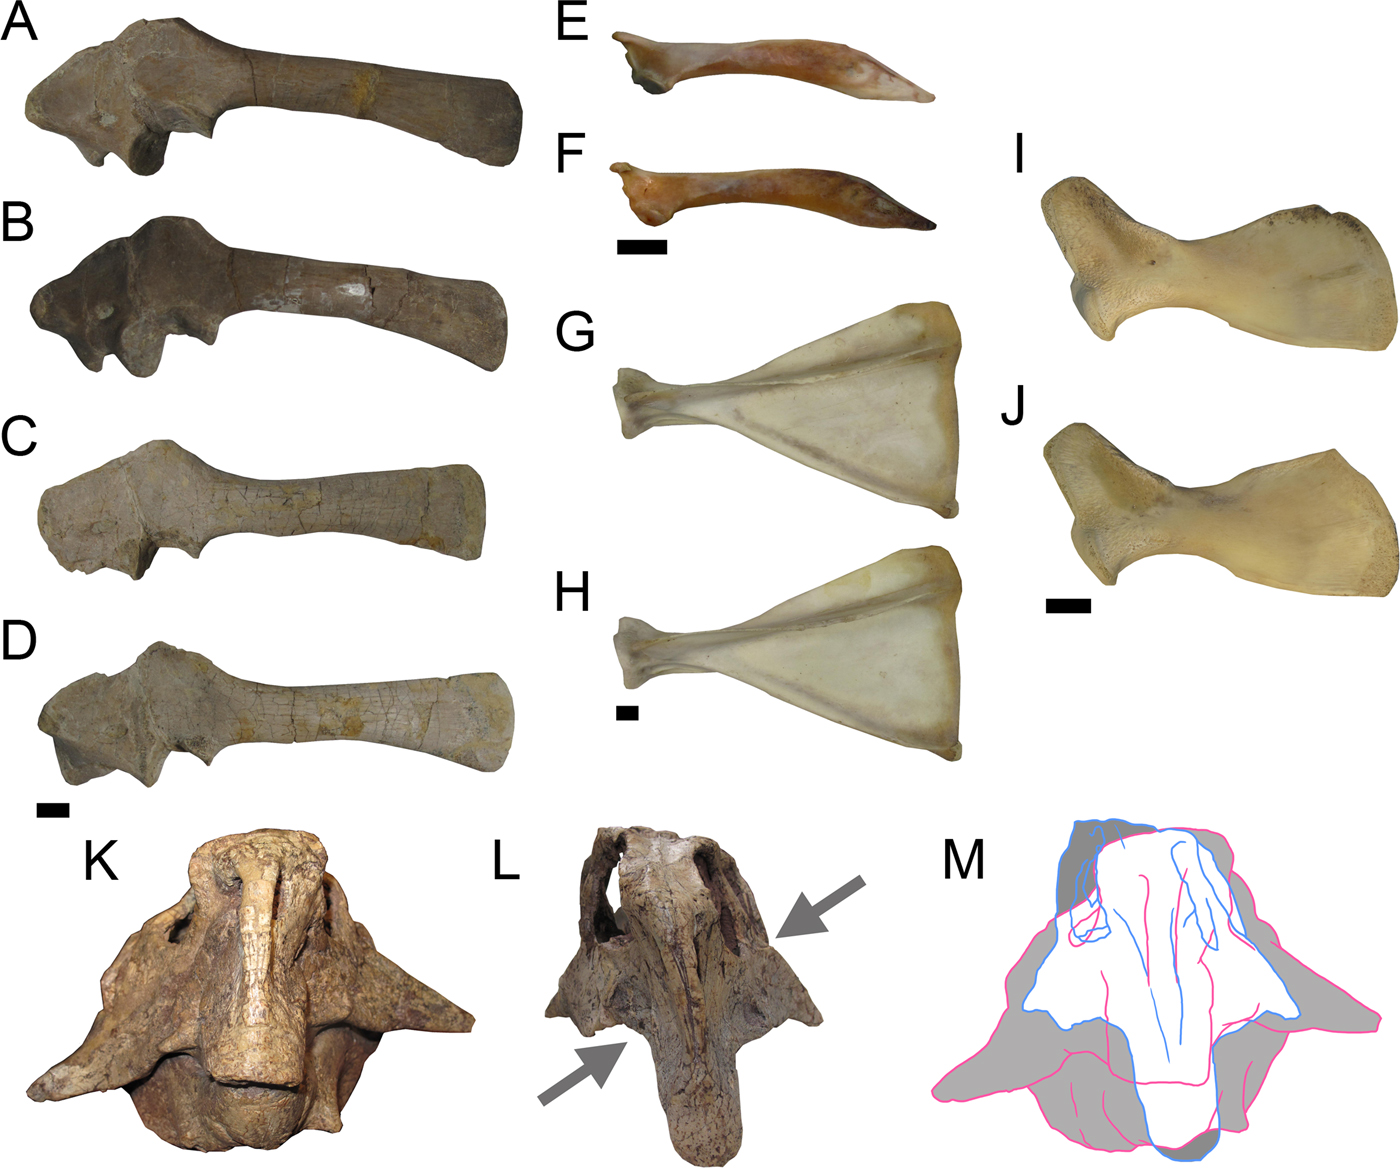
Specimens were photographed using a Canon Powershot G10 digital camera mounted on a camera stand. Landmarking was performed in the TPSDig2 software (Rohlf Reference Rohlf2006). To include measurement error in our models, each bone was landmarked three times (set 1, set 2, set 3) for a total 5970 individual images analyzed. For each data set (e.g., Psittacosaurus scapulae), each of the three sets was landmarked on three consecutive days to ensure intra-observer landmarking error was captured. The majority of landmark data were collected or checked by B.P.H. to minimize interobserver error. Digitizing three-dimensional objects such as bones in two dimensions only allows for data capture in a single plane, so long bones that have a more complex 3D geometry were digitized in multiple views, while relatively simple flat bones were digitized in a single view. The scapula and ilium were sampled in lateral view; the humerus in cranial, medial, and caudal views; and the femur in cranial and caudal views (Fig. 2, Supplementary Figs. S1–S4, Supplementary Tables S1, S2).
Example paired scapulae showing the amount of visible asymmetry seen in the fossil specimens (Psittacosaurus lujiatunensis [A, B, C, D]) in comparison with the extant specimens (Buteo jamaicensis–red-tailed hawk [E, F], Odocoileus virginianus–white-tailed deer [G, H], Alligator mississippiensis–American alligator [I, J]). Scale bars, 5 cm. To demonstrate the levels of asymmetry present in Psittacosaurus, we show the holotype specimen of P. lujiatunensis (K), which is relatively undistorted in comparison with the paratype (L), which is highly bilaterally distorted, as well as the two specimens overlain graphically (M).

Landmark configurations were generated through general Procrustes analysis in R v. 3.3.3 (R Core Team 2017) using the ‘geomorph’ package (Adams and Otárola-Castillo Reference Adams and Otárola-Castillo2013), which removes all non-shape information through the processes of translation, rescaling, and rotation (Zelditch et al. Reference Zelditch, Swiderski, Sheets and Fink2012). Sliding semi-landmarks were repositioned along their curves using the bending energy criterion (Perez et al. Reference Perez, Bernal and Gonzalez2006).
Fluctuating Asymmetry
Asymmetry was quantified using a multifactor Procrustes analysis of variance (Klingenberg and McIntyre Reference Klingenberg and McIntyre1998) with individuals (individual variation), sides (directional asymmetry), and their interaction (fluctuating asymmetry) used as factors. Directional asymmetry is the average difference between the two sides of the body, while fluctuating asymmetry is the random left–right differences among individuals. The fluctuating asymmetry component of total variation thus contains asymmetric biologic variation as well as asymmetric taphonomic variation in fossils, while the individual variation component contains symmetric biologic variation and symmetric taphonomic variation in fossils. Directional asymmetry was low in all cases and is not discussed further within this study (Supplementary Table S3).
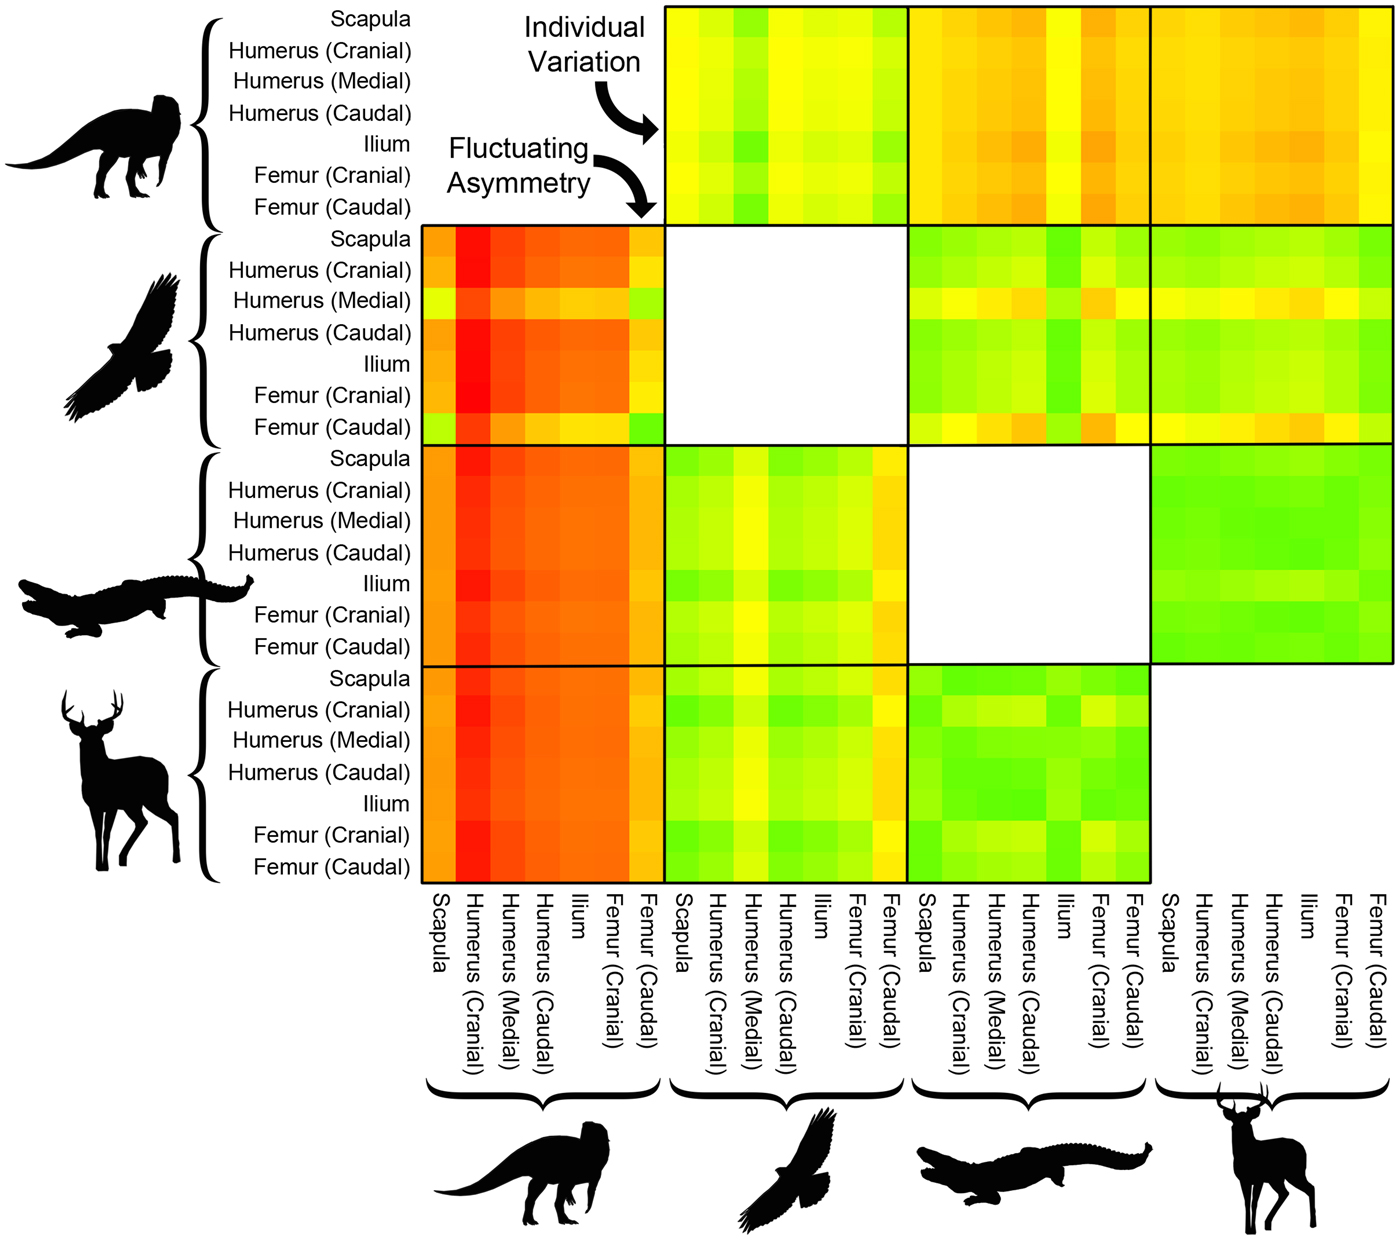
Effect size was calculated for each of our factors in each element using the η2 effect size metric, which gives a percent of overall variation explained by each factor (Olejnik and Algina Reference Olejnik and Algina2003). To evaluate whether the magnitude of asymmetric variation was higher in the fossil taxon and comparable across modern taxa (question 1), we statistically compared effect sizes of fluctuating asymmetry and individual variation. Statistical significance was assessed in the proportion of total variance explained by both fluctuating asymmetry and individual variation (effect size) for the four taxa using a general linear model pooling all elements for a given taxon into a single group using the F-test statistic at a significance threshold of α = 0.05. This allowed determination of whether Psittacosaurus had significantly higher fluctuating asymmetry than the extant taxa. To compare taphonomically relevant and biologically relevant shape data in Psittacosaurus with those of the modern taxa (question 2), we quantified the taphonomic input in Psittacosaurus by subtracting the magnitudes of asymmetry in modern taxa from the magnitudes of asymmetry in Psittacosaurus. The difference in asymmetry levels here was interpreted as the taphonomic component of asymmetric variation (Fig. 1). We also subtracted the levels of symmetric variation in Psittacosaurus from those of the modern taxa to show the degree to which more biologically relevant shape data were present in modern taxa than in Psittacosaurus. These differences were visualized for all elements (e.g., scapula of Psittacosaurus and scapula of Buteo) as a heat map.
To further assess how asymmetric taphonomic variation affected total shape trends in Psittacosaurus, principal component analyses (PCAs) were run for each data set, including all of our data (three replicates of both sides all plotted as individual points) to visualize how far away the right and left sides of the same individual plotted in morphospace and the impact of measurement error in morphospace. The symmetric and asymmetric components of shape variation were separated using the bilat.symmetry function in ‘geomorph’ (Adams and Otárola-Castillo Reference Adams and Otárola-Castillo2013). PCAs were also run for the symmetric component of variation independent of the asymmetric component using the ‘geomorph’ package to evaluate whether broad morphospace trends changed when the asymmetric component of variation was removed.
Finally, to determine whether bones with different gross morphologies (columnar bones vs. flat bones) deformed in different, potentially predictable ways (question 3), the effect sizes of fluctuating asymmetry of Psittacosaurus columnar bones (humeri and femora) were compared with those of flat bones (scapulae and ilia). Modern taxa were not considered here, given that they did not undergo taphonomic deformation. This was done qualitatively due to unbalanced sample sizes and relatively low sample sizes in the Psittacosaurus data set.
Results
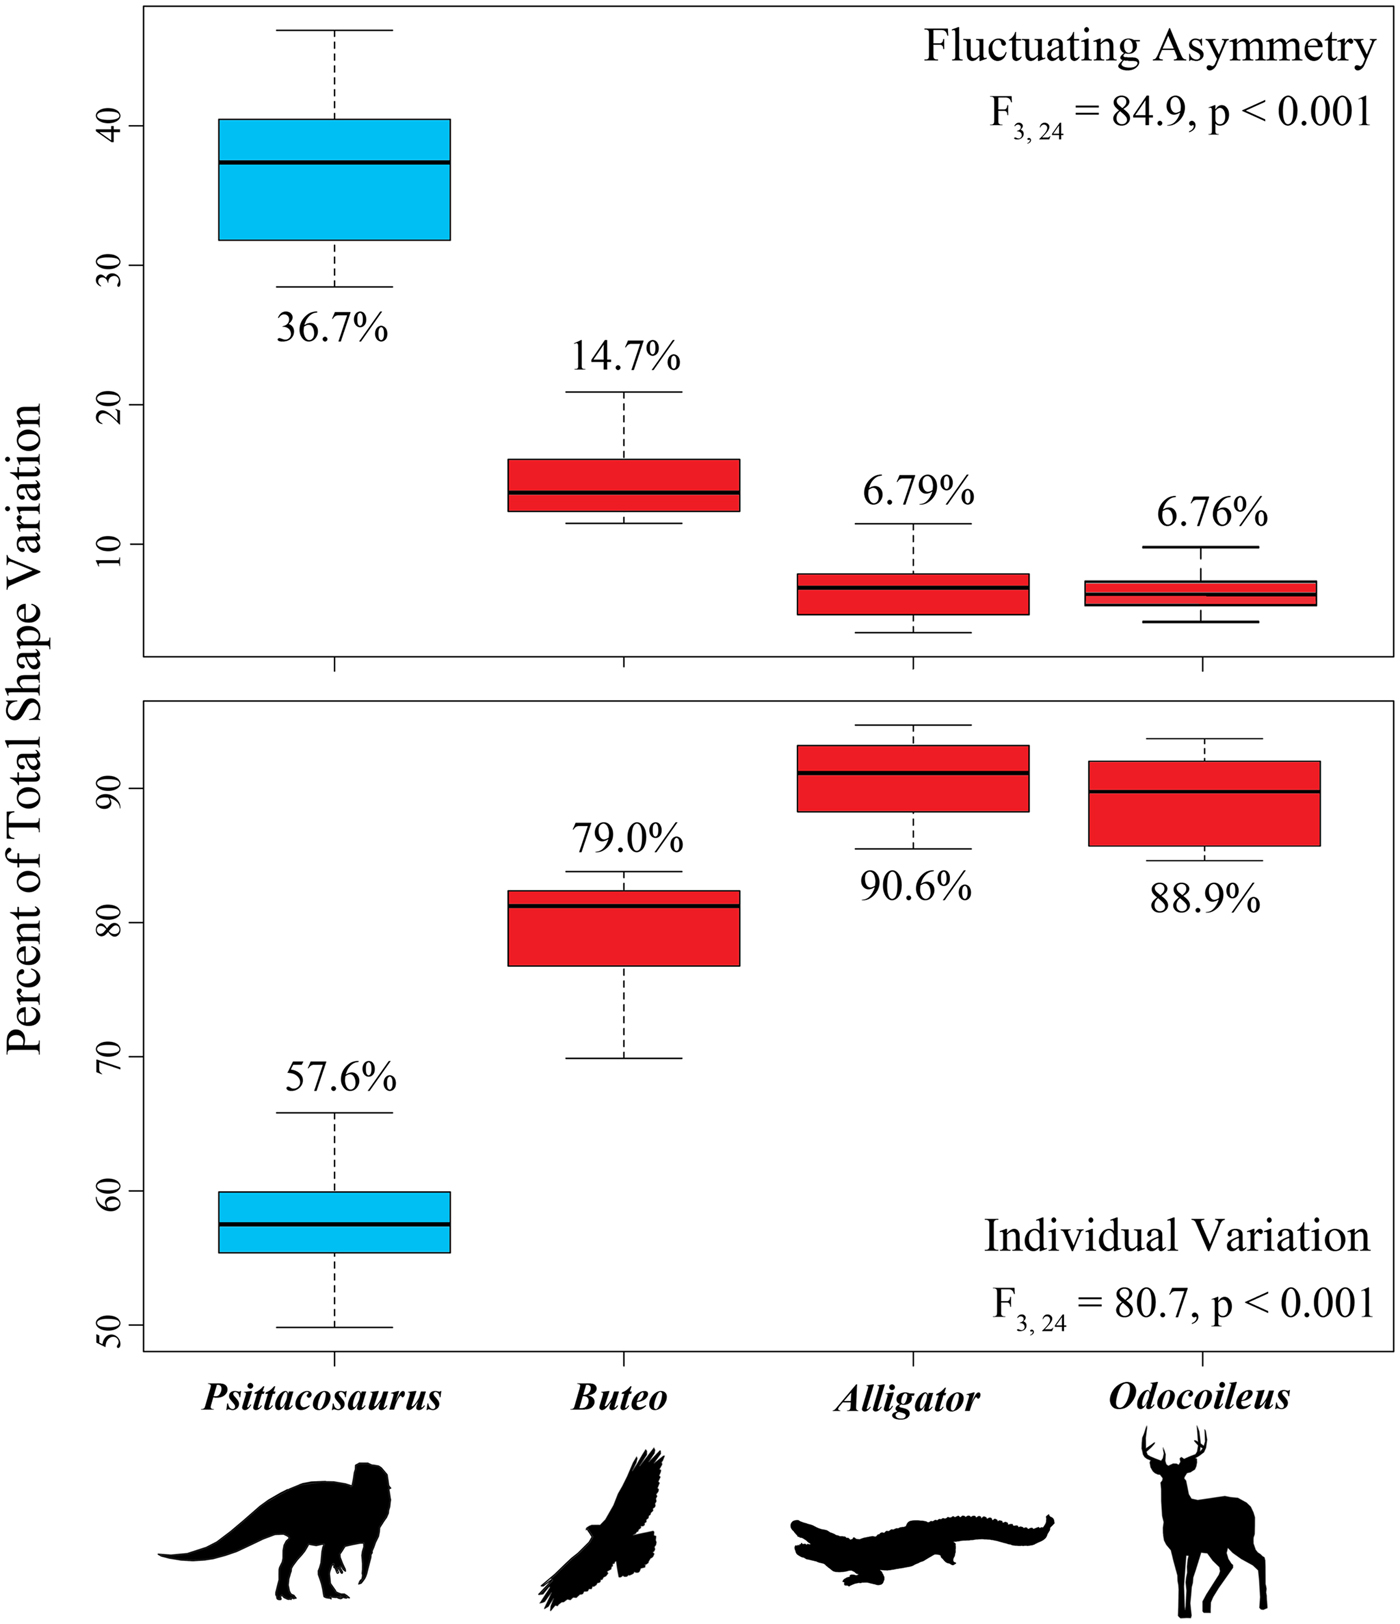
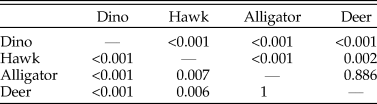
Fluctuating asymmetry accounted for an average of 36.7% of the total variation for Psittacosaurus when pooling all bones together. This ranged from 28.45% for the ilia to 46.85% for the humeri in cranial view. This was significantly higher than the averages for B. jamaicensis (14.7%), A. mississippiensis (6.79%), and O. virginianus (6.76%) (Fig. 3, Table 1), addressing question 1. Fluctuating asymmetry explained a significantly higher percent of total variation in Buteo than Alligator and Odocoileus, which were not significantly different from one another. These results are mirrored when looking at the percent of total variation explained by individual variation with only 57.6% of total variation being explained by individual variation in Psittacosaurus in comparison with 79% in Buteo, 90.6% in Alligator, and 88.9% in Odocoileus (Fig. 3).
Box plots showing the relative percent of fluctuating asymmetry (top) and individual variation (bottom) for each taxon. All bones (scapulae, humeri, ilia, femora) for each taxon were included in the box plot, and average fluctuating asymmetry of these bones is included next to the corresponding taxon. Psittacosaurus had a significantly higher fluctuating asymmetry component of total shape variation and a significantly lower individual variation component of total shape variation due to taphonomy.

Pairwise comparisons between taxa for fluctuating asymmetry (below the diagonal) and individual variation (above the diagonal). The Psittacosaurus (Dino) and Buteo (Hawk) data sets were significantly different from the Alligator (Alligator) and Odocoileus (Deer) data sets, which were not significantly different from one another.

Differences in the effect size of fluctuating asymmetry for each bone were much higher when comparing Psittacosaurus and any modern taxon than between any two extant taxa (Fig. 4). Note that the values calculated for Psittacosaurus represent asymmetric taphonomic variation (difference of modern taxon asymmetry and fossil taxon asymmetry), while these values for extant taxa represent differences in levels of biologic asymmetry. Levels of asymmetric variation in Psittacosaurus were a minimum 8% higher than asymmetric variation in modern taxa (comparison between the Psittacosaurus ilium and Buteo humerus in medial view), a maximum of 43% higher (comparison between Psittacosaurus humerus in cranial view and Alligator femur in cranial view) and were on average 27% higher across all bones studied (see Supplementary Table S4 for all comparisons). This demonstrated that the Psittacosaurus had much higher levels of asymmetry and, as a result, less biologically relevant shape information than modern taxa, addressing question 2.
Heat map demonstrating the relative difference in the percent of total variation explained by fluctuating asymmetry (below the diagonal) and individual variation (above the diagonal) for each taxon by bone. Warmer colors indicate higher differences in values and cooler colors indicate lower differences in values. The difference in fluctuating asymmetry between Psittacosaurus and the extant taxa represents the estimate of the taphonomic component of asymmetry. Psittacosaurus is very red, reflecting its large difference in fluctuating asymmetry relative to extant taxa as a result of taphonomic shape change. Differences in asymmetry between extant taxa are based only on biologically derived asymmetry. The differences in individual variation visualize the amount of biologic variation present in the data after removing asymmetry and estimated using the total symmetric component of variation. Psittacosaurus has lower levels of symmetric variation relative to its total variation in comparison with extant taxa as a result of taphonomy. Particularly asymmetric bones among some extant taxa (e.g., Buteo humerus in medial view and femur in caudal view) are also relatively red.

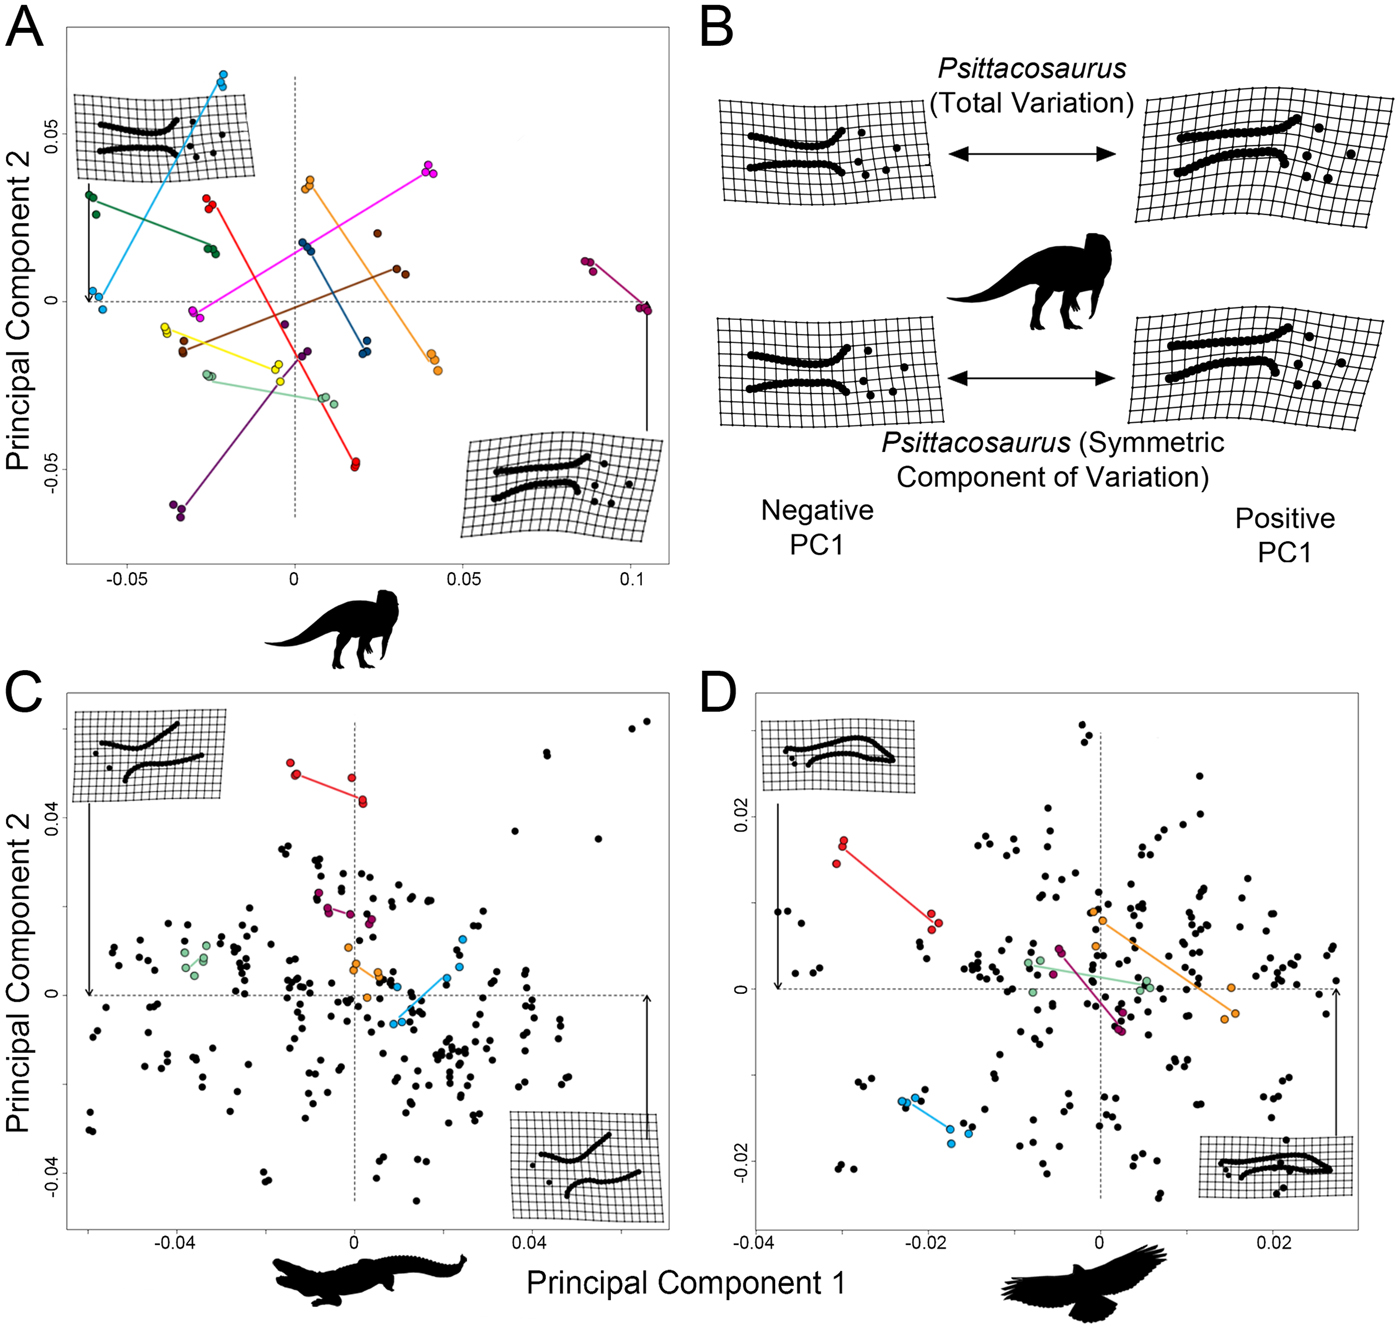
When the total shape variation was plotted in PCA morphospace, in many cases the left and right sides of the same Psittacosaurus specimen plotted on opposite sides of morphospace (Fig. 5A; see Supplementary Tables S5–S8 for PC loadings and scores). While the left and right sides of the extant taxa did not plot directly on top of one another, they plotted in the same general region of morphospace and did not strongly deviate from one another in shape. They often plotted nearly as close to one another as they do to replicates of the same measurement (Fig. 5C,D). This reflects the fact that the asymmetric biologic variation in extant taxa only accounts for slightly more of the total variation than the measurement error component of total variance, whereas the combination of asymmetric biologic and taphonomic variation in Psittacosaurus strongly impacts positioning in shape space.
Principal component (PC) analysis of scapulae showing the relative divergence between left and right scapulae in morphospace for Psittacosaurus (A), Alligator (C), and Buteo (D). Each individual is colored differently and has a line connecting the right and left scapulae for Psittacosaurus, and five specimens are given for the extant taxa, which were randomly selected. Bones were measured three times each for inclusion in the error analysis, so one animal is made up of six individual points, three for the right scapula and three for the left. Note that the left and right scapulae of Psittacosaurus often plot on opposite sides of morphospace. To identify how shape trends were affected by removing the asymmetric component of variation, we plotted thin-plate splines of the symmetric component of variation for Psittacosaurus next to thin-plate splines for the total variation (B).

After removing the asymmetric component of variance from the Psittacosaurus data and re-running a PCA on only the symmetric component of variance, we found only minimal changes in the principal directions of shape change (Fig. 5B). This is in spite of the asymmetric taphonomic component of variation accounting for an average of 27% of total shape variation in the Psittacosaurus sample (and an average of 25% for the scapula; Fig. 5). When PCA was performed for all variation in the Psittacosaurus data set (symmetric and asymmetric components), the first PC described changes from specimens with a somewhat dorsally curved scapula (negative PC 1) to a scapula with a relatively ventrally curved scapula (positive PC 1) (Fig. 5B). Performing a PCA on only the symmetric component of shape variation, which accounted for only 62.2% of the total variance in the case of psittacosaur scapulae, left shape trends along PC1 mostly unchanged (see Supplementary Figs. S5–S10 for comparisons of additional bones).
To evaluate whether columnar and flat bones deformed to similar degrees or were impacted by taphonomy in different ways (question 3), the average effect size of fluctuating asymmetry was calculated for each Psittacosaurus bone. Bones with multiple views (humerus, femur) had those views pooled. An average of 42.6% of total variation was summarized by asymmetry in the humerus, and the averages for the femur, scapula, and ilium were 33.3%, 34.4%, and 28.5% respectively (Supplementary Table S9). The relative values do not change substantially when restricting the asymmetric component only to the asymmetric taphonomic component of variation (humerus: 33.2%; femur: 23.9%; scapula: 24.9%; ilium: 19%).
Discussion
Impact of Taphonomic Distortion on Morphological Variation
Taphonomic distortion affects all fossil specimens to some degree and thus effectively pervades all results in paleobiological research and has a direct impact on all studies investigating the morphology and evolution of extinct species. With increased usage of GM for quantification of intra- and interspecific variation in skeletal morphology, it is critical that we understand how much of total shape change can be directly attributed to taphonomic distortion. Even minor anatomical errors derived from taphonomic distortion may be amplified and potentially propagated by future researchers if a selected trait were to be considered notable (Angielczyk and Sheets Reference Angielczyk and Sheets2007). We present a new method for calculating the asymmetric component of taphonomic distortion, using the difference in the effect size of asymmetric variation between a fossil taxon (which has a combination of asymmetric biologic and asymmetric taphonomic variation) and extant taxa (which have only asymmetric biologic variation). This provides a conservative estimate of how much of total shape variation in fossils can be attributed to taphonomy.
The magnitude of total asymmetric variation in the fossil taxon, Psittacosaurus, was significantly higher than in extant taxa (p < 0.001), with fluctuating asymmetry accounting for an average of 36.7% of total shape variation in the fossil taxon (Fig. 3). The asymmetric taphonomic component in Psittacosaurus accounted for an average of 27% of total variation across all bones, with the highest asymmetric taphonomic component of variation being in the humerus in cranial view (>37%). Likewise, only 57.6% of total variation (averaged across all bones) in Psittacosaurus could be attributed to individual variation, which constitutes the symmetric component of biologic and taphonomic variation. Symmetric taphonomic variation cannot be quantified without knowing the original biologic shape, which is not possible for many fossils, especially those with distant or no extant representatives (Ogihara et al. Reference Ogihara, Nakatsukasa, Nakano and Ishida2006; Arbour and Currie Reference Arbour and Currie2012). Therefore, although our estimate for taphonomic shape variation is upward of 27%, this is a conservative estimate given the unknown amount of symmetric taphonomic variation present in the data.
Eliminating the asymmetric component led to minimal changes in the principal directions of shape change in morphospace (Fig. 5A,B). The reasoning for this is unclear, but it could mean that either (1) the underlying biologic trends are strong enough to drive the principal directions of shape change irrespective of asymmetric taphonomic distortion or (2) symmetrizing data are inadequate for restoring fossil shape due to the confounding effects of the symmetric taphonomic component of variation. In this case, the symmetric taphonomic component may symmetrically mirror the types of shape change caused by asymmetric deformation, which is reflected in the principal axis of shape change along the symmetric component. The second possibility has been supported by a number of studies that manually distorted specimens and then failed when attempting to reestablish the original shape through symmetrization (Angielczyk and Sheets Reference Angielczyk and Sheets2007; Tschopp et al. Reference Tschopp, Russo and Dzemski2013).
Correcting for Taphonomic Asymmetry
Retrodeformation, techniques that employ computer-generated images to attempt to correct fossil shape by removing taphonomic input, has been commonly used for phylogenetic, systematic, and comparative studies. These techniques typically assume that the original specimen was symmetric and that deformation was homogenous (Cooper Reference Cooper1990; Motani Reference Motani1997; Hughes and Jell Reference Hughes and Jell1992; Ogihara et al. Reference Ogihara, Nakatsukasa, Nakano and Ishida2006). However, when these techniques have been applied to samples that have a known original shape, many have proven to be subjective (Boyd and Motani Reference Boyd and Motani2008; Tschopp et al. Reference Tschopp, Russo and Dzemski2013), and it has long been known that homogenous, linear deformation is likely not a realistic assumption in taphonomically distorted specimens (Ramsay and Huber Reference Ramsay and Huber1983; Davis and Reynolds Reference Davis and Reynolds1996). One central issue with retrodeformation is that the goal of many of these techniques is to reinstitute symmetry (Motani Reference Motani1997; Ogihara et al. Reference Ogihara, Nakatsukasa, Nakano and Ishida2006), which has been shown to increase compression-based deformation (Tschopp et al. Reference Tschopp, Russo and Dzemski2013). Further, certain retrodeformation techniques may generate multiple, different symmetric shapes (Boyd and Motani Reference Boyd and Motani2008). Symmetrization has an additional limitation in that it is difficult to apply to structures that have matching symmetry (such as right and left arms) rather than object symmetry (single structure symmetric about a midline). Fossil limbs or girdle elements undergo taphonomic distortion and are often found as singular elements without their corresponding contralateral paired component. No current retrodeformation techniques have attempted to account for this issue.
Rather than attempt to generate a single set of corrections, as is done in retrodeformation studies, in the present study we split our bones into two groups: flat (scapula and ilium) and more robust, columnar bones (humerus and femur). This allowed us to assess whether these two bone types generated similar levels of asymmetric distortion or whether one bone type showed higher asymmetric distortion, possibly allowing bone type–specific corrections. Contrary to our hypothesis, we found no evidence that columnar bones were less distorted than flat bones. In our Psittacosaurus sample, the humerus had the largest effect size of asymmetry (42.6% of total variation), whereas the other bones had lower, similar effect sizes (scapula: 34.37%; ilium: 28.45%; femur: 33.3%). This underscores the fact that deformation impacts different bones in different and complex ways and that one retrodeformation technique used in the same way cannot be applied to every sample in a data set (Angielczyk and Sheets Reference Angielczyk and Sheets2007; Gunz et al. Reference Gunz, Mitteroecker, Neubauer, Weber and Bookstein2009).
Differences in bone size may also affect distortion due to either ontogenetic or phylogenetic allometry, drastically affecting bone robusticity. All of the Psittacosaurus elements in this study were roughly of the same length within individuals, and therefore we were unable to test hypotheses related to different sizes, but future studies could easily do this by applying our methods to extinct taxa of widely ranging sizes (e.g., Tyrannosaurus and Microraptor). Similarly, differences in bony complexity would be likely to increase perceived taphonomic input. Tschopp et al. (Reference Tschopp, Russo and Dzemski2013) found that vertebral ratios taken perpendicular to one another were more strongly affected by deformation than ratios of measurements taken on parallel structures, because parallel structures will deform in a similar manner, whereas perpendicular structures will be more likely to deform in different ways. More complex bones such as skull bones with thin, elongate prominences and ridges directed in multiple, nonparallel directions would conceivably be more likely to deform than robust limb bones. Our data suggest that even ridges on limb bones that are perpendicular to the long axis of the bone, such as the deltopectoral crest, are likely to deform relative to other more robust structures in the same bone. It is possible that the higher effect sizes found for the humerus are related to the deltopectoral crest, which was strongly distorted in many of the samples. It is becoming clear that multiple bone-specific corrections may be required, and based on this study, simple corrections relating to bone type (e.g., columnar vs. flat) will not work.
Asymmetry Comparisons across Three Extant Classes of Vertebrates
An unexpected result of this analysis was that Buteo had significantly higher asymmetry in all of its limb bones than its extant counterparts, Alligator and Odocoileus (Fig. 3). A likely relationship between asymmetry and sexual selection exists among a variety of animal groups (e.g., Møller and Thornhill Reference Møller and Thornhill1998) and it is clear that birds such as European starlings are capable of distinguishing asymmetry when it is sufficiently large (Swaddle and Johnson Reference Swaddle and Johnson2007). A number of studies have also argued that asymmetry should be selected against when it has the potential to negatively impact performance (Galeotti et al. Reference Galeotti, Sacchi and Vicario2005; Rivera and Claude Reference Rivera and Claude2008; Rivera and Stayton Reference Rivera and Stayton2013). Balmford et al. (Reference Balmford, Jones and Thomas1993) found that wing and tail fluctuating asymmetry in birds were both constrained by natural selection and that birds that rely more on flight had more symmetric wings, suggesting that fluctuating asymmetry has an aerodynamic cost. This was also found through computer modeling of locomotion (Bongard and Paul Reference Bongard and Paul2000). Red-tailed hawks do not have extreme sexual dimorphism, and their courtship is based on flight displays, suggesting that in their case, natural selection would impact asymmetry more strongly than sexual selection. Given that red-tailed hawks rely on their wings for flight and their hind limbs for prey capture, it would be expected that their levels of fluctuating asymmetry would be low and of similar levels to those of the terrestrial Alligator and Odocoileus as a result of high canalization and developmental stability. However, future work looking at comparisons of asymmetry levels across a broad range of vertebrates will help to clarify these data.
Although asymmetry in birds and the relationships among asymmetry, sexual selection, and flight ability have been studied, such studies have been limited to investigating wing geometry by clipping wings asymmetrically (Hambly et al. Reference Hambly, Harper and Speakman2004) or by examining asymmetry in undamaged wings (Balmford et al. Reference Balmford, Jones and Thomas1993). The present study examined bone asymmetry rather than wing asymmetry, which may be the cause of the discrepancy between the results presented here and those of other studies. Perhaps because wings overlie bones, they may grow to be symmetric regardless of asymmetry of the wing bones. Additional studies have suggested that wing asymmetry may not impact flight ability that strongly, with birds developing new behaviors to compensate for wing asymmetry (Hambly et al. Reference Hambly, Harper and Speakman2004). However, Hambly et al. (Reference Hambly, Harper and Speakman2004) did not examine maneuverability, such as that which red-tailed hawks display during courtship (Preston Reference Preston2000), and highly acrobatic flight may be more strongly affected by asymmetry. Further, studies examining avian bone asymmetry have looked primarily at bone length rather than complex shape through GM. Perhaps bone length is strongly selected for in terms of symmetry, but the symmetry of bone shape is less relevant to fitness and is not strongly selected for. Future studies comparing wing asymmetry to wing bone asymmetry in bird groups with different levels of reliance on flight may help to tease apart the perplexing levels of asymmetry in Buteo in comparison with Alligator and Odocoileus.
Conclusions
This study provides the first estimate of the magnitude of taphonomic variation in a fossil taxon through the development of a novel method based on fluctuating asymmetry. By quantifying fluctuating asymmetry in several extant taxa and a fossil taxon, we demonstrate that the fossil taxon has significantly more asymmetric long bones and girdle bones, likely as a result of taphonomic distortion. Although this method generated a conservative estimate, an average of 27% of total shape variation was attributed to taphonomic change. Removing the asymmetric component of shape had a limited effect on the principal axes of shape across all bones analyzed, indicating that either (1) underlying biologic trends are strong enough to drive the principal directions of shape change in morphospace irrespective of asymmetric taphonomic distortion or (2) symmetrizing data are inadequate for restoring fossil shape due to the effects of the symmetric taphonomic component of variation. To fully understand the degree of asymmetry in fossil taxa, its relevance to taphonomic distortion, and its bearing on biologic variation, it is critical to generate more data on fluctuating asymmetry in extant taxa and fossil taxa. By better characterizing the normal range of fluctuating asymmetry in animals not subject to diagenetic processes (e.g., Is 14% asymmetry in Buteo large or small relative to other extant taxa?), we will be better equipped to quantify the effects of taphonomic distortion on biologic variation—a pressing issue in all comparative studies incorporating fossil data.
Acknowledgments
We thank the editors (Catherine Badgley and K. Curry-Rogers) and two anonymous reviewers who have greatly improved the quality and clarity of the article. We also thank Eric Morschhauser, Eric Lynch, Andrew McDonald, Phil Manning, Adam Laing, Samantha Cordero, Tanner Frank, Danny Tran, Christian Lanzing, Mateo Fabre, Brad Dawson, Kimberly Levine, Jordan Montoya, Lauren Richards, Joseph Longhini, Miriam Zelditch, and Donald Swiderski for discussions and help with data. We also thank numerous collections managers for access to specimens and logistical support, including Zhang Fengjiao and Gao Chunling (Dalian Museum of Natural History), Paul Sereno (University of Chicago), Jin Xingsheng (Zhejiang Museum of Natural History), Jean Woods (Delaware Museum of Natural History), Kristof Zyskowski and Gregory Watkins-Colwell (Yale University), Mark Omura and Judith Chupasko (Harvard University), Kenneth Krysko (University of Florida, Gainesville), Ned Gilmore (Academy of Natural Sciences of Drexel University, Philadelphia), Suzanne McLaren and Jeremy Jacobs (Smithsonian Institution), and Kate Doyle (University of Massachusetts, Amherst). This research was performed under the University of Pennsylvania Paleobiology Stipend and National Science Foundation grant 1612211 (awarded to B.P.H.). This paper was published with funds from Harvard University to S.E.P.