I. INTRODUCTION
The increase of global temperature has arisen the attention of the warm gas emission like CO2. Fire power plants all over the world, as one of the main sources of CO2 emission, however, is hardly possible to be replaced by other power generation methods due to the increasing demand of electricity. An effective solution to reduce CO2 emission is to improve the efficiency of steam turbine by elevating the temperature and pressure of the steam, which at the same time demands the materials with higher properties applied in manufacturing. Reference Jeongtea and Byeongook1 Ferrite-martensite steels consisting of 9–12% chromium (Cr) were developed and the chemical composition was optimized by the COST (European Cooperation in Science and Technology) project to cater the demand in recent years. Reference Mayer, Masuyama, Abe, Kern and Viswanathan2 Fatigue and creep behaviors of the advanced 9Cr steels were investigated by experiments, and the failure mechanism especially at high temperature were elaborated in many aspects. Reference Nagesha, Valsan, Kannan, Rao and Mannan3–Reference Le May, Furtado and de Almeida5 However, it is difficult to fabricate a large-scale rotor using 9Cr steel with the limit of heavy forging, and also some zones operate at lower temperature and could be satisfied with common heat-resistant steel, like CrMoV.
Welding technique provides the possibility to join different materials together. Reference Satyanarayana, Reddy and Mohandas6,Reference Naffakh, Shamanian and Ashrafizadeh7 Nevertheless, it experienced a period of research before the satisfied parameters were obtained to join the various massive rotor parts together. For the advanced 9Cr steel and CrMoV steel, due to the severe difference of their chemical compositions and mechanical properties, it is crucial to find an appropriate method and filler metal to manufacture the joint. Narrow gap submerged arc welding (NG-SAW) method accompanied with multilayer and multipass technique is therefore applied to weld the thick-section of dissimilar rotor materials in recent years, giving consideration to both the welding quality and production efficiency. Reference Kolhe and Datta8 In our previous study, the large size rotor manufactured by NG-SAW showed satisfied creep and fatigue performance, which indicated that NG-SAW could meet the requirement to join dissimilar steels used in rotors. Reference Liu, Lu, Liu, Ji and Gao9–Reference Liu, Liu, Lu, Tang, Cui and Gao14
It is known that the inhomogeneous microstructure caused by the welding process is adverse to the mechanical property. For instance, the heat affected zone (HAZ) formed in the welding process consists of gradient variation microstructure and is always a hot issue among researchers. Reference Lu, Liu, Wang, Wu, Cui and Huo15–Reference Zhao, Jing, Xu, An, Xiao, Xu, Chen and Han17 Besides, the quality of the weld metal (WM), to a large extent, depends on the welding process since improper operation might lead to weld defects deteriorating the service performance. Reference Nah, Ren, Paik and Tu18,Reference Muthupandi, Bala Srinivasan, Seshadri and Sundaresan19 The dissimilarly welded joint serves at elevated temperature condition, which is meanwhile subjected to alternating load. Therefore, it is of significant importance to take high cycle fatigue (HCF) performance into account. For a welded rotor, owing to the remarkably different microstructure and mechanical properties among the base metal (BM), HAZ, and WM, it becomes more complicated especially for dissimilar BMs. Zhu et al. investigated the effect of frequency on the very HCF behavior of low strength of a CrNiMoV steel welded joint, finding that the weakest point of the welds was transited from the BM to the WM as the test frequency increased from 110 Hz to 20 kHz. Reference Zhu, Liu and Xuan20 There was a transformation of the fatigue failure location from the outer HAZ to the end of gauge section as the stress amplitude was lower than 250 MPa, which was related to cyclic strengthening mechanisms involving deformation-induced martensite transformation. Reference Farabi, Chen, Li, Zhou and Dong21,Reference Sugimoto, Kobayashi and Yasuki22
In our previous work, HCF test at RT, 400, and 470 °C failed at the CrMoV–BM, WM, and HAZ of CrMoV side, respectively, which is ascribed to the microstructure evolution at elevated temperatures. Reference Wu, Lu, Cui, Ding, Liu and Gao23 In the present work, more detailed HCF performance of advanced 9Cr/CrMoV dissimilarly welded joint at RT was studied based on experimental observation and microstructure characterization. Two different BMs were welded by SAW method and the joint went through proper post-weld heat treatment (PWHT) before it was machined into standard fatigue specimens. Uniaxial-stress controlled HCF tests were performed at R = −1 and an S–N curve up to 1.0 × 10⁸ cycle lifetime was obtained. The microstructure and fracture morphology were analyzed subsequently by scanning electron microscope (SEM) and optical microscope (OM), and also the microhardness distribution across the welded joint was tested to help better evaluation of the HCF property of the welded joint.
II. EXPERIMENTAL PROCEDURE
A. Experimental materials
The BMs used in manufacturing rotor are dissimilar steels, which are advanced 9Cr steel and CrMoV steel. 2CrMoV is chosen as the filler metal for its appropriate chemical composition and favorable mechanical properties. Table I presents the chemical composition of the BMs and the filler metal. It is obviously seen that the content of Cr in advanced 9Cr steel is higher than that in CrMoV–BM and the WM, resulting in the higher strength and oxidation resistance.
Chemical composition of BMs and filler wire (wt%).

B. Welding procedure and PWHT
The workpiece for welding was a ring with a thickness of 150 mm, and a U-type groove was therefore used with 1° angle and 20 mm width gap size at the bottom. In the welding process, advanced 9Cr steel was joined to CrMoV by narrow gap gas tungsten arc welding (NG-GTAW) technique as back welding process for its excellent welding quality. Subsequently, NG-SAW technique was applied to fill the thick weld bead. Multi-layer and multi-pass techniques were taken in the welding process due to the heavy section of the component. In the NG-SAW process, the welding current and voltage adopted for each pass were around 500 A and 30 V, respectively. The welding speed was 0.6 m/min, so the welding heat input for each pass and layer was optimized to be 15.0 kJ/cm so as to get better microstructure and mechanical properties. PWHT was finally carried out to release the welding stress and stabilize the microstructure of the whole joint. In the PWHT process, the welded joint was put into a big vertical furnace, where it spent about 30 h at 560 °C before cooling down to RT in the furnace.
C. HCF test
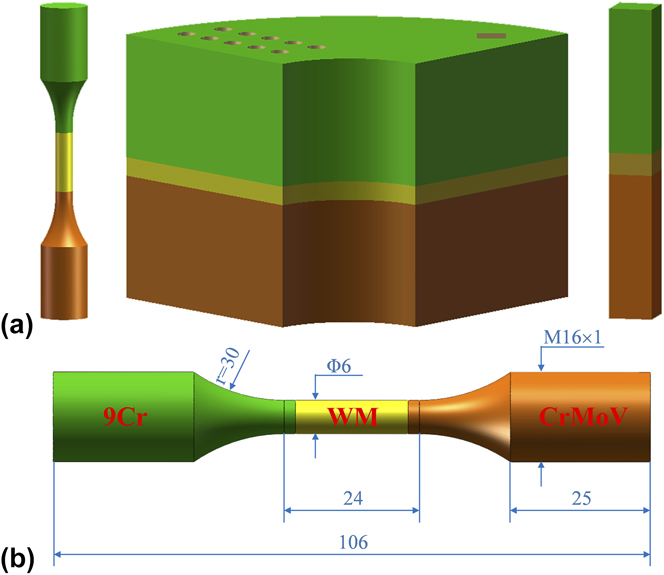
Fatigue specimens perpendicular to the fusion line were chipped from the dissimilarly welded joint after PWHT as shown in Fig. 1. It is worth noting that since the NG-GTAW part had a better weld quality and more stable mechanical properties, only the NG-SAW part was investigated here. The gauge section was shaped with a length of 24 mm and a diameter of 6 mm, and the surface was carefully polished to minimize the effect of machining defects on the test. HCF tests were then performed following ASTM E466-07 at RT. 24 An axial sinusoidal cyclic load with the stress ratio R = −1 was applied and the frequency was about 130 Hz. The test was conducted until an S–N curve up to 1.0 × 10⁸ cycles was obtained. After the test, gauge sections of all specimens were etched slightly by nital consisting of 4% nitrate to reveal the fracture locations.
Schematic of the dissimilarly welded joint and fatigue test specimen: (a) specimens for HCF test and microstructure observation chipped from the welded joint, (b) the size of the fatigue specimen.

D. Microstructure analysis
Microstructure and fracture surface of the failed specimens were observed using OM (Zeiss Imager A2m, Oberkochen, Germany) and SEM (JSM 7600F, Akishima, Tokyo, Japan). Energy dispersive x-ray spectroscopy (EDS: INCA by Oxford Instruments, Oxfordshire, United Kingdom) was used as well to analyze the composition of the crack initiation. Etch A (nital consisting of 4% nitrate) was used to etch the CrMoV–BM and WM. Advanced 9Cr, in addition, was etched by etch B (HCl + HNO3 + H2O = 3:5:5) due to its much higher corrosion resistance resulting from its high Cr content. Microhardness (Zwick/Roell, Ulm, Baden-Württemberg, Germany) distribution along the joint was measured with a hardness tester. The applied load and duration time were 9.8 N and 15 s, respectively.
III. RESULTS AND DISCUSSION
A. HCF test results of dissimilarly welded joint
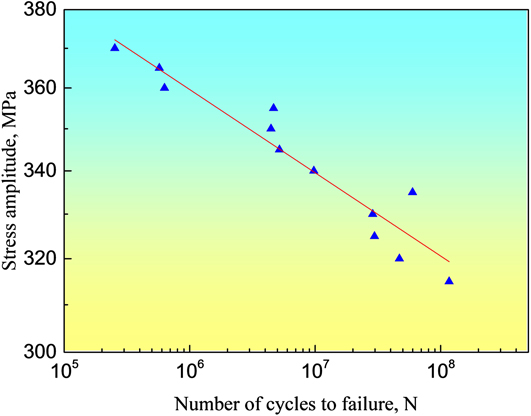
The HCF test was carried out at RT with the stress ratio R = −1, and different stress levels were chosen to achieve the S–N curve. The HCF test results and the correlation between the stress amplitude and the fatigue life are plotted in Fig. 2. It indicates that the fatigue life of the welded joint increases as the stress amplitude decreases.
S–N result of advanced 9Cr/CrMoV dissimilarly welded joint tested at RT.
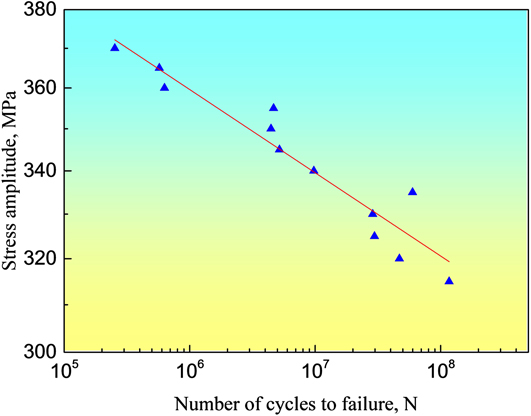
Basquin-type equation, as follows, is used to fit the obtained fatigue data, Reference Farabi, Chen, Li, Zhou and Dong21
 $${\sigma _{\rm{a}}} = {\sigma _{\rm{f}}}^\prime {\left( {2N} \right)^b}\quad ,$$
where σa is the testing stress amplitude and
 ${\sigma _{\rm{f}}}^\prime$
is the fatigue strength coefficient defined by the stress intercept at 2N = 1, N is the number of cycles to failure, and b is the fatigue strength exponent. The calculated values of
 ${\sigma _{\rm{f}}}^\prime$
and b are given in Table II. The fatigue strength is around 325 MPa, corresponding to the fatigue life of 5.0 × 10⁷.
Fatigue parameters for the dissimilarly welded joint.

B. Microstructure characterization
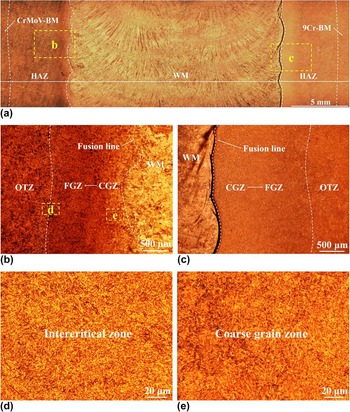
To help better illustrate the correlation of HCF property and microstructure of the dissimilarly welded joint, the microstructure of different zones is characterized in detail and is presented in Figs. 3 and 4. Figure 3(a) reveals the overall microstructure of the dissimilarly welded joint. The whole joint is roughly divided into five zones, i.e., CrMoV–BM, CrMoV–HAZ, WM, 9Cr–HAZ, and 9Cr–BM. The WM exhibits a typical multilayer and multipass feature. More detailed OM images of the HAZs on both sides are shown in Figs. 3(b) and 3(c). For each HAZ, it can be further divided into coarse grain zone (CGZ), fine grain zone (FGZ), and over tempered zone (OTZ) according to their different thermal histories from the fusion line to the BM, which will be further determined by a microhardness test later. It should be noted that the fusion line of the 9Cr side is accompanied with a narrow black zone, which is resulted from the carbon migration that will be discussed in detail afterward. Figures 3(d) and 3(e) illustrate more distinct microstructure of CrMoV–HAZ. Figure 3(d) reveals the microstructure of the CrMoV-inter-critical heat affected zone (ICHAZ) located at the boundary of the CrMoV–OTZ and CrMoV–FGZ and will be further discussed later. The microstructure of CrMoV–CGZ, as shown in Fig. 3(e), turns out to be homogeneously distributed granular tempered martensite, which could improve the HCF property.
Microstructure of the whole dissimilarly welded joint, CrMoV–HAZ and advanced 9Cr–HAZ: (a) the overall microstructure of the advanced 9Cr/CrMoV dissimilarly welded joint, (b) the overall microstructure of CrMoV–HAZ, (c) the overall microstructure of advanced 9Cr–HAZ, (d) detailed microstructure of inter-critical zone (ICHAZ) located at the boundary of CrMoV–OTZ and CrMoV–FGZ, and (e) detailed microstructure of CGZ in CrMoV–HAZ.

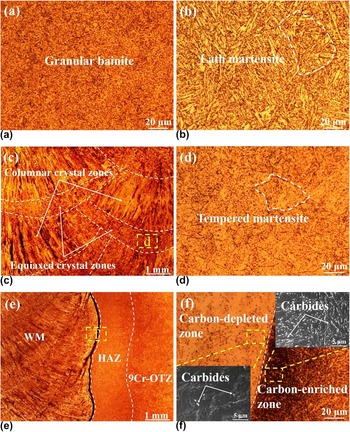
Microstructure of the CrMoV–BM, 9Cr–BM, middle of WM and the CDZ: (a) detailed microstructure of CrMoV–BM, (b) detailed microstructure of 9Cr–BM, (c) the overall microstructure at the middle of the WM including columnar crystal and ECZs, (d) detailed microstructure of the ECZ, (e) the overall microstructure adjacent to the CEZ and CDZ, and (f) detailed microstructure of the CEZ and CDZ. The SEM images in the insets of (f) revealed details of the carbide distribution of CEZ and CDZ, respectively.

Figures 4(a) and 4(b) comparably display the detailed microstructure of the CrMoV–BM and the 9Cr–BM. The granular tempered bainite and lath tempered martensite are typical microstructure of CrMoV–BM and 9Cr–BM, respectively, which reveal that this kind match of materials could operate at different temperatures. The microstructure in the middle of the WM is shown in Fig. 4(c). It is clearly seen that columnar crystal zones and equiaxed crystal zones (ECZs) appear to be interlaced due to the multilayer and multipass technique. The microstructure of ECZ in WM is mainly tempered martensite [Fig. 4(d)], however, multitemper makes the ECZs in the middle of WM soften which is dangerous in HCF test. Figure 4(e) and 4(f) manifest the fusion zone between WM and 9Cr–BM with great difference in carbides, which could be observed in the carbon-depleted zone (CDZ) in WM and carbon-enriched zone (CEZ) in 9Cr–HAZ. As mentioned above, carbon element migrates from WM to the 9Cr–HAZ in welding process due to the difference of Cr content. In our previous study, a soft zone is formed adjacent to the fusion line, which provides possibility to initiate cracks. Reference Wu, Lu, Cui, Liu, Wang and Gao25 Generally, the CDZ reveals lower hardness and the CEZ shows higher hardness. Stress concentration tends to occur at the boundary between the two zones and then leads to failure.
C. Fracture location and morphology
1. Microhardness test result
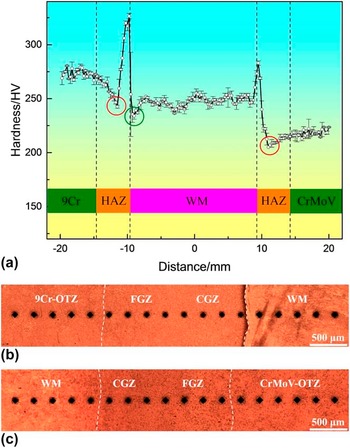
The Vickers microhardness distribution across the dissimilarly welded joint is displayed in Fig. 5. A typical welded joint hardness distribution characterized with two peaks near the fusion lines is obtained. It is apparently seen that advanced 9Cr–BM has a higher microhardness of 273 HV than the WM of 248 HV and CrMoV–BM of 219 HV. The microstructure of lath martensite in 9Cr–BM contributes to the higher hardness than the WM and CrMoV–BM. Two soft zones with relatively lower hardness on both sides of HAZ are marked with red circles, which are discussed before as the ICHAZ located between OTZ and FGZ. During the welding process, only part of the microstructure in the ICHAZ reversed to austenite and transformed into untempered martensite on cooling. The remainder of the microstructure, however, was simply tempered, leading to a mixed microstructure of untempered martensite and tempered bainite. Reference Francis, Mazur and Bhadeshia26 Though the original martensite was tempered during the subsequent PWHT process, the mechanical properties between the tempered martensite and tempered bainite still differ greatly. In the WM, a zone with relatively low hardness adjacent to the fusion line of the advanced 9Cr side can also be observed (marked with a green circle), which agrees with the CDZ in the WM [Fig. 4(f)]. Since the CDZ is of low hardness along with stress concentration at the boundary with CEZ as mentioned before, this zone possesses inferior fatigue crack initiation resistance property, which might cause failure at HCF tests. Additionally, in our previous study, the CDZ gradually becomes wider with increasing HCF temperature. Reference Wu, Lu, Cui, Liu, Wang and Gao25 It is therefore of significant importance that carbon migration should be controlled to better improve the joint's performance at high temperature.
Microhardness distribution across the dissimilarly welded joint: (a) micro-hardness profile across the whole dissimilarly welded joint, (b) corresponding locations of the micro-hardness measurement on 9Cr–HAZ side, and (c) corresponding locations of the microhardness measurement on CrMoV–HAZ side.

2. Failure location analysis
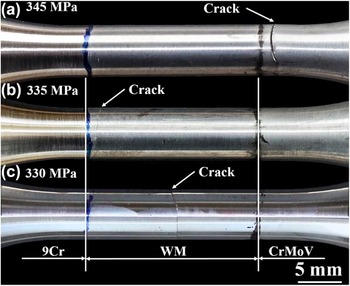
It is noticed that the failure location shifts with decreasing stress levels as illustrated in Fig. 6. The specimens tend to fail at the CrMoV–HAZ at stress over than 340 MPa, otherwise failure occurs in the WM regarding the fracture location. As stress decreases, fatigue specimens failed at CrMoV–HAZ, WM–CDZ and middle of the WM, respectively.
Fracture location determination of the HCF specimens tested at RT. (a) specimen failed at the CrMoV–HAZ at 345 MPa; (b) specimen failed at WM–CDZ at 335 MPa; (c) specimen failed at middle of the WM at 330 MPa.

From the aforementioned discussion, the ICHAZ in the CrMoV–HAZ has a mixed tempered martensite–bainite microstructure. It is reasonable to infer that stress concentration is more severe and the fatigue crack resistance property is much worse at this zone than other zones where the microstructure is relatively more even like the CrMoV–CGZ. For the WM, CDZ resulting from carbon migration and the center of the WM underwent multi-tempering became two weak zones to failure. It is reasonable to conclude that microstructure plays an important role in the HCF behavior of the joint.
3. Fracture morphology
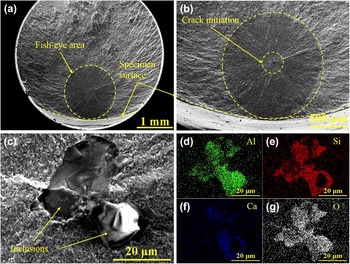
Fracture appearance of the specimen failed at the CrMoV–HAZ under 345 MPa is shown in Fig. 7. A fish-eye with the tangent to the surface can be observed [Fig. 7(a)], indicating that the fatigue crack was initiated from subsurface. Crack initiation located in the center of the fish-eye area [Fig. 7(b)] is identified to be strip shaped nonmetallic inclusions embedded in the 9Cr–BM matrix [Fig. 7(c)]. Chemical composition of the inclusions was analyzed by EDS and the mapping results proved them to be nonmetallic oxides of aluminum (Al), silicon (Si), and (Ca) as depicted in Figs. 7(d)–7(g).
Fractography of the fatigue specimen failed at CrMoV–ICHAZ at 345 MPa: (a) location of the fish-eye area on the fracture surface, (b) crack initiation area at the center of the fish-eye, (c) magnified micrographs of the crack initiation area, and (d)–(g) present the mapping analysis results of Al, Si, Ca, and O elements distribution, respectively, in (c).

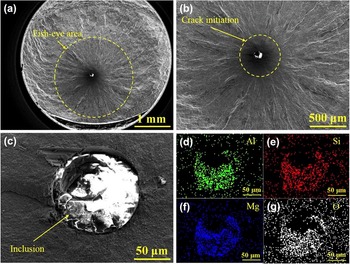
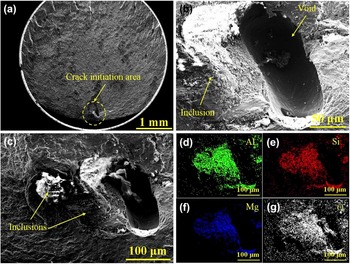
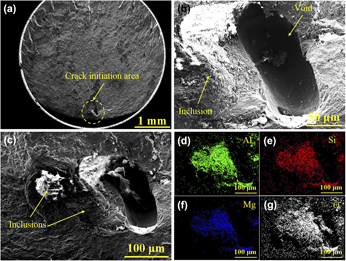
The fracture location comes to the WM, occurring at CDZ and the middle of the WM, respectively. The fracture morphology of the specimen fails at the CDZ, is shown in Fig. 8. Figure 8(a) presents a fish-eye area with a diameter of around 2 mm. The crack initiation region is surrounded by a dark area as shown in Fig. 8(b), which has been termed the “optically dark area” (ODA) by Murakami, Reference Murakami, Yokoyama and Nagata27 the “fine granular area” (FGA) by Sakai, Reference Sakai28 and “granular bright facet” (GBF) by Shiozawa. Reference Shiozawa, Morii, Nishino and Lu29 According to Murakami et al., the formation of the ODA is due to the cyclic stress coupled with the hydrogen which is trapped by the inclusion. According to Sakai et al., a fine granular layer caused by intensive polygonisation is induced around the interior inclusion during a long sequence of the cyclic loading, followed by microdebonding, which can coalesce, leading to a FGA. According to the new theory proposed by Grad et al., the main component of the FGA formation is grain refinement, which leads to a decrease in the threshold value for crack initiation. Reference Grad, Reuscher, Brodyanski, Kopnarski and Kerscher30 Shiozawa et al. ascribed the formation of the GBF to the separation of boundaries between carbide particles and the matrix. Anyway, a high proportion of the fatigue life is consumed forming the FGA around the inclusion, which is much slower than the subsequent crack propagation process. Thus the FGA can only be observed at low stress amplitude and very high cycle fatigue regime. Unlike the crack initiation in the CrMoV–HAZ, inclusion with a round shape is found in the WM [Fig. 8(c)], and EDS analysis shows that the inclusion is enriched in Al, Si, Mg, Ca, and O [Figs. 8(d)–8(g)]. Fracture appearance of the specimen failed at the middle of WM at 330 MPa is presented in Fig. 9, which revealed that the crack initiation site was located near the surface [Fig. 9(a)]. An elliptical shaped void can be observed, with a size of about 120 μm in maximum length [Fig. 9(b)]. Accompanied with the void, nonmetallic oxide inclusions can be detected as well [Fig. 9(c)], which are determined to be oxides of Mg, Al, Si, Ca, etc. [Figs. 9(d)–9(g)]. Due to the significant difference of elasticity moduli between matrix and the defects, especially the void, small crack induced by stress concentration is more easy to form at the interface.
Fractography of the fatigue specimen failed at WM–CDZ at 335 MPa: (a) location of the fish-eye area on the fracture surface, (b) crack initiation area at the center of the fish-eye, (c) magnified micrographs of the crack initiation area, and (d)–(g) present the mapping analysis results of Al, Si, Mg, and O elements distribution, respectively, in (c).

Fractography of the fatigue specimen failed at middle of the WM at 330 MPa: (a) location of the crack initiation area on the fracture surface, (b) void that initiates the crack, (c) void is accompanied with inclusions, and (d)–(g) present the mapping analysis results of Mg, Al, Si, and O elements distribution, respectively, in (c).

For interior crack initiated around inclusions, it is reported that the location of the maximum stress is related to the elastic moduli ratio of the inclusion to matrix, i.e., E inc/E matrix. Reference Zhu, Xuan and Chen31 When E inc/E matrix > 1, the largest stress is located at the inclusion and thus leads to crack. Otherwise, for E inc/E matrix < 1, crack could be formed due to separation process between the matrix and inclusion. In the case of the specimen failed at the CrMoV–ICHAZ, the inclusion has close conjunction with the matrix and the crack initiation can be considered as the burst of the inclusion, therefore inclusion has larger elastic modulus than the CrMoV–ICHAZ matrix. Moreover, it is interesting to notice that suspected melting phenomenon happens on the crack initiation site [Fig. 7(c)] and further investigation will be carried out. For the specimen fracturing at the CDZ in the WM, separation of inclusion and matrix indicates that the elastic modulus of inclusion is smaller than that of WM matrix.
Since inclusion in the CrMoV–HAZ has higher elastic modulus, higher stress is needed to burst it. Thus it makes sense that failure occurs at the CrMoV–HAZ at a higher stress amplitude and corresponds to a shorter lifetime. As the stress is lower than 340 MPa, it is much harder to break the inclusion in the CrMoV–HAZ, but with continuous cyclic loading, grain refinement took place around the inclusions in both the CrMoV–HAZ and CDZ of the WM, which leads to a local decrease in the threshold value for crack initiation. This can be regarded as a competitive process, during which the CDZ of the WM with larger inclusion failed first.
For the specimens failed at middle of WM with shorter fatigue life at lower stress of 335 MPa, welding defects do greater harm to the HCF performance than inclusions. The welding defects in the welding process need to be optimized by welding parameters. In this case as shown in Fig. 9, a large-sized void is accompanied with inclusions, which means more concentrated stress existing in this region. Since the void is located near the surface, it takes less cycles for the crack to propagate to the specimen surface compared with the interior crack, which induces a shorter lifetime. Hence it can be concluded that the void-induced failure specimens showed shorter fatigue life than inclusion-induced failure ones in the WM even at lower stress. In order to obtain higher HCF property, the inclusions and welding defects in the dissimilarly welded joint should be more strictly controlled in the welding processes.
With all that in mind, it can be summarized that the microstructure and defects both play important roles in the HCF behavior. On the one hand, fatigue failure always takes place in the region of microstructure with low strength, i.e., CrMoV–ICHAZ, WM–CDZ and the middle of WM in the dissimilarly welded joint. On the other hand, at lower strength and longer fatigue life (>1.0 × 10⁷), the size and location of defects have much more important influence on the fracture location.
IV. CONCLUSIONS
In this work, HCF tests were conducted with the dissimilarly welded joint fabricated by NG-SAW at RT. Special attention was paid to the mechanism of fracture location transition from CrMoV–HAZ to WM with decreasing stress. Some conclusions of this research are extracted as follows:
-
(1) For the advanced 9Cr/CrMoV dissimilarly welded joint, S–N curve at room temperature (RT) is obtained and the fatigue strength is about 325 MPa at the cycles of 5.0 × 10⁷.
-
(2) Microstructure diversity is found to be responsible for the different failure locations. CrMoV–ICHAZ with mixed tempered martensite–bainite microstructure, WM–CDZ resulting from carbon migration and the middle of WM undergoing multi-tempering process became three weaker zones to failure in HCF test.
-
(3) Stress amplitude plays an important role in the HCF failure location of the joint at RT. HCF fracture locations transfer from CrMoV–ICHAZ to WM as the stress decreases to below 340 MPa. The burst of the inclusion in the CrMoV–ICHAZ could be the crack initiation at high stress level, whilst at lower stress, the separation of inclusion in the CDZ with the WM matrix impelled the formation of cracks. Void defect due to lack of fusion became another important factor to influence the fatigue property at lower stress amplitudes.
ACKNOWLEDGMENT
The authors gratefully acknowledge the financial supports by Shanghai Science and Technology Committee (No. 13DZ1101504).