1. Introduction
Air traffic control officers (ATCOs) are essential in collaboratively managing aircraft scheduling, pilot communications, and crisis resolution by monitoring, detecting, managing, and restoring aircraft conflicts within their sector (Ng et al., Reference Ng, Lee, Zhang and Keung2020b). Despite the recent automation advancements in air traffic control (ATC), which have significantly assisted ATCOs in task execution (Ng et al., Reference Ng, Lee, Chan and Qin2017, Reference Ng, Lee, Chan, Chen and Qin2020a, Reference Ng, Chen, Lee, Jiao and Yang2021), these professionals often handle one or more responsibilities simultaneously. Prolonged exposure to such high demands can detrimentally affect their mental state, leading to diminished performance and decision-making capabilities, and increased risk of hazardous actions (Fabbri and Vicen-Bueno, Reference Fabbri and Vicen-Bueno2021). As a result, it is critical to support ATCOs in consistently achieving optimal human performance.
A fundamental component of this support is the development of a comprehensive understanding of situation awareness (SA), which is essential for maintaining effective human performance (Trapsilawati et al., Reference Trapsilawati, Chen, Wickens and Qu2021). SA is a dynamic cognitive process crucial for ATCOs as it allows them to recognise what is happening and what will happen in an ever-changing environment based on the interpretation of environmental components (Liang et al., Reference Liang, Yang, Yu, Prakah-Asante, Curry, Blommer, Swaminathan and Pitts2021), which are especially pertinent in scenarios requiring quick human intervention, such as during automation failures. The widely acknowledged definition of SA, as established by Endsley (Reference Endsley1999), categorises it into three levels: perceiving (level-1), comprehending (level-2), and projecting (level-3) the activities of various elements within the surrounding situations. Specifically, level-1 involves perceiving the relevant components, including their status and attributes within the surrounding environment. Level-2 relates to comprehending these elements in the context of an individual's goal and objectives. Level-3 encompasses the ability to predict future actions of system elements based on an integrated synthesis of information required from level-1 and level-2. Moreover, a decision-making cycle that incorporates SA has also been formulated specifically for military operations, encompassing four phases: observation (perception), orientation (comprehension), decision (projection), and action (implementation of the chosen response), which are then applied to SA and decision-making processes in safety applications (Mclntosh, Reference Mclntosh2018). In the aviation domain, the distinction between level-2 and level-3 SA is frequently indistinct because comprehending present situations naturally encompasses the anticipation of future states. These two levels are not rigidly delineated and are considered collectively as a higher level of SA in aviation (Nguyen et al., Reference Nguyen, Lim, Nguyen, Gordon-Brown and Nahavandi2019). To further this understanding, research has also explored quantifying SA through tailored degrees in specific contexts, signifying the presence or absence of situational comprehension and foresight. Li et al. (Reference Li, Ng, Yu, Yiu and Lyu2023b) tried to identify two binary classes of SA (higher and lower SA) using physiological metrics, and Fernandez Rojas et al. (Reference Fernandez Rojas, Debie, Fidock, Barlow, Kasmarik, Anavatti, Garratt, Abbass, Gedeon, Wong and Lee2019) segmented SA into four distinct degrees in the context of teleoperated human-swarm teaming, shedding light on its practical implications.
It is noteworthy that a significant proportion of accidents attributed to human error are associated with deficiencies or loss in SA (Endsley, Reference Endsley1999; Nguyen et al., Reference Nguyen, Lim, Nguyen, Gordon-Brown and Nahavandi2019). Insufficient SA among ATCOs can severely impair their readiness and capacity to respond to urgent or unforeseen hazards. Delays and erroneous decisions in flight management have often been a consequence of ATCOs’ failure to observe specific objects at critical moments or to anticipate subsequent developments accurately (Zhang et al., Reference Zhang, Yang, Liang, Pitts, Prakah-Asante, Curry, Duerstock, Wachs and Yu2020). Therefore, maintaining an appropriate level of SA, or rapidly recovering it, is crucial for ensuring the safety of flight scheduling within the complex system of ATC. Evaluating potential inadequacies in ATCOs’ SA in real-time is essential to inform and implement appropriate corrective actions, which are vital for ensuring aviation safety and the efficient management of airspace resources over the long run.
1.1 SA measurements
Current methodologies for evaluating SA primarily utilise standardised techniques, including the situation awareness global assessment technique (SAGAT), situation awareness rating technique (SART), situation presence assessment method (SPAM), and SA for SHAPE online (SASHA_L) (Taylor, Reference Taylor2017; Nguyen et al., Reference Nguyen, Lim, Nguyen, Gordon-Brown and Nahavandi2019; Zhou et al., Reference Zhou, Yang and de Winter2021). SAGAT, SPAM, and SASHA_L are event-based tools with intrusive means that measure operators’ SA during task execution by having subjects answer questions according to the current situation (Zhang et al., Reference Zhang, Yang, Liang, Pitts, Prakah-Asante, Curry, Duerstock, Wachs and Yu2020). SART is a standard self-report tool to measure SA after a task by calculating scores for the demand, supply, and understanding of the situation (Eklund and Osvalder, Reference Eklund and Osvalder2021). However, all of them either utilise the freeze/online probe technique, which is suitable only for the experiment-exploration phase and challenging to apply in real-world practical scenarios due to task interruptions/intrusions, or the post-trial self-rating method, which is non-real-time and possibly prone to individual biases (Zhang et al., Reference Zhang, Yang, Liang, Pitts, Prakah-Asante, Curry, Duerstock, Wachs and Yu2020).
The good news is that measurements based on neuro-ergonomics and biosensor technologies, such as electroencephalogram (EEG) (Hu and Lodewijks, Reference Hu and Lodewijks2020) and eye-tracking (Behrend and Dehais, Reference Behrend and Dehais2020), provide a promising approach to real-time monitoring of SA changes in aviation, attributed to their continuous recording capabilities. First, EEG works by detecting and recording the brain's electrical activity using electrodes attached to the scalp, one of the most accurate physiological indicators of human capabilities, such as mental workload, SA, and alertness (van Weelden et al., Reference van Weelden, Alimardani, Wiltshire and Louwerse2022). EEG frequency bands are classified into five waves that reflect complex brain activity: delta (δ; 0–4 Hz), theta (θ; 4–8 Hz), alpha (α; 8–13 Hz), beta (β; 13–30 Hz) and gamma (γ; 30–50 Hz) (Michel et al., Reference Michel, Lehmann, Henggeler and Brandeis1992). The power spectral density (PSD) variations across these five EEG bands have been extensively correlated with human capabilities. For example, during an SA-test experiment, Kästle et al. (Reference Kästle, Anvari, Krol and Wurdemann2021) demonstrated the correlation between SA and EEG signals by analysing brain activity in individuals with high and low SA, finding a significant correlation with the β and γ frequency bands. Similarly, in a study involving 10 participants, Fernandez Rojas et al. (Reference Fernandez Rojas, Debie, Fidock, Barlow, Kasmarik, Anavatti, Garratt, Abbass, Gedeon, Wong and Lee2019) employed a 14-channel semi-wet EEG to evaluate different levels of SA, discovering noticeable differences across brain frequency bands during instances of SA degradation. In aviation, Li et al. (Reference Li, Ng, Chu, Lau and Leung2023a) revealed the impacts of increased workload and distraction on the pilot's SA and investigated the neurophysiological patterns of high and low SA based on PSD activity.
Eye-tracking technology captures the operator's visual behaviours by monitoring the movement of the eyeball, pupil, cornea and other ocular components. It has been adopted in aviation studies to analyse and forecast real-time activities through observation, comprehension and prediction of visual patterns (Lyu et al., Reference Lyu, Li, Xu and Han2023). Metrics derived from eye movements, including fixation, saccade, and gaze-based metrics, dwell time, and blink metrics, serve as effective, non-intrusive indicators of visual attention and mental states, giving valuable insights into individuals’ awareness of the current situation (Lyu et al., Reference Lyu, Li, Xu and Han2023; Li et al., Reference Li, Chen, Ng, Yuan and Yin Yiu2024). Eye-tracking technology encompasses two primary types: screen- and glasses-based systems. Glasses-based eye-tracking requires pre-processing to map gaze data onto specific snapshots before extracting metrics. Lu et al. (Reference Lu, Happee and de Winter2020) identified the attentional distribution and SA in the face of driving hazard situations using eye-tracking: through comparisons of subjects’ pupil sizes, they found that hazardous situations do not affect global SA in traffic scenarios. Yoon and Ji (Reference Yoon and Ji2019) found eye-tracking metrics to be a critical contributor to re-engaging tasks and maintaining SA during takeover processes.
1.2 Research scope
It is essential to acknowledge that correction lenses might affect the calibration/accuracy of eye-tracking recording. Moreover, the phenomenon known as the ‘look-but-not-see’ effect, where individuals can see objects without fully processing or understanding them due to their mind wandering or cognitive distractions, may also occur. Therefore, for a robust approach to SA assessment, combining eye-tracking, effective in monitoring psychological responses such as attention and distraction (Nguyen et al., Reference Nguyen, Lim, Nguyen, Gordon-Brown and Nahavandi2019; Vanderhaegen et al., Reference Vanderhaegen, Wolff and Mollard2020), with EEG brain activity methods sensitive to all possible physiological changes, is recommended (Kästle et al., Reference Kästle, Anvari, Krol and Wurdemann2021). This integration presents a promising approach for accurately monitoring SA in real-time in the aviation domain, leveraging both technologies’ strengths for comprehensive analysis. What is remarkable is the signals obtained from EEG and eye-tracking devices are inherently non-representational, indicating that they lack explicit initial information about SA levels. The correlation between these signals and SA levels necessitates discovery through detailed analysis and subsequent learning processes. In addition, SA possesses characteristics that are closely correlated with specific situations (Endsley, Reference Endsley1995).
In the review of the literature on SA studies within the aviation domain (Aricò et al., Reference Aricò, Borghini, Flumeri, Bonelli, Golfetti, Graziani, Pozzi, Imbert, Granger, Benhacene, Schaefer and Babiloni2017; Peißl et al., Reference Peißl, Wickens and Baruah2018; Nguyen et al., Reference Nguyen, Lim, Nguyen, Gordon-Brown and Nahavandi2019; van Weelden et al., Reference van Weelden, Alimardani, Wiltshire and Louwerse2022; Lyu et al., Reference Lyu, Li, Xu and Han2023), several research gaps pertaining to the aspects mentioned above were found: (i) few studies have concentrated on tracking variations in SA levels among ATCOs, especially those employing both physiological and psychological metrics concurrently; (ii) little research has investigated the correlations between changes in SA and human psychophysiological indicators, as measured by EEG and eye-tracking. This is the initial step for real-time recognition of the potential inadequacies in ATCOs’ SA, helping to understand the human performance envelope (i.e. the limits of a person's physical, cognitive, and psychological capabilities under specific conditions) for safe operation; and (iii) given that ATCOs may exhibit varying levels of SA depending on the task requirements, it is not imperative for ATCOs to maintain the highest level of SA at all times. However, current research appears to overlook this, failing to consider the full three SA levels.
Returning to the primary goal of real-time evaluation of SA inadequacies, given the non-representational nature of signals from EEG and eye-tracking in evaluating ATCOs’ SA, a critical preliminary study was to investigate the feasibility of inferring ATCOs’ SA levels using indicators from EEG and eye-tracking by discovering the correlations between these indicators and changes in SA – critical to laying the groundwork for real-time identification of SA variations.
1.3 Research purposes and hypothesis
Brain activity is highly responsive to any potential physiological changes, such as workload, stress, and so forth. To establish the correlations between physiological changes and SA levels, a direct measurement is required to provide references to SA. This study aimed to develop an experimental-based multimodal strategy to acquire indicators from eye-tracking and EEG to examine their correlation with various levels of SA in ATC, and subsequently see if this could elucidate the effects of SA variation in human physiological responses. An analytical methodology and procedure, including direct SA measurement, were established: the conceptual links between psychophysiological indicators and SA will be explained. This work could also provide references for how SA can be measured, trained, and used to assure aviation safety using EEG in combination with eye-tracking technologies. Three hypotheses (H) were developed as follows:
• H1: The designed ATC experiment with three kinds of SA-probe test and the proposed methodology will successfully extract the psychophysiological indicators corresponding to the required SA levels.
• H2: Brain wave patterns and eye movements are highly responsive to fluctuations in human performance, reflecting changes in cognitive load and eye interaction demands; therefore, as the required level of SA increases, there will be a notable decrease in α waves and an increase in β and γ bands, as well as fixation duration and pupil size.
• H3: There will be synchronism between both metrics as SA changes.
2. Methodology
2.1 An overview of the multimodal strategy
The strategy was inspired by the work of Kästle et al. (Reference Kästle, Anvari, Krol and Wurdemann2021), who introduced an experiment where animals moved on the screen for a few seconds before vanishing. Following this, a SAGAT probe, enquiring about the movements of the animals, was presented to participants to collect their measurable responses, which were used as objective data (direct measurement) for assessing SA levels. Concurrently, EEG data were collected, with markers inserted when probes appeared to synchronise both data. The direct measurement obtained then served as a proxy to calibrate the non-representational EEG signals (indirect measurement) related to SA levels. By analysing these data, a correlation between SA levels and EEG signals was established, which led to the development of an EEG-based identification model during this experiment-exploration stage, enabling the direct determination of SA levels using EEG signals in specific real-world scenarios without SAGAT-like objective measurement interruption.
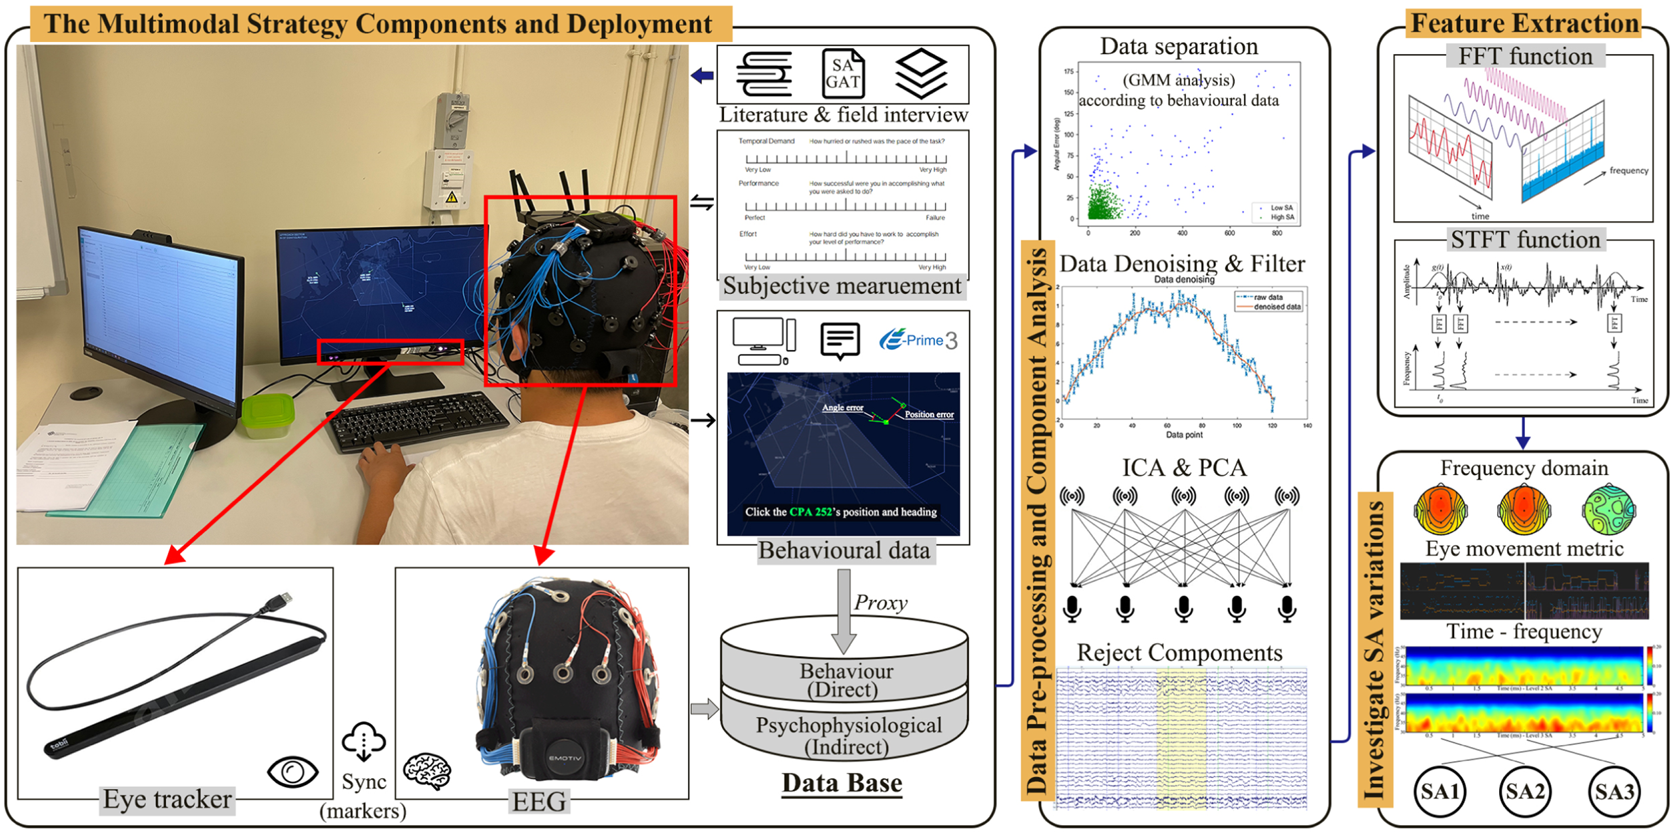
In light of the above ‘direct-proxy-indirect measurement’ framework, as shown in Figure 1, a multimodal strategy was proposed in relation to ATCOs to reveal the correlation between SA changes and attentional distribution and brain activity, investigating the SA variations using EEG and eye-tracking indicators. Specifically, (1) an ATC experiment with SA-probe tests was first designed, and the probes involved three kinds of test related to different required SA levels. (2) During the experiment, multimodal data were collected, including SAGAT scores (behavioural data), to directly measure SA levels, alongside EEG and eye-tracking data throughout the experiment. These psychophysiological data were synchronised using markers at the onset of probes and related to SA levels through the assistance of behavioural proxies. Additionally, subjective measurements (self-report questionnaires) were collected immediately after the experiment to cross-verify the synchronisation with psychophysiological results and to ensure that the designed ATC experiment was effectively measurable. (3) Data pre-processing and feature extraction were completed using employed algorithms, including the Gaussian mixture model (GMM), independent components analysis (ICA), fast Fourier transform (FFT), and short-time Fourier transform (STFT) to calculate the psychophysiological indicators. Subsequent statistical analyses were conducted to evaluate statistical differences in the extracted indicators across different SA levels, validating the availability of the proposed multimodal strategy and affirming its applicability in aviation SA investigation contexts.
An overview of the multimodal strategy for investigating SA variations using the psychophysiological indicators

2.2 Multimodal strategy components and deployment
2.2.1 Participants
This study recruited 31 participants (24 males and 7 females), aged between 19 and 32 (mean age 23 ⋅ 48 ± 3 ⋅ 16), with no history of neurological, physical or psychiatric disorders, from the Department of Aeronautical and Aviation Engineering at The Hong Kong Polytechnic University. These participants had foundational knowledge of flight and air traffic management, having completed essential subjects and professional training related to the duties and operations of ATC and ATCO. They had additionally garnered over 6 h of practical experience within the Hong Kong Civil Aviation Department Air Traffic Control Building. This research was approved by the Hong Kong Polytechnic University Institution Review Board (HSEARS20210318002) in advance, and all participants understood the experimental procedure and signed the consent form before commencing the experiment.
2.2.2 Experiment scenario design
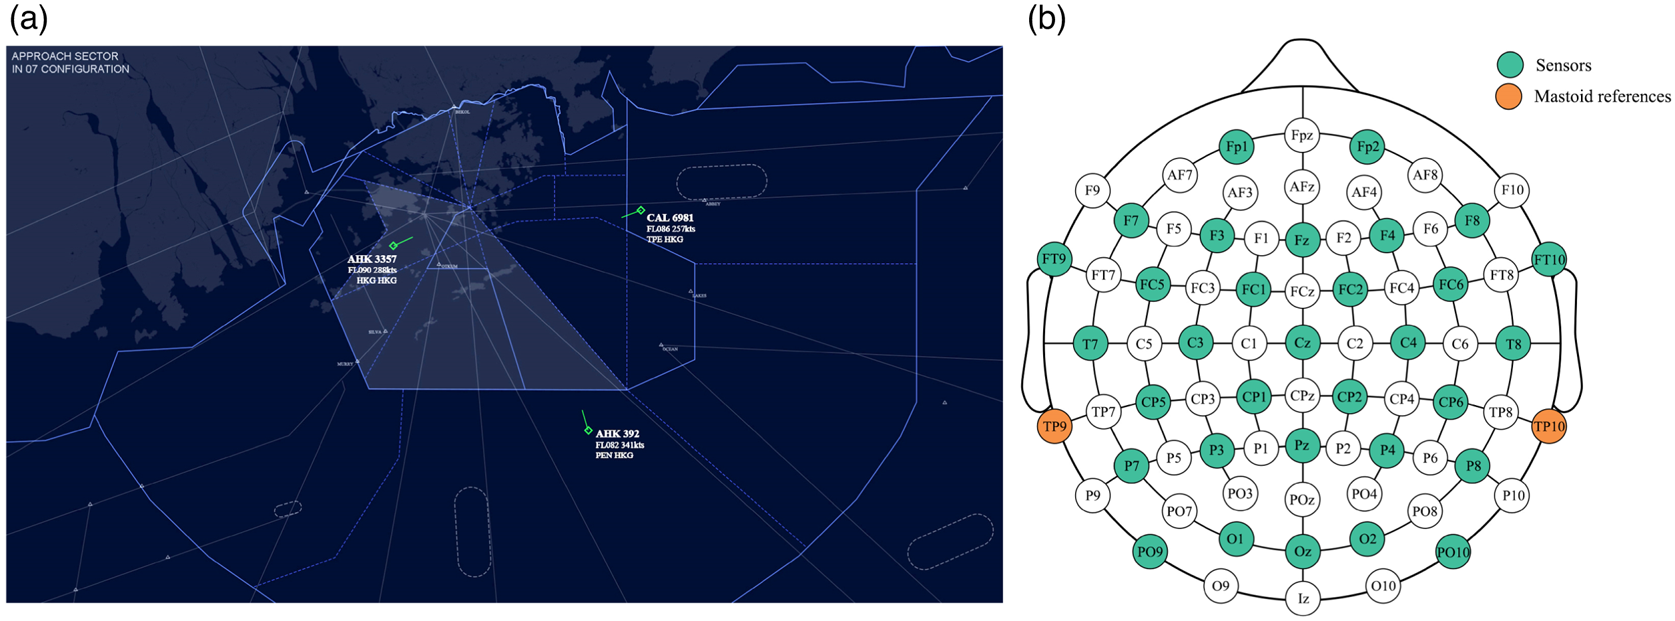
The ATC radar map, a parameter frequently utilised by ATCOs, plays a critical role in their ability to manage virtually all aspects of air traffic. Its usage significantly impacts human performance, serving as a pivotal tool for ensuring the efficient and safe coordination of aircraft movements (Aricò et al., Reference Aricò, Borghini, Flumeri, Bonelli, Golfetti, Graziani, Pozzi, Imbert, Granger, Benhacene, Schaefer and Babiloni2017). To mitigate the cross-effects of high workloads, a handful of aircraft, as recommended by Yeong Heok et al. (Reference Yeong Heok, Jeong-Dae and Youn-Chul2012), were preferred for this study. Their research found that managing two to three aircraft on the radar screen resulted in the highest SA scores (6 ⋅ 15 as measured by SART) and the lowest workload (3 ⋅ 81 as measured by the NASA-Task Load Index (NASA-TLX)), compared to scenarios involving more than five aircraft. This research specifically focused on flight monitoring through the radar-map interface to effectively simulate authentic air traffic interactions without encompassing broader ATCO responsibilities such as conflict resolution and flight-level assignments, mitigating workload impacts effectively. In this study, three flights, each assigned unique information tags and exhibiting dynamic airspeed, heading, and flight levels, moved continuously along real-world flight routes within the approach sector in 07 configuration in Hong Kong SAR, as shown in Figure 2(a).
(a) The Hong Kong SAR approach sector ATC scenario in 07 configuration; (b) the 32-channel EEG electrode placement is based on a 10-10 international system

Similar to Kästle et al.'s (Reference Kästle, Anvari, Krol and Wurdemann2021) tasks, the type, position and movement direction of the moving objects within the grid were measured as the three SA levels after dynamic visual tracking, realised via PEBL (psychology experiment building language) software. The SAGAT approach was employed to establish the SA-probe tests with three distinct goals in this work. In SAGAT, simulations must be momentarily paused to enable participants to respond to queries concerning the current situation, such as the position of objects, with the accuracy or discrepancy in these responses serving as measures of participants’ SA levels (Lu et al., Reference Lu, Happee and de Winter2020). Adopting SAGAT's freeze-frame approach offered the benefits of simplicity of implementation and enhanced accuracy in SA measurement. Given that this was in the preliminary phase of the experiment-exploration investigation, with the primary objective of calibrating psychophysiological data, utilisation of this technique was deemed to impact the study's outcomes only minimally. In view of real-world ATCOs’ situations, three SA-probe tests were designed, which involved identifying flight's ‘Callsign’ (i.e. callsign identification), ‘Position’ (i.e. flight coordinate awareness), and ‘Heading’ (i.e. flying direction awareness of movement within the ATC sector):
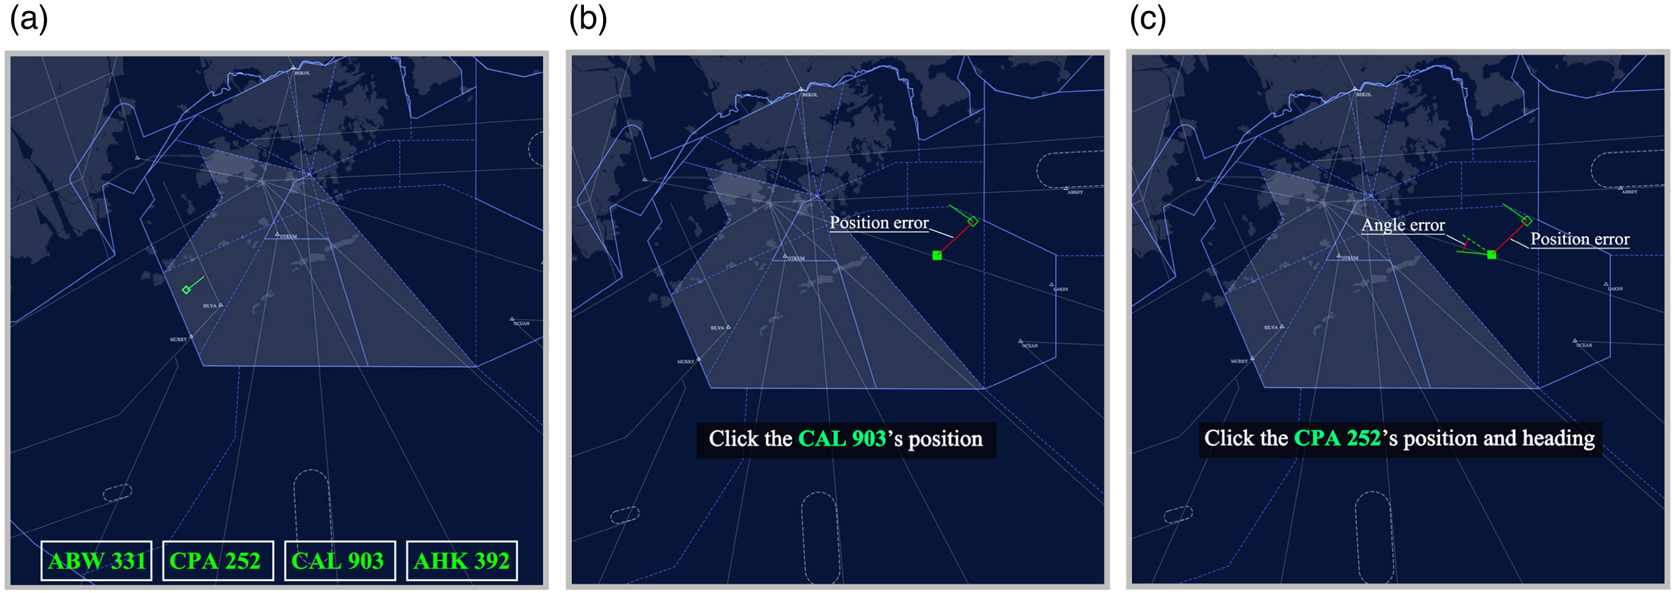
1. To evaluate level-1 (perception), subjects were asked to choose the ‘Callsign’ of a flight located on a given position from the selection of answers on the screen (see Figure 3(a)). A binary value (true or false) was recorded, specifying whether the given flight was identified correctly.
2. To test the degree of participants’ comprehension of the situation (level-2), they were asked to mark the last ‘Position’ of the given callsign flight (Figure 3(b)). Only by combining this with the flight's callsign information could participants accordingly identify the ‘Position’ of the given callsign flight, and the average position error (pixels) was output.
3. Unlike the above comprehension test, to investigate the participant's projection of the future state of the situation (level-3), they were asked to identify the ‘Heading’ at the precise moment of responding (the flight had disappeared, but continued to move). Subjects needed to click on the flight's current position first and then mark its current heading (Figure 3(c)), outputting the position and angular errors (degrees).
(a) The ‘Callsign’ test for evaluating an aircraft's callsign; (b) the ‘Position’ test for assessing the aircraft's callsign and position simultaneously; and (c) the ‘Heading’ test is for testing an aircraft's callsign, position, and heading

2.2.3 Experiment protocol
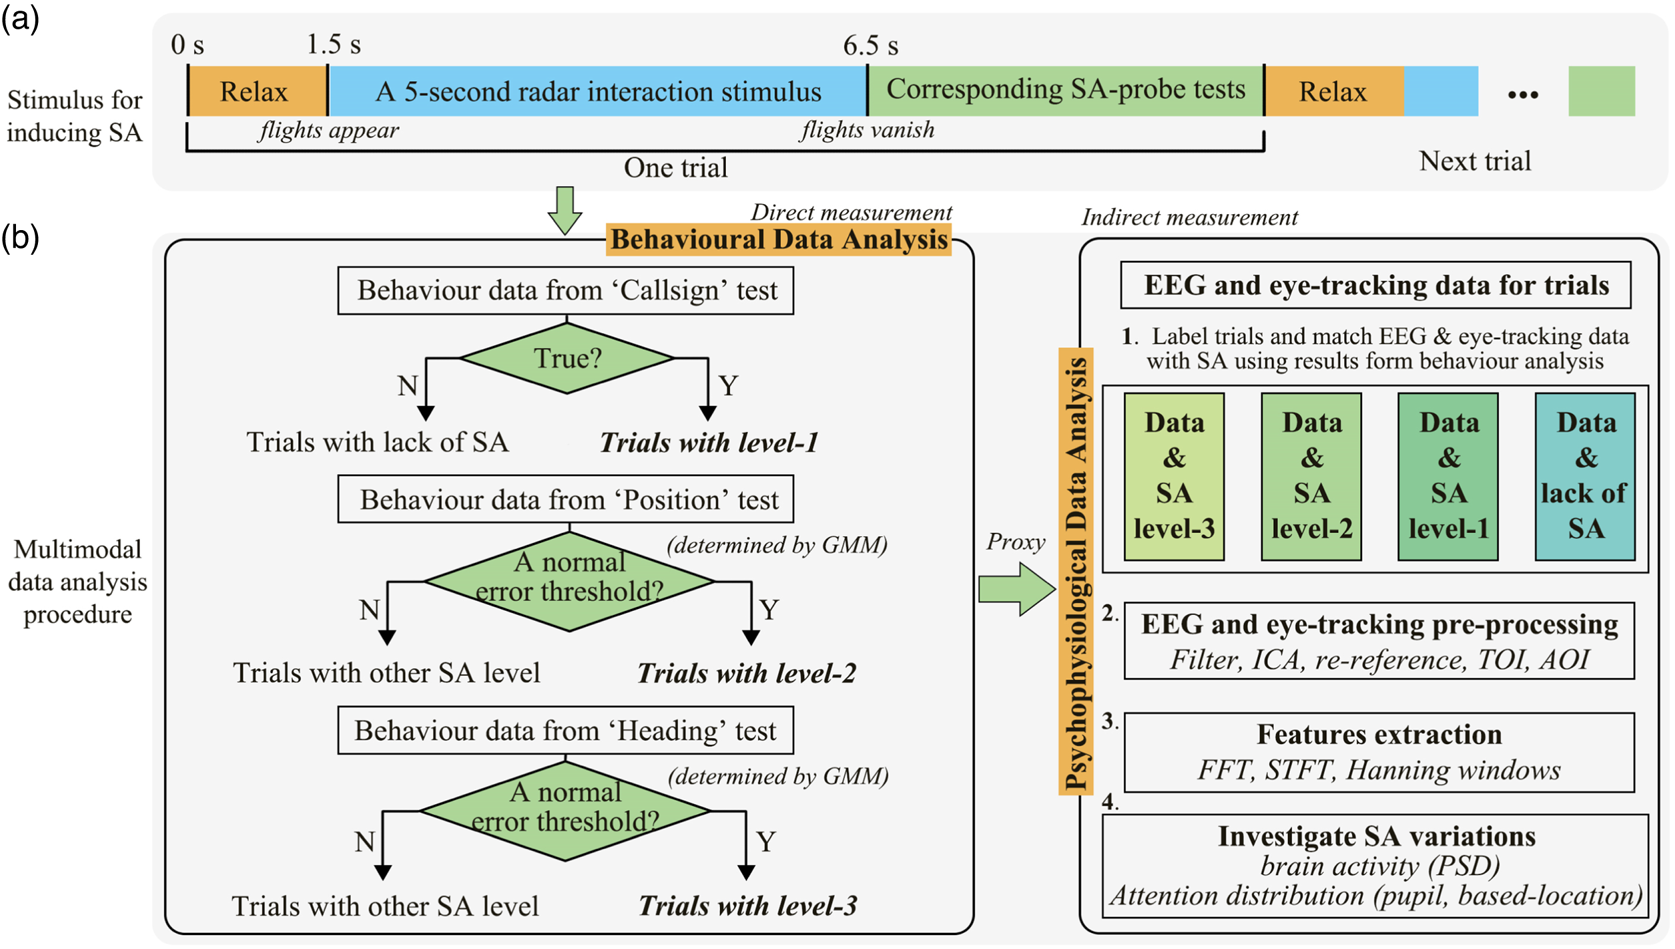
The experiment, carried out using E-prime 3.0 software, consisted of five blocks plus a practice session to familiarise participants with the experimental operations. In the practice session, participants were instructed to perform the full-scale experiment scenario and were corrected if any errors occurred. There were a total of 5 blocks, including 125 trials, with 4 intervals of 5-min breaks between each block to mitigate mental fatigue. In blocks 1–3, there were 25 consecutive trials of the same evaluation, and the participant was informed of the question type before watching the experimental simulations (75 trials in total). Blocks 4–5 comprised a total of 50 trials presented in a random order, including 20 trials of the ‘Callsign’ assessment and 15 trials each of the ‘Position’ and ‘Heading’ assessments; participants were notified of the question type before each trial. The experiment scenario was activated for 5 s after a 1 ⋅ 5-s relaxation period in each trial, after which all flights vanished, and the corresponding SA-probe test subsequently appeared to test participants’ awareness (Figure 4(a)). The decision to set the scenario activation duration at 5 s was made after conducting a series of tests to ensure the readability and completeness of the information presented. If they were unable to respond to relevant questions, participants were allowed to skip one or more probes by pressing the ‘SPACE’ key to prevent useless data.
Multimodal strategy analysis procedure

Furthermore, participants were required to complete a modified version of the NASA-TLX questionnaire after blocks 1–3. It is a widely recognised tool for the subjective assessment of perceived workload. The ‘physical demand’ component was removed due to the absence of physical movement within the experiment; the ‘difficulty feeling’ item was conversely introduced to evaluate whether there was consistency in the experimental design from a subjective aspect. Hence, subjective feedback was obtained using the modified NASA-TLX that encompassed six dimensions: mental demand, temporal demand, performance, effort, frustration, and difficulty feeling.
2.2.4 Apparatus deployment
E-prime 3.0 software was used to present the experimental scenarios and record behavioural data (binary value, position errors and angular errors) from the SA-probe tests. The experiment protocol was presented on a 27-inch monitor with a screen resolution of 1920*1080 pixels, and the real-time data collection window was displayed on another 27-inch monitor for researcher observation. A compact screen-based eye-tracker (Tobii Pro Fusion) with a frequency of 256 Hz was deployed on the bottom of the screen to record attentional distribution. Moreover, a 32-channel EEG headset with saline electrodes (EMOTIV Flex) was used to measure participants’ brain activity at 128 Hz. The EEG channels were placed according to the international 10–20 system (Figure 2(b)), which covers the frontal, parietal, temporal and occipital lobes.
2.3 Data pre-processing and component analysis
2.3.1 Indicators for measuring SA
In each trial, (i) three kinds of behavioural data (direct measurement) were extracted. According to the ‘direct-proxy-indirect measurement’ framework, behavioural data were first used/clustered to distinguish this trial's SA levels (see Section 2.3.2). Following this, both (ii) EEG and (iii) eye-tracking data (indirect measurement) within 1 ⋅ 5–6 ⋅ 5 s for that trial were selected. The sampling rates for the EEG and eye-tracking ensured the collection of 128 and 256 data points per second, respectively, thereby ensuring that a 5-s data stream was sufficient for subsequent analysis. Upon correlating with direct behavioural results (proxy), the indirect indicators, including the PSD and time–frequency (EEG), and the fixation-related (without partial fixation), saccades, and pupil size (eye-tracking), were used to investigate SA variations. (iv) The NASA-TLX scale was also calculated to reveal the subjective workload towards the three kinds of task.
2.3.2 Behavioural data analysis
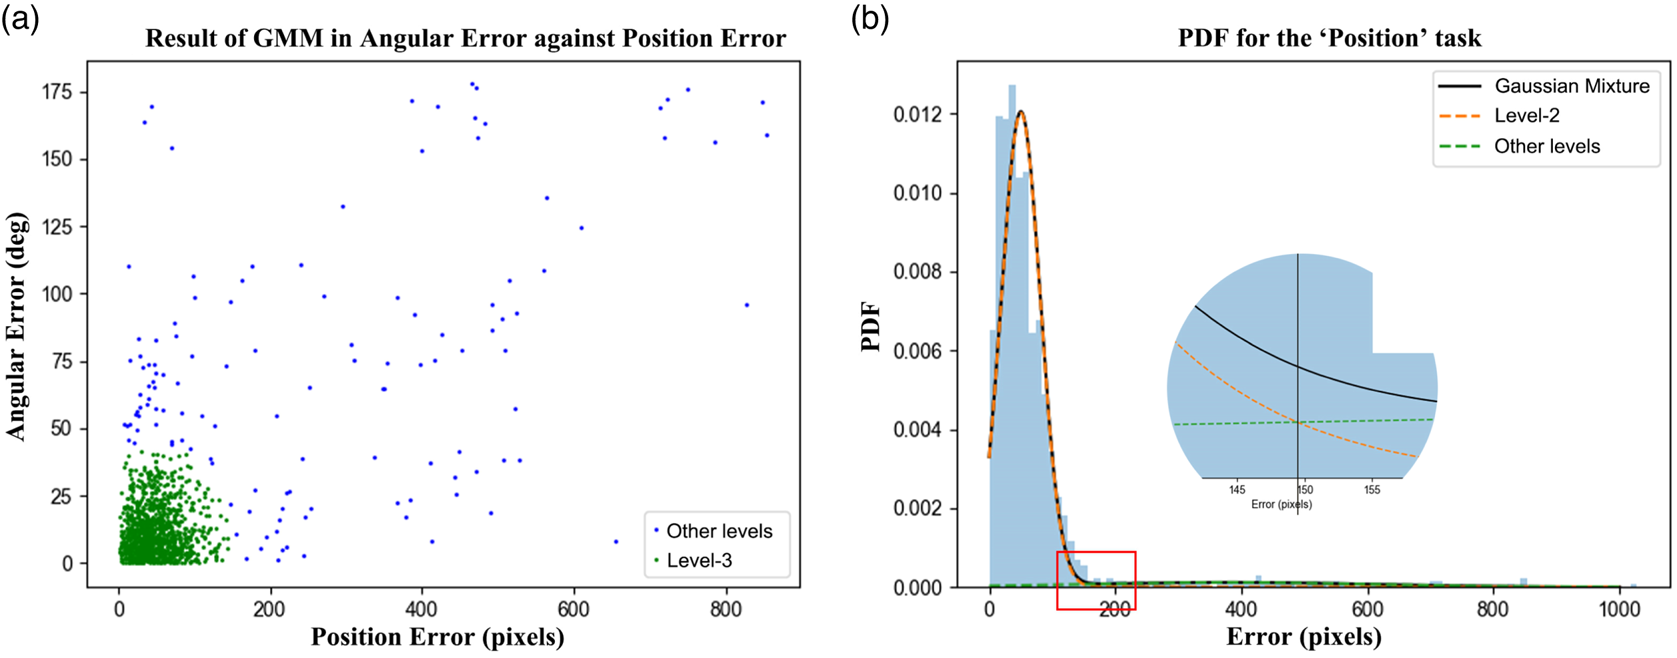
In cases where participants successfully responded to the probes, it is possible that their decisions were made by chance rather than through an informed understanding of the situation. For example, a higher error corresponds to a higher deviation from the ground truth in the ‘Heading’ test, which indicates a lack of SA level-3. Given that position/angular errors represent continuous data, unsupervised learning techniques (GMM, here) were used to cluster behaviour data to determine the boundary (a normal error threshold) between correct and incorrect samples. The multimodal data analysis procedure and how to measure SA are shown in Figure 4.
A two-component GMM was used to cluster behavioural data in this paper. GMM is a probability approach used to estimate the probability density of data points using finite mixtures of Gaussian distributions, which extends a single Gaussian probability density function (PDF; Claramunt and Fujino, Reference Claramunt and Fujino2023). A classification situation can be solved using the different parameters of the PDF, where the data in the same set contain multiple different distributions. Here, the ${\rm K}$ value is 2, that is, incorrect SA and correct SA in the ‘Position’ and ‘Heading’ situations, as given in Equation (1). The ${\pi _\kappa }$
 is the mixture coefficient (see Equation (2)). At the first step, the sample mean and variance could be used as the estimated values of ${\mu _\kappa }$
 and ${\sum _\kappa }$
 , respectively. Subsequently, the expectation maximisation algorithm was used to establish the parameters of GMM based on estimated values. For the ‘Callsign’ test, if it was true, the trials can be classified into level-1.


2.3.3 Psychophysiological data alignment and pre-processing
After analysing behavioural data, all the trials were labelled to correspond with specific SA levels. The EEG and eye-tracking datasets obtained across all trials could then be manually aligned with SA labels with the assistance of behavioural proxies for further extraction processing. The EEG data were processed as below using the EEGLAB toolbox under MATLAB R2013b:
• Data filtering using a basic FIR (finite impulse response) filter, with the lower edge of the frequency pass band set to 0 ⋅ 5 Hz and the higher edge set to 50 Hz. The notch filter was applied to remove power line interference.
• Epoch extraction was conducted according to the stimulus onsets, ranging from −1 ⋅ 5 to 5 s, with −1 ⋅ 5–0 s as the baseline and 0–5 s as the task response.
• Interpolation channels from neighbouring channels using a spherical spline method if a channel has more than 20% of data above an amplitude threshold of 200 $\mu V$
 over the entire recording.
• Artefacts and components such as blinking and head movement were identified using ICA, and principal component analysis was set to 30 channels due to interpolation channels.
• The non-ideal ICA components were deleted through visual inspection and re-reference electrodes by computing average reference.

The eye-tracking data were pre-processed using the Tobii I-VI (Fixation) filter, a technique applied to extract fixation-related information from gaze points facilitated by the Tobii Pro Lab software. A moving median with a window size of three samples was used to diminish noise. The velocity calculator's window length was $20\,\rm{ms}$ , and the I-VI classifier's threshold was $30\rm{\; }^\circ \rm{/s}$
 . A short fixation of below $60\,\rm{ms}$
 was discarded, and the adjacent fixations with the maximum time between fixation being $75\,\rm{ms}$
 and the maximum angle between fixation being 0 ⋅ 5° were merged.
2.4 SA performance-related feature extraction
2.4.1 Spectral transformation
Frequency-domain analysis for EEG data was conducted to extract EEG-based indicators. The PSD of different EEG bands ($\delta$ , $\theta$
 , $\alpha$
 , $\beta$
 , $\gamma$
 ), the most widely used EEG features, were calculated to give information on the amplitude distribution of various frequency bands across the brain (Jung et al., Reference Jung, Makeig, Stensmo and Sejnowski1997; Sanei and Chambers, Reference Sanei and Chambers2013). FFT was used to extract the frequency spectrum for all EEG pipelines by superposing the sine function. FFT was based on the discrete Fourier transform of the original time domain, and the frequency information was calculated at each frequency band via MATLAB internal ‘fft’ function during the 5-s duration per trial.
In addition, the frequency spectrum obtained from FFT is global, and the local characteristics cannot be reflected in the time dimension. Therefore, the STFT function was also used to illustrate time–frequency information. STFT can improve the robustness against noise using Hanning windows functions of equal length (0 ⋅ 3 s here). The Hanning window moves on the time axis according to the sampling point, and FFT calculations were then completed in each window.
2.4.2 Eye-tracking metric extraction
The raw eye-tracking data (gaze points) were separated into fixations, the periods when the eye is held aligned with a target for a set duration, and saccades, which occur between two or more fixations. To obtain these eye-tracking metrics, time of interest (TOI) was defined at first for each trial. Here, each trial's TOI was set at a 5-s simulation duration. The area of interest (AOI) was established within the full-screen area in each trial because of actual demand in real-world applications.
2.5 Statistics tests
The EEG and eye-tracking metrics associated with the different SA levels were obtained after the proposed multimodal procedure and then compared between three levels using IBM SPSS Statistics v.23.1, verifying the feasibility of investigating SA changes using psychophysiological indicators. The Shapiro–Wilk test was adopted to test the similarity of data with the normal distribution, and box plots were used to determine the presence of abnormal values. Then, a one-way repeated-measures analysis of variance (ANOVA; for normal distribution dataset) or Friedman test (for non-normal distribution dataset) with three SA levels and pairwise comparison with each 2-pair (i.e., level-1 vs. level-2, level-1 vs. level-3, and level-2 vs. level-3) were conducted on all dependent measures after outlier detection and spherical assumptions. For multicomparisons, Bonferroni corrections were employed, and partial eta-squared ($n_p^2$ ) was utilised as a measure of effect size. Additionally, the Mann–Whitney U was used to reveal whether gender affected these dependent variables. The significance for all statistics tests was set at P < 0.05.
3. Results
Due to poor quality eye-tracking data resulting from equipment connection issues affecting three participants, the analysis was ultimately conducted on data from 28 participants.
3.1 Behavioural response clustering
Trials from the ‘Callsign’ test were removed from consideration if the answers to ‘Callsign’ queries were categorised as 0, indicating that the responses failed to identify the callsign accurately. For the ‘Position’ test, an analysis determined that a position error threshold of 149 ⋅ 4 pixels effectively differentiated trials at SA level-2 from those at other SA levels, based on a two-component GMM analysis (as shown in Figure 5(b)). Following the analysis for the ‘Heading’ test, trials with SA level-3 could be established if they matched the green items in Figure 5(a). There were no significant differences in error between male and female participants after the Mann–Whitney U test (P > 0 ⋅ 05).
Two-component GMM was used on (a) ‘Heading’ and (b) ‘Position’ tests to identify the threshold for two situations of SA

3.2 Brain physiological activities
3.2.1 PSD analysis on various frequency bands
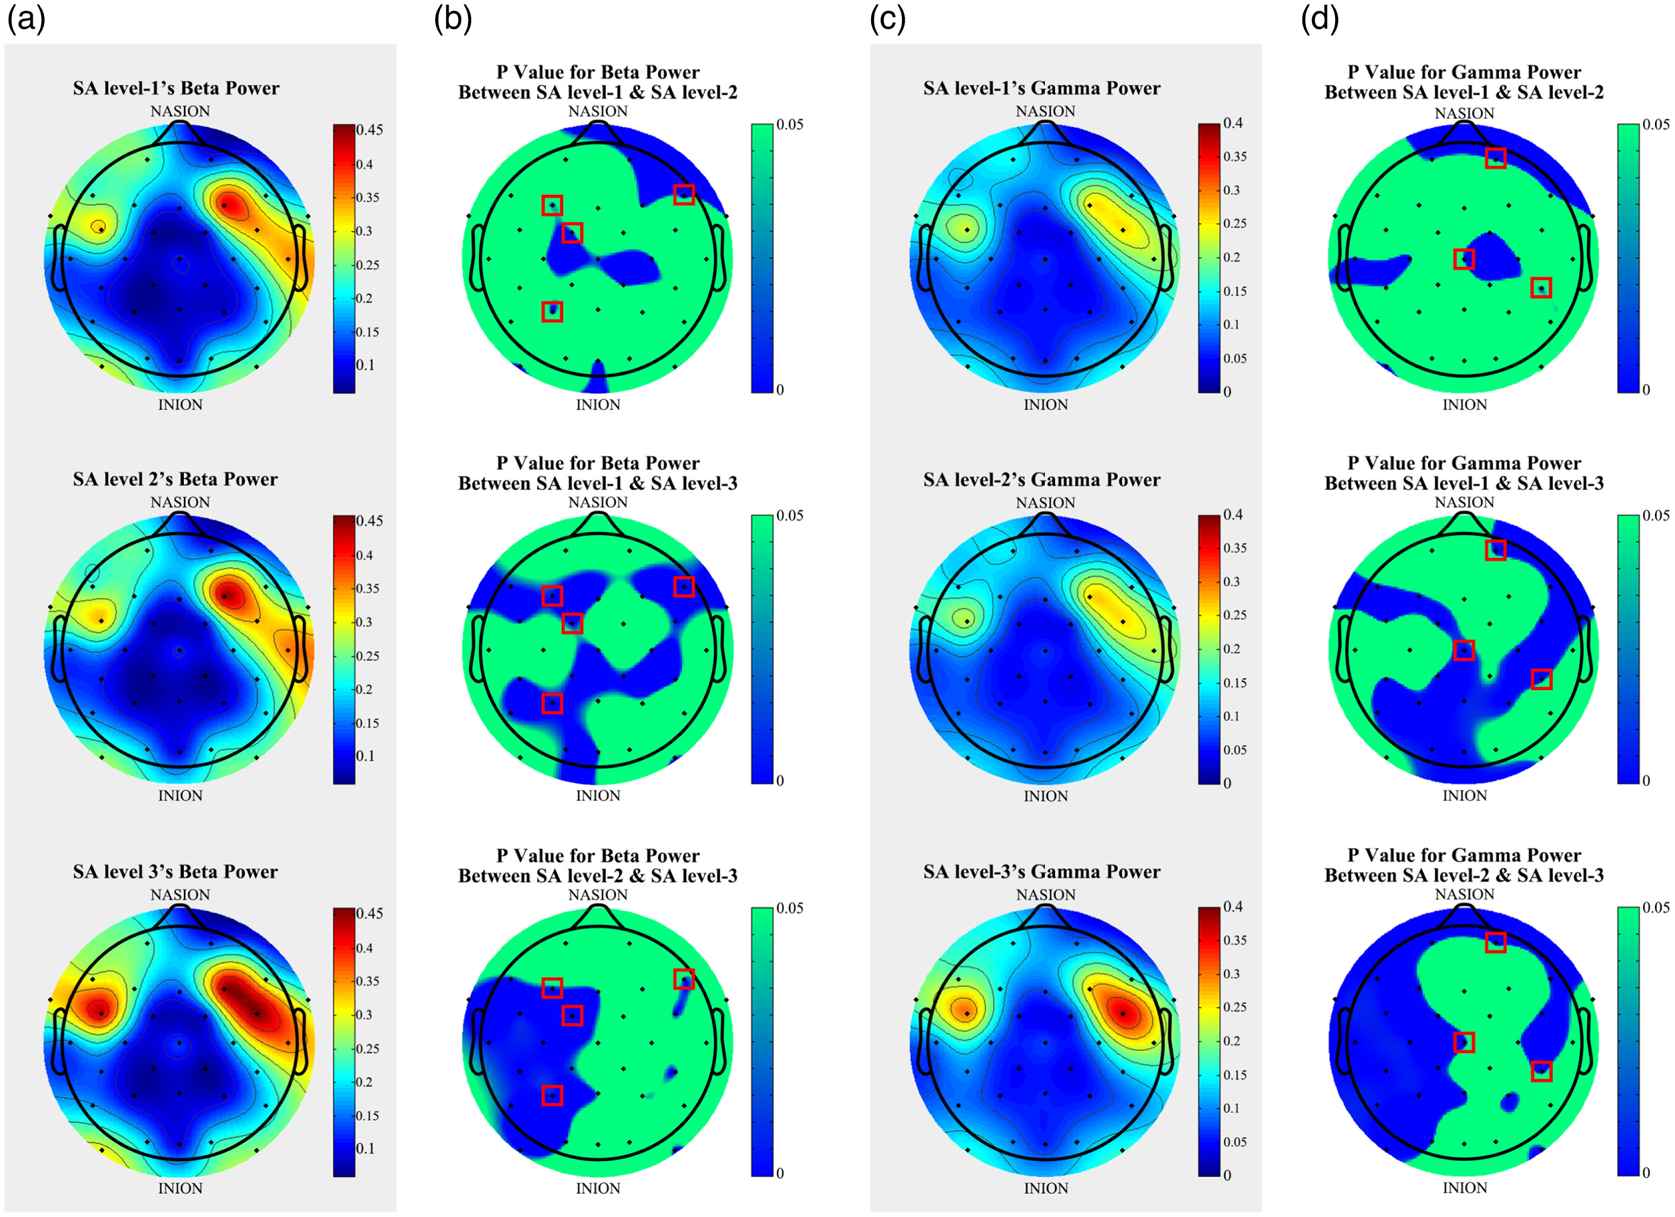
The EEG results are shown in Figure 6(a) following the multimodal strategy procedure. The highest PSD occurred in channel-FC6, which is in the frontal lobe, at 0 ⋅ 458 $\mu {V^2}\rm{/}Hz$ during the trials with level-3 within $\beta$
 . In addition, statistical differences were tested using a one-way repeated-measures ANOVA, which showed that channel-F3, -FC1, -F8 and -P3, which are located in the frontal lobe and the parietal lobe, had significant differences: $F\rm{ = }21.583,\rm{\; }P\mathrm{\ < }0.001$
 , $F\rm{ = 4}1.686,\rm{\; }P\mathrm{\ < }0.001$
 , $F\rm{ = }15.323,\rm{\; }P\mathrm{\ < }0.001$
 , and $F\rm{ = }28.651,\rm{\; }P\mathrm{\ < }0.001$
 respectively. The pairwise comparison results showed that the PSD with level-3 was higher than that with level-2 (P < 0 ⋅ 001) and level-1 (P < 0 ⋅ 001), and the PSD with level-2 was higher than that with level-1 (P = 0 ⋅ 037) in channel-F3. A significant difference was discovered between each of the two tests in channel-FC1: ${P_{\rm{level\; 1\; \& \; level\; 2}}}\rm{ = }0.002$
 , ${P_{\rm{level\; 1\; \& \; level\; 3}}}\mathrm{\ < }0.001$
 , and ${P_{\rm{level\; 2\; \& \; level\; 3}}}\mathrm{\ < }0.001$
 . Further results were ${P_{\rm{level\; 1\; \& \; level\; 2}}}\rm{ = }0.029$
 , ${P_{\rm{level\; 1\; \& \; level\; 3}}}\mathrm{\ < }0.001$
 , and ${P_{\rm{level\; 2\; \& \; level\; 3}}}\rm{ = }0.013$
 in channel-F8 and ${P_{\rm{level\; 1\; \& \; level\; 2}}}\rm{ = }0.008$
 , ${P_{\rm{level\; 1\; \& \; level\; 2}}}\mathrm{\ < \;\ }0.001$
 , ${P_{\rm{level\; 2\; \& \; level\; 3}}}\mathrm{\ < \;\ }0.001$
 in channel-P3 (Figure 6(b)).
(a) PSD in three SA levels at $\beta$ ; (b) comparison results between three SA levels at $\beta$
 ; (c) PSD in different SA levels at $\gamma$
 ; and (d) comparison results between three SA levels at $\gamma$


In terms of $\gamma$ , channel-FC6 also had the highest PSD at 0 ⋅ 367 $\mu {V^2}\rm{/}Hz$
 . Channel-CP6 (F = 11 ⋅ 844, P < 0 ⋅ 001), -Cz (F = 18 ⋅ 340, P < 0 ⋅ 001), and -Fp2 (F = 17 ⋅ 871, P < 0 ⋅ 001) differed significantly between the three SA levels. As shown in Figure 6(c), the PSD in the ‘Heading’ test had significant increases in channel-CP6 (${P_{\rm{level\; 1\; \& \; level\; 3}}}\mathrm{\ < \;\ }0.001$
 , ${P_{\rm{level\; 2\; \& \; level\; 3}}}\rm{ = \; }0.041$
 ) at 0 ⋅ 126 $\mu {V^2}\rm{/}Hz$
 ; channel-Cz (${P_{\rm{level\; 1\; \& \; level\; 3}}}\mathrm{\ < \;\ }0.001$
 , ${P_{\rm{level\; 2\; \& \; level\; 3}}}\rm{ = \; }0.002$
 ) with 0 ⋅ 069 $\mu {V^2}\rm{/}Hz$
 ; and channel-Fp2 (${P_{\rm{level\; 1\; \& \; level\; 3}}}\mathrm{\ < \;\ }0.001$
 , ${P_{\rm{level\; 2\; \& \; level\; 3}}}\rm{ = \; }0.042$
 ) at 0 ⋅ 089 $\mu {V^2}\rm{/}Hz$
 in comparison to the other two tests. Similarly, the PSD of the trials with level-2 was greater when compared to that with level-1 in channel-CP6 (${P_{\rm{level\; 1\; \& \; level\; 2}}}\rm{ = \; }0.039$
 ), -Cz (${P_{\rm{level\; 1\; \& \; level\; 2}}}\rm{ = \; }0.028$
 ), and -Fp2 (${P_{\rm{level\; 1\; \& \; level\; 2}}}\mathrm{\ < \;\ }0.001$
 ). However, there were no significant increases or decreases between the three SA-probe tests for the $\delta$
 , $\theta$
 , or $\alpha$
 band power. Nor was gender found to affect the EEG-based activity across the five waves among the three SA situations (all P > 0 ⋅ 05 tested by the Mann–Whitney U).
3.2.2 Point-by-point frequency-domain analysis
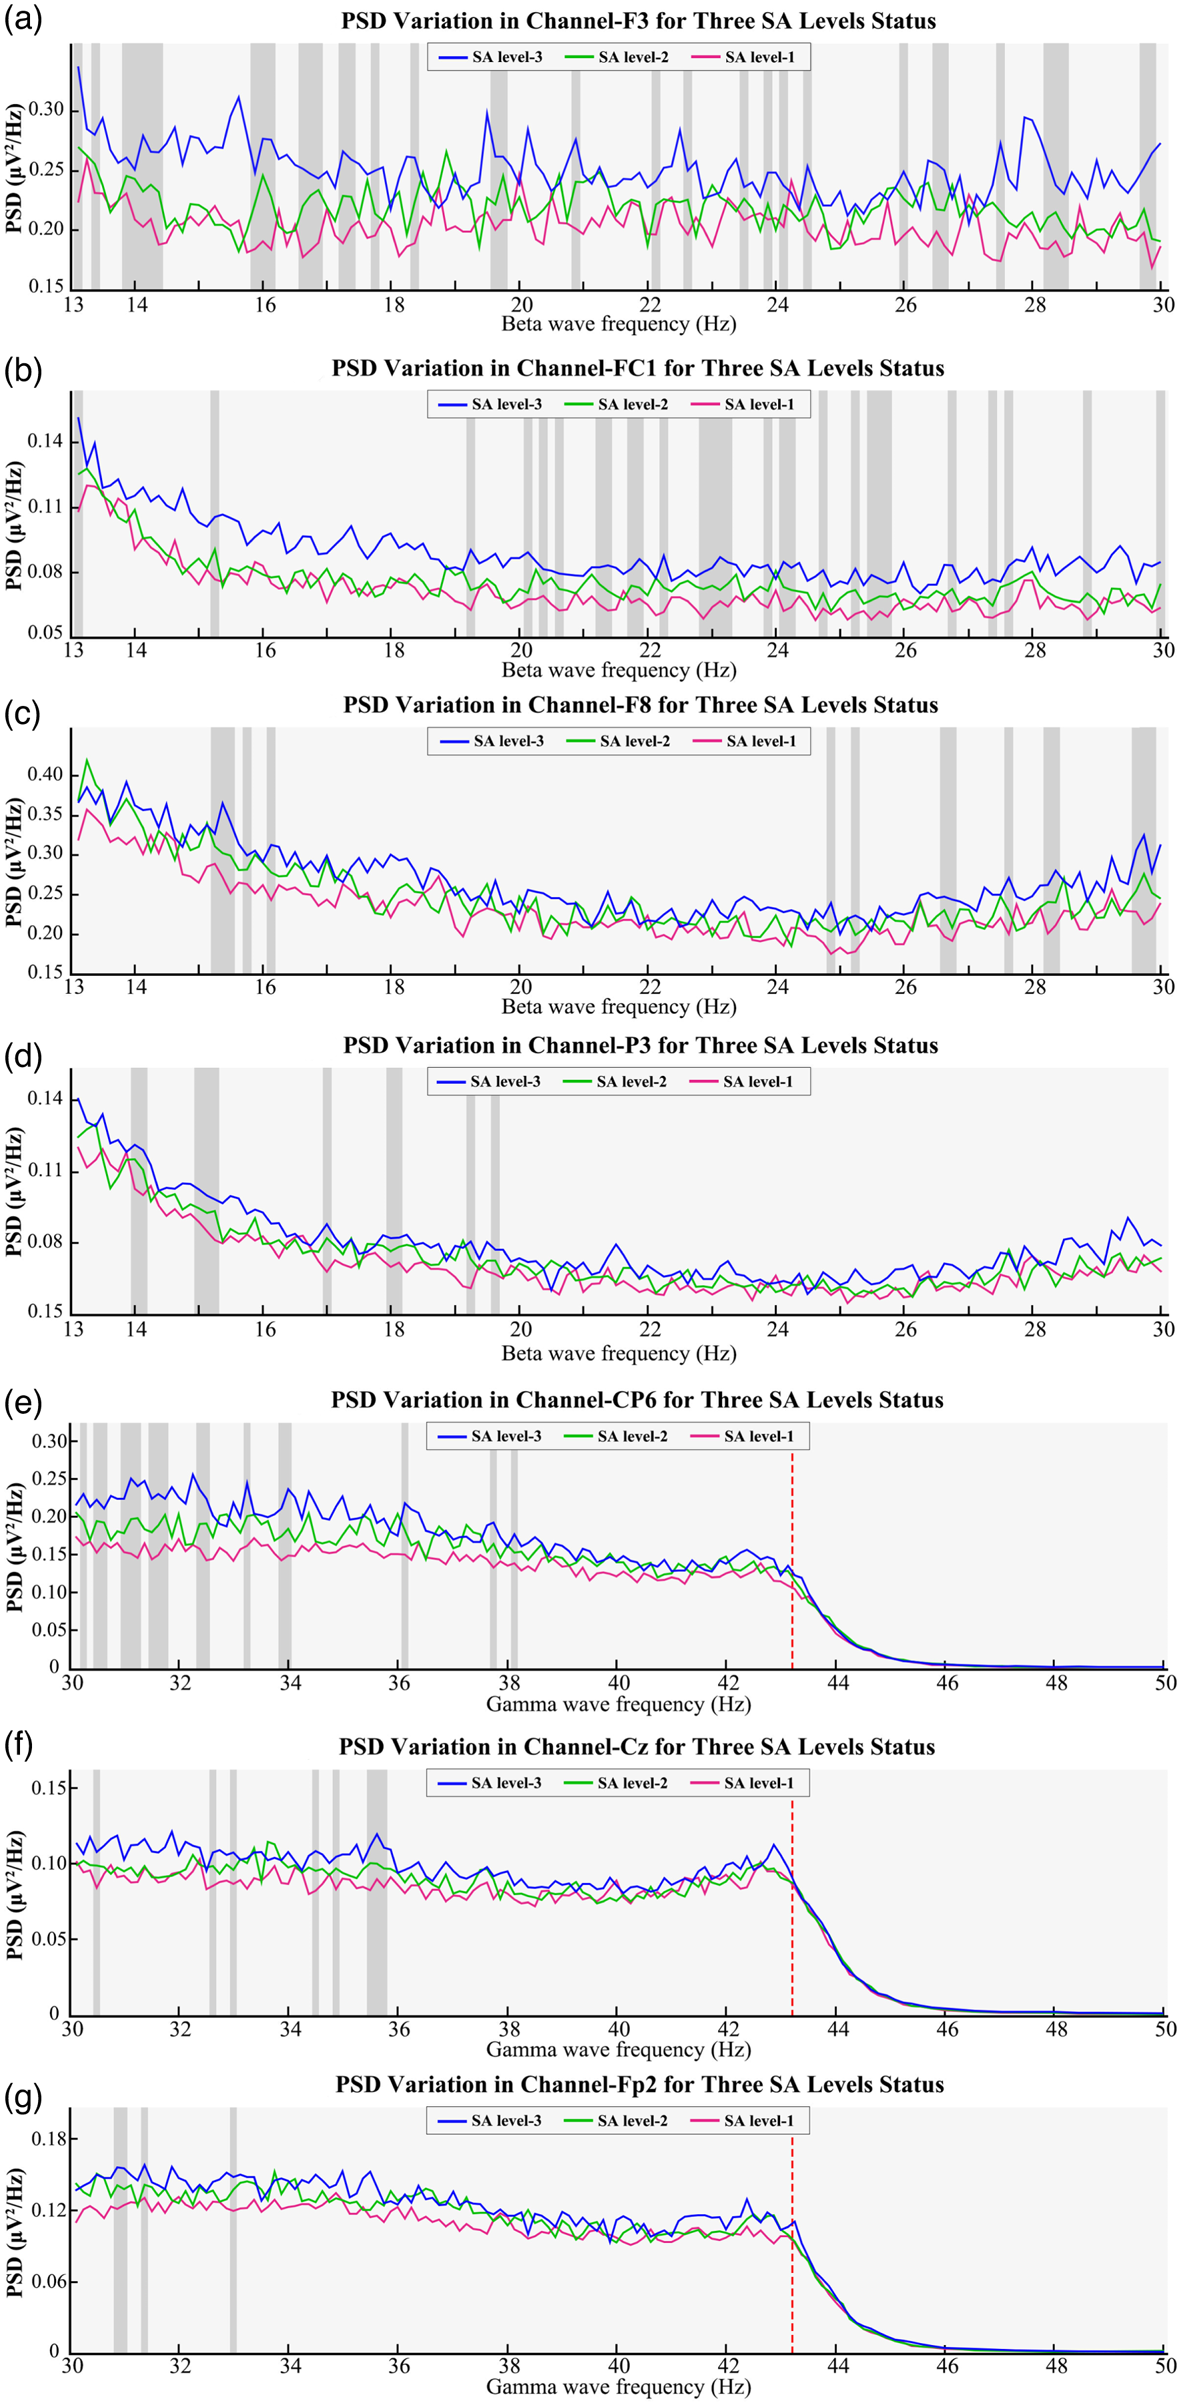
Figure 7 shows the results of the point-by-point PSD analysis. For the $\beta$ power band, the frequencies of interest (FOIs) that had significant changes between the three SA levels were almost uniformly distributed in channel-F3, particularly in ‘low’ $\beta$
 power band (about 13, 14, and 16 Hz) and 26–29 Hz. The FOIs occurred in channel-F8 at both the ‘low’ $\beta$
 power band (nearly 15–16 Hz) and the ‘high’ $\beta$
 power band (about 26–30 Hz). Furthermore, there were several FOIs in channel-FC1 that occurred in the ‘medium’ $\beta$
 power range of 20–26 Hz and fewer FOIs in the ‘low’ $\beta$
 power band of around 14 and 15 Hz in channel-P3 located in the parietal lobe. For $\gamma$
 , changes in channel-CP6 were found in the FOIs from roughly 30 to 34 Hz. There were fewer significant discrepancies between the three tests in channel-Cz and -Fp2 at about 35 Hz and the ‘low’ $\gamma$
 power band, respectively. None of the channels were able to distinguish the experimental tests based on PSD from 43 Hz.
(a)–(d) PSD changes within $\beta$ in F3, FC1, F8, and P3 channels; (e)–(g) PSD changes within $\gamma$
 in the CP6, Cz, and Fp2 channels. The grey block highlights the frequency points that can be used to distinguish various SA levels under each channel

3.2.3 Time–frequency analysis
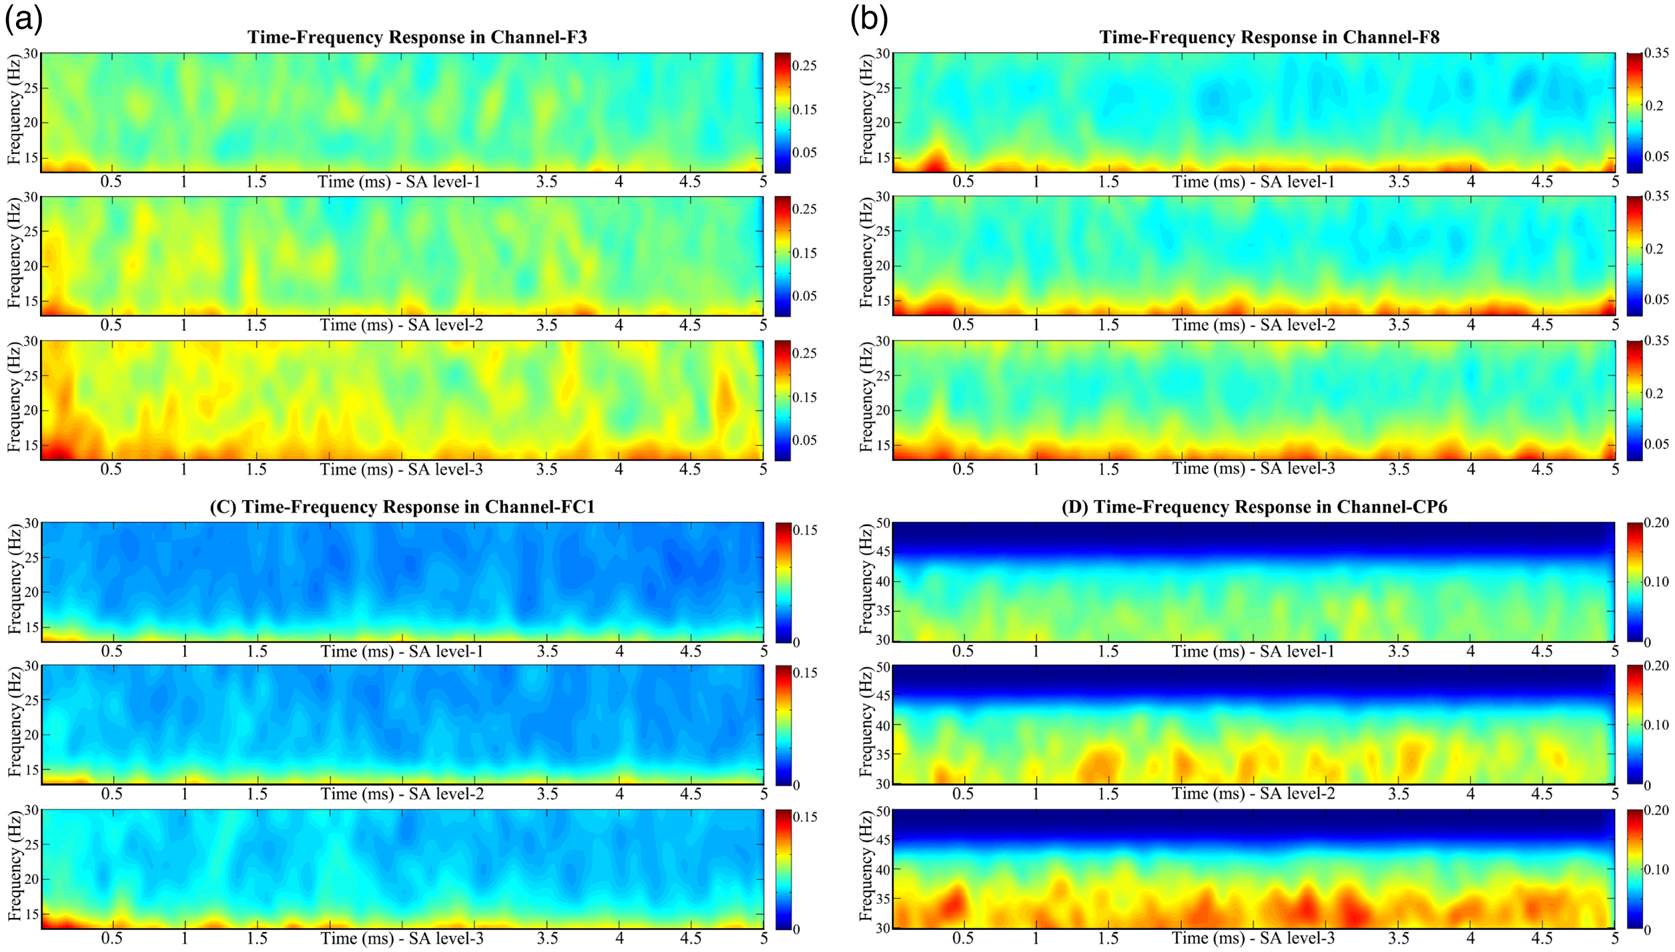
To monitor the brain activity changes across time, time–frequency analysis was completed to observe PSD changes with time series. The results for the channels with prominent features are shown in Figure 8. Although the FOIs with significant differences in channel-FC1 were detected at the ‘medium’ $\beta$ power range (Figure 7(b)), only the PSD within 0–2 ⋅ 5 s at 20–26 Hz power primarily revealed a discrepancy. The PSD discrepancy at 20–25 Hz power in channel-F8 mainly occurred between 1 ⋅ 5 and 5 s (Figure 8(b)). However, the disparity could almost be monitored throughout the simulation at 15 Hz. In addition, the differences between the three SA tests could be detected throughout the entire 5 s at the ‘low’ $\beta$
 power band as well as the ‘high’ $\beta$
 power band in channel-F3.
Time–frequency analysis for (a) channel-F3, (b) channel-F8, (c) channel-FC1 at $\beta$ power, and (d) channel-CP6 at $\gamma$
 power

A time–frequency analysis of channel-CP6 was additionally completed to reveal PSD variation along with $\gamma$ . There were differences in PSD at the 30–35 Hz power range between the three SA levels over 5 s, with the brain physiological response at around 3 s being the most active. The most active PSD happened at the beginning of the simulation in the frontal lobe channels.
3.3 Eye-tracking performance
3.3.1 Fixation/saccade-related metrics
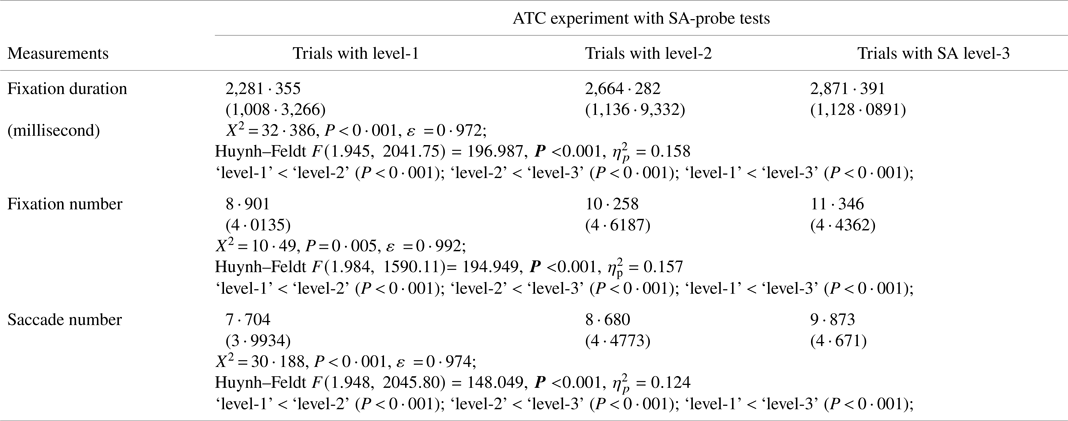
As shown in Table 1, there was a significant discrepancy between the three SA levels in terms of fixation duration without partial fixation ($F\rm{ = }196.987,\rm{\; }P\mathrm{\ < }0.01$ ), fixation number without partial fixation ($F\rm{ = }194.949,\rm{\; }P\mathrm{\ < }0.01$
 ), and saccades number in the AOI ($F\rm{ = 1}48.049,\rm{\; }P\mathrm{\ < }0.01$
 ). Pairwise comparisons revealed that the fixation duration (mean = 2,871 ⋅ 391; SEM (standard error of the mean) = 34.797), fixation number (mean = 11 ⋅ 346; SEM = 0 ⋅ 136) and saccade number (mean = 9 ⋅ 873; SEM = 0 ⋅ 144) in level-3 were the highest compared with the other two instances.
Summary statistics of eye-tracking indicators with SA

3.3.2 Pupillometry
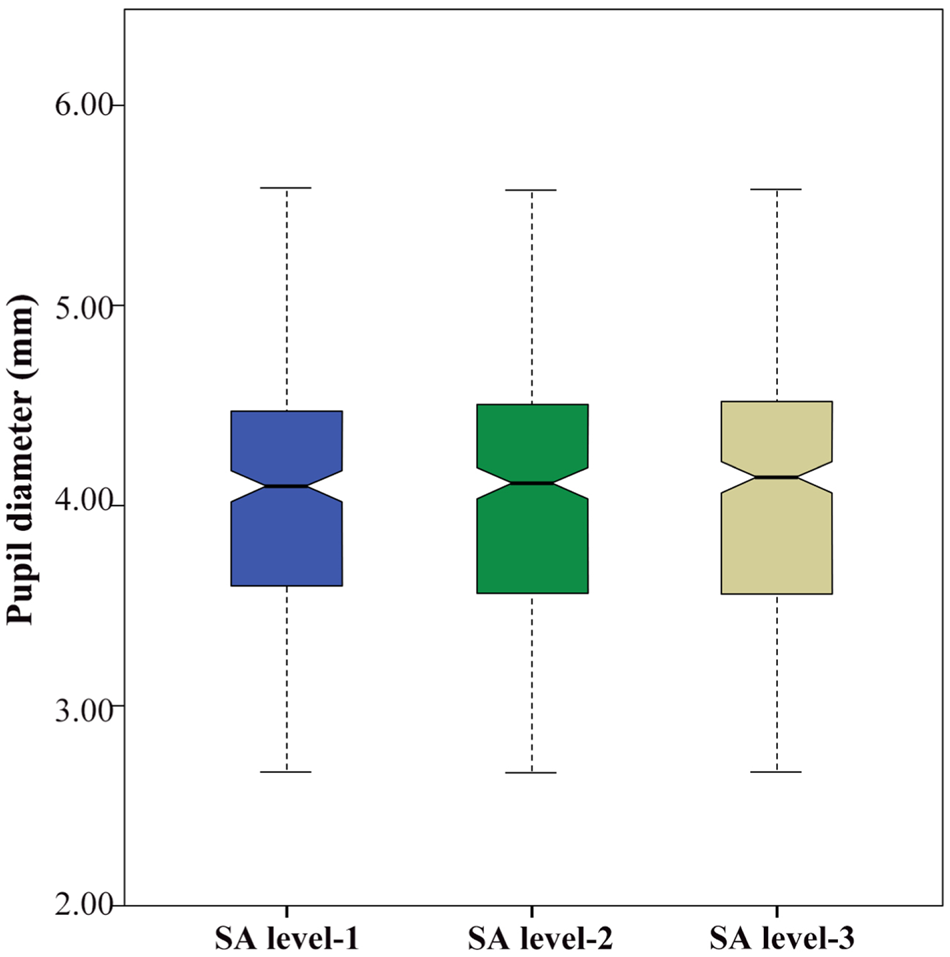
The distribution of pupil diameter violated the sphericity assumption (${X^2}$ = 50 ⋅ 103, P < 0 ⋅ 001), with epsilon ($\varepsilon$
 ) equalling 0 ⋅ 960. Hence, Huynh–Feldt correction was used to test significance. Overall, there was a significant difference in measured average pupil diameter between the three SA levels: $F({1.919,\rm{\; }2145.634} )$
 = 35 ⋅ 709, P < 0 ⋅ 001, $\eta _p^2\rm{ = }0.031$
 after ANOVA. Pairwise comparisons revealed that in level-3, the mean pupil size (mean = 4 ⋅ 067; SEM = 0 ⋅ 0191) was significantly larger than in level-2 (mean = 4 ⋅ 056; SEM = 0 ⋅ 0190) and level-1 (mean = 4 ⋅ 042; SEM = 0 ⋅ 0183) with both P < 0 ⋅ 001. Furthermore, the measured pupil size was also significantly larger in level-2 than in level-1 (P < 0 ⋅ 001) (Figure 9). All eye-tracking indicators were unaffected by gender variables (P > 0 ⋅ 05).
The box plot of pupil diameter during three SA-probe situations

3.4 Subjective measurement findings
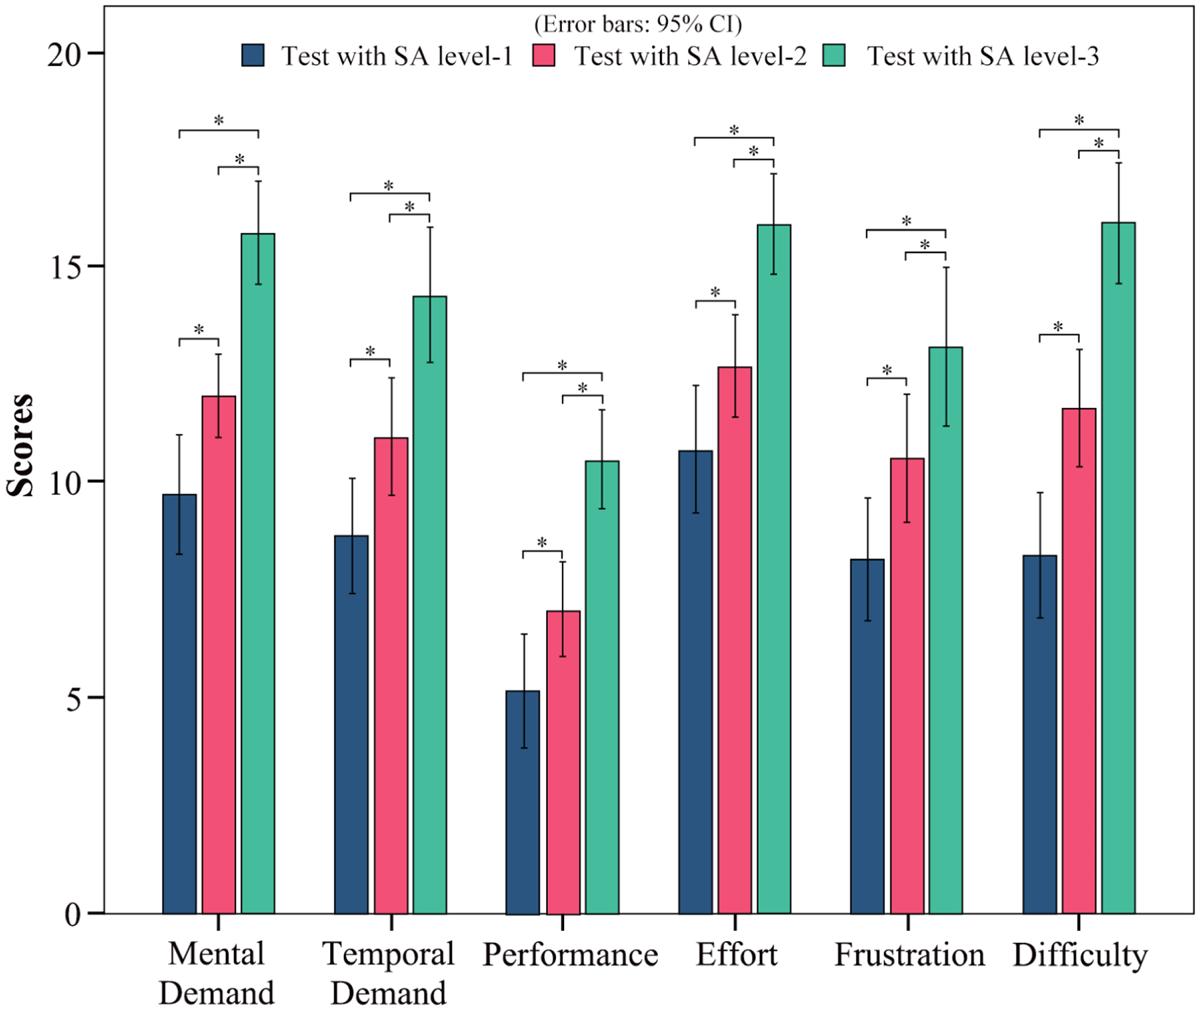
The Friedman test, suitable for scenarios with non-normal distributions, was used to evaluate subjective scores. There were considerable increases from level-1 to level-3 in mental demand (${X^2}$ = 42 ⋅ 125, P < 0 ⋅ 001, df = 2), temporal demand (${X^2}$
 = 46 ⋅ 935, P < 0 ⋅ 001, df = 2), effort (${X^2}$
 = 43 ⋅ 393, P < 0 ⋅ 001, df = 2), frustration (${X^2}$
 = 39 ⋅ 436, P < 0 ⋅ 001, df = 2) and difficulty (${X^2}$
 = 56 ⋅ 876, P < 0 ⋅ 001, df = 2) items, as well as a clear decrease for self-performance (${X^2}$
 = 37 ⋅ 168, P < 0 ⋅ 001, df = 2), from the ‘Callsign’ test to the ‘Heading’ test (Figure 10).
The results of the NASA-TLX questionnaire, with an asterisk ‘*’ indicating a significant difference between two conditions. In ‘Performance’, a score of 0 indicates good performance and a score of 20 indicates poor performance

4. Discussion
4.1 General discussion
This study proposed a multimodal strategy towards ATCOs acquiring and recognising indicators from EEG and eye-tracking, further investigating the correlations between variations of SA and psychophysiological metrics. Unlabelled EEG and eye-tracking data pose challenges for directly identifying variations in SA before any form of recognition analysis. This is because time-series signals from these data sources contain characteristics that do not immediately indicate specific psychophysiological states without prior classification or labelling. Therefore, this study designed an ATC experiment with SA-probe tests to measure perception, comprehension and projection activity in flight monitoring situations. Behavioural data were first used to measure SA directly, and then to label and match EEG and eye-tracking data with different SA levels as a proxy for addressing the problem of the unmarked nature with physiological response. In other words, we firstly measured participants' situational awareness (SA) directly using behavioural data (e.g., task performance). Then, we used these direct SA measurements to categorise the corresponding EEG and eye-tracking data, assigning labels of different SA levels (e.g., low, medium, high). This approach allowed us to examine the physiological responses (EEG and eye-tracking) associated with different SA levels because these physiological measures do not inherently reflect situational awareness (Figure 4). Although ever-changing brain activity may be related to multiple human factor parameters simultaneously (an inevitable phenomenon in real-world situations), the correlations between brain activity and SA could be at least confirmed by introducing SA-probe direct measurement. Using the proposed strategy, those SA-associated indicators, including brain power spectrum, pupil size and gaze-based metrics, were extracted and calculated from EEG and eye-tracking data. For example, when higher SA was reached, the PSD within channel-F3 in β and channel-CP6 in γ was stronger than when lower SA was attained. H1 was met as psychophysiological indicators related to SA were measured and extracted. Furthermore, a positive correlation was found between the EEG power spectrum in the β and γ frequency bands and the required SA. A positive correlation was also identified between the pupil diameter and fixation/saccade-related metrics and SA, supporting H2 and H3 assumptions. However, H2 was only partially met because the varying SA in the α frequency spectrum had little effect. This study has illustrated the intrinsic correlations between psychophysiological indicators and SA variations and the effects of SA changes on brain activity and eyeball movement, which will help to comprehend the human performance envelope absent SA, providing insights into the safety research related to SA in the ATC context.
4.2 Validity for measuring SA
The ATC experiment with SA-probe tests was inspired by several studies (Endsley, Reference Endsley1995; Endsley, Reference Endsley1999; Peißl et al., Reference Peißl, Wickens and Baruah2018; Kästle et al., Reference Kästle, Anvari, Krol and Wurdemann2021; Li et al., Reference Li, Ng, Fan, Yuan, Liu and Bu2021a; Wang et al., Reference Wang, Wang, Lin, Cong, Xue and Ochieng2021) and modified in our previous study (Li et al., Reference Li, Yiu, Yu and Ng2021b). The radar interface was used to investigate the effect of daily operation on ATCOs’ eye movement in Wang et al. (Reference Wang, Wang, Lin, Cong, Xue and Ochieng2021), which is consistent with our approach. The radar-map interface was used in our work to monitor the flight's actions in real time, simulating the real-world ATC radar interface. Furthermore, our ATC experiment with SA-probe tests was designed by modifying the SAGAT, in which participants were asked to respond to task-based questions about one aircraft out of three flights to determine whether they had achieved SA in light of the goals. The modification from the traditional SAGAT in this experiment involved asking only one question during each pause instead of a series of questions. Identifying a flight's callsign, which is flight-critical information, is like perceiving the status of relevant elements to achieve SA. The real-time flight position is an important parameter for understanding the relationship between flights and other environmental elements, such as the current distance between nearby aircraft and waypoints. This can be referred to as flight coordinate awareness. The heading of flight can be used to predict which airspace the target flight will enter and whether there will be a conflict between aircraft in the near term, which is related to awareness of a flight's direction of movement.
In practical applications, the assessment of SA should transition from freeze-probe methods, which are predominantly used in experimental exploration stages, to real-time probing techniques, such as those offered by neuro-ergonomic approaches (Cak et al., Reference Cak, Say and Misirlisoy2019). In our research, we employed a dual approach, combining psychological sensing (via eye-tracking) with physiological signals (through EEG), to detect timely changes in SA. This comprehensive method is predicated on the understanding that relying solely on either psychological or physiological measures may not effectively determine whether changes in participants’ SA are influenced by extraneous factors during task performance. For example, if one's mind is wandering during the duration of a task, this may result in changes in brain activity that are difficult to remove in data analysis procedures, similarly with eye-tracking's ‘look but no see’ effect (Peißl et al., Reference Peißl, Wickens and Baruah2018). Accordingly, it might be more fruitful to indicate SA using psychophysiological integration techniques. The scientificity of our research is that our experimental scenario with different SA probes was verified by comparing subjective scores. The ‘Heading’ test received the highest score in mental demand, temporal demand, performance, effort, frustration, and difficulty, whereas the ‘Callsign’ test had the lowest scores (Ps < 0.001). Another function of the NASA-TLX was to analyse participants’ expectations of the scenarios under different conditions. Level-3 had the greatest median values of mental, temporal demand, meaning that subjects had to think and act more throughout the ‘Heading’ test, which aligned with our assumptions. In other words, they felt that there was ‘more to do’ during the ‘Heading’ test. The consistency between participants' subjective reports of task difficulty and their corresponding physiological responses (EEG and eye-tracking) validates our experiment protocol. These findings indicate that we could effectively manipulate mental resource demands in the various SA-induce tasks and observe corresponding changes in SA, thus confirming our experimental hypothesis regarding mental resource demand and SA.
4.3 Results interpretation
The EEG results backed up the idea of brain frequency variation as task requirements changed, that is, increased the $\beta$ and $\gamma$
 power associated with higher task demands (Dehais et al., Reference Dehais, Duprès, Blum, Drougard, Scannella, Roy and Lotte2019), consistent with our experimental outcomes. If we only consider the high SA level instead of all three SA levels, channel-FC6 and channel-FC5 in $\beta$
 may be better choices since they were more sensitive than the other channels between 13 and 30 Hz based on PSD (Figure 6). Our research on channel-FC6, located in the frontal lobe, supported Ohneiser et al.'s (Reference Ohneiser, De Crescenzio, Di Flumeri, Kraemer, Berberian, Bagassi, Sciaraffa, Aricò, Borghini and Babiloni2018) finding, specifically, an increased $\beta$
 wave at the frontal site under a high SA performance in comparison with the resting condition. There was a similar tendency in $\gamma$
 : channel-FC6 in the frontal site had the strongest brain activity under high SA level situations, which supported Dasari et al.'s (Reference Dasari, Shou and Ding2017) research. Furthermore, a higher level of attentiveness will result in the desynchronisation of α (Borghini et al., Reference Borghini, Aricò, Di Flumeri, Cartocci, Colosimo, Bonelli, Golfetti, Imbert, Granger and Benhacene2017). The absence of $\delta$
 , $\theta$
 , and $\alpha$
 activity could indicate active cortical treatment of sensory information, whereas its presence may imply cortical deactivation (Dussault et al., Reference Dussault, Jouanin, Philippe and Guezennec2005).
ATCOs are expected to exhibit varying levels of SA tailored to the demands of specific tasks. Maintaining the highest level of SA is not always appropriate, particularly in scenarios where level-1 SA suffices. Striving for an unnecessarily high level of SA in such situations can be counterproductive, as it may encroach upon other cognitive capabilities, such as working memory (Endsley, Reference Endsley1999). In this context, our findings revealed that several channels under $\beta$ (channel-FC1, -F3, -F8, and -P3) and $\gamma$
 (channel-CP6, -Fp2, and -Cz) may be used to identify the three SA levels, since there were significant changes between the three SA probes. This is logical, because they are all located in the frontal or parietal lobes, which are responsible for judgement, thinking, somatosensory-visual perception-spatial information perception and integration (Li et al., Reference Li, Ng, Fan, Yuan, Liu and Bu2021a), and participants were asked to recall multiple pieces of information that were related to the ability to forecast the aircraft's future actions in the ‘Heading’ test. However, although the three SA levels could be identified in $\beta$
 and $\gamma$
 frequency bands using the above channels from the global perspective, we concluded that only the features information from channel-F3 ($\beta$
 ) and channel-CP6 ($\gamma$
 ) should be used to identify SA with greater robustness in future practical applications after point-to-point frequency and time–frequency analysis (Figures 7 and 8). Channel-F3, channel-F8, and channel-CP6 could be used for reliably classifying the degree of SA, since the brain activity within these channels were changed positively with the required SA over time. In addition, the upper limit for the 128 Hz sampling rate equipment to detect brain activity changes from a frequency perspective was around 43 Hz because of the sampling theorem (Weiergraeber et al., Reference Weiergraeber, Papazoglou, Broich and Mueller2016).
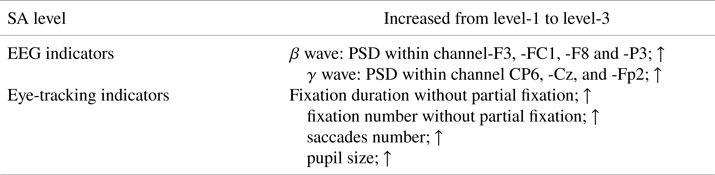
The relationship between eye-tracking metrics and human performance involving SA levels has previously been explored (Lyu et al., Reference Lyu, Li, Xu and Han2023). In the current study, by analysing parameters such as fixation duration, saccade patterns and pupil dilation, this research sought to understand the intricate dynamics between eye movements and the ability to maintain and process situational information. The observed trend indicated that participants devoted more time to observing objects (fixation) during the ‘Heading’ test, in addition to actively searching for objects (saccade) within a dynamic environment. This behaviour suggests that scenarios associated with level-3 SA were more engaging for participants, drawing their attention significantly and inducing a higher level of cognitive processing. In contrast, tasks associated with SA level-1 scenarios were completed with relative ease by the participants, illustrating that perceiving surrounding elements did not tax mental resources heavily. Beyond eye movement metrics, pupil diameter was also scrutinised as an indicator of mental effort and cognitive load. Consistent with the findings of Charles and Nixon (Reference Charles and Nixon2019), a larger pupil diameter was associated with increased cognitive workload. In this study, a noticeable enlargement in pupil size was observed as participants moved from SA level-1 to level-3, signifying an escalated demand for attention and information processing to comprehend the task situation adequately. However, it is essential to note, as Lu et al. (Reference Lu, Happee and de Winter2020) pointed out, that pupillometry's sensitivity to lighting conditions can pose challenges for its application in real-time scenarios. This sensitivity underscores the necessity for further investigation into pupil size dynamics under various environmental conditions to refine the reliability of using pupillometry as a measure of cognitive workload. The integration of data from both EEG and eye-tracking metrics provided a comprehensive view of how SA levels influence cognitive and physiological responses. As detailed in Table 2, the correlational analysis of these outputs illustrated the interconnectedness between brain activity patterns, eye movements and SA variation.
The relationship between EEG and eye-tracking metrics.

The arrow behind each item indicates an increase in terms of this indicator from the level-1 to level-3.
4.4 Implications to artificial intelligence development in ATC
These findings underscored the viability of EEG and eye-tracking metrics as tools for real-time monitoring of human activities involving SA. The distinct variations in multimodal features – such as frequency band power from EEG data and eye-tracking metrics – across different SA levels highlighted their potential as predictive indicators for varying degrees of SA. This insight lays the groundwork for future advancements in artificial intelligence within ATC, marking a pivotal first step towards achieving objectives that encompass understanding the impact of SA variations on physiological responses, identifying SA-related indicators through behavioural proxies, and validating the efficacy and sensitivity of these approaches through experimental research. The progression from this foundational work will involve learning the patterns associated with different SA levels based on EEG and eye-tracking metrics. This knowledge can then be applied to develop and train an SA recognition classifier model with satisfactory accuracy. The subsequent step will involve integrating this classifier model into a platform capable of recognising SA variations in real time (primary goal) as ATCOs perform radar monitoring tasks, facilitating online SA prediction.
The ultimate goal is to evaluate SA inadequacy in real time and develop and implement recommended actions or corrective measures that can be provided to operators when the classifier model detects a lapse in SA. This proactive approach aims to promptly restore SA, thereby preventing poor decision-making and ensuring the continued safety of air traffic operations. This visionary approach enhances the understanding of SA from a physiological and behavioural perspective and paves the way for the practical application of these insights in high-stakes environments like ATC, where real-time SA is crucial for operational safety and efficiency.
4.5 Limitation
The sample size was modest, and novices were recruited in this study. In future research professional participants with more experience should be recruited. This paper mainly focused on identifying how to deploy the experimental environment and extract the indicators associated with different SA levels, as well as comparing them to reveal any significant differences; a recognition model based on the multimodal data should be investigated in further research. Moreover, SA, as the most direct influencer on human performance, is also sometimes affected by workload and stress, which is a research direction worthy of in-depth exploration.
5. Conclusions
In summary, this paper proposed a multimodal strategy that integrates physiological data, subjective measurement and behavioural measurement to measure variations in SA. Specifically, EEG and eye-tracking metrics were identified using behavioural proxies and utilised as critical indicators for investigating SA levels. The results showed that there was a correlation between psychophysiological indicators (brain activity and eye-tracking) and sthe required SA levels. The PSD in channel-FC1, -F3 (most stable), -F8, and -P3 in the $\beta$ wave was sufficiently sensitive for measuring the three SA levels, as well as channel-Fp2, -CP6 (most stable), and -Cz in the $\gamma$
 wave. Moreover, the gaze-based metrics, including fixation, saccades and pupil size increased significantly, corresponding to the increased SA levels. The main contributions are summarised as follows:
• A multimodal strategy is presented, where behavioural data is used to measure SA directly and then align EEG and eye-tracking data as proxies, to better understand the psychophysiological indicators associated with the required SA activity.
• The effects of SA changes on spatial brain areas, frequency spectrum, and attention can be identified using the proposed methodology when faced with raw multimodal datasets, which could help to understand human performance envelope in relation to safe operation.
• The most significant indicators can be extracted using our proposed psychophysiological measurements, providing the inputs for the follow-up classifier with EEG and eye-tracking data to recognise SA loss in real-time.
This paper has revealed how SA can be measured, established, and used to aid in the development of artificial intelligence in ATC using multimodal measurements, as well as to lay the groundwork (initial step) for real-time SA prediction in the future to maintain aviation safety. Most importantly, the offline data-driven recognition model based on indicators extracted by the proposed method will be completed to recognise different SA levels.
Acknowledgements
The research was supported by the Department of Aeronautical and Aviation Engineering, The Hong Kong Polytechnic University, Hong Kong SAR. This work was also supported by the Research Committee and the Department of Aeronautical and Aviation Engineering, The Hong Kong Polytechnic University (Grant Number. RH1W, ZVS9).
Ethical standards
The authors assert that all procedures contributing to this work comply with the ethical standards of the relevant national and institutional committees on human experimentation and with the Helsinki Declaration of 1975, as revised in 2008.