Implications
Simultaneous improvement of carcass weight and conformation should be easy in all breeds. However, the expected genetic gains in fat in response to the same multitrait index are expected to be different for each breed. In an extreme case, fat can increase in one breed and decrease in another breed. Fortunately, the genetic correlations between the three traits do not expose constraints that would strongly compromise genetic gains in carcass weight and conformation, when genetic gain of fat is controlled. In Finland, economic calculations and opinions of breed associations are needed to establish suitable index weights in the future.
Introduction
Effective production of animal protein for human consumption is an important goal of farm animal production. One way of attaining this goal is to improve carcass composition of livestock. Production efficiency is increased when an animal allocates more energy resources to more valuable, edible body parts such as lean growth, rather than to the body parts that are of low edible quality or considered as waste. To record carcass conformation and fat in cattle, a standardized EUROP carcass classification has been established in the European Union (EEC Regulation N.1208/81 and N.2930/81). In beef cattle, few studies on the quantitative genetics of EUROP carcass conformation and carcass fat have been conducted, revealing genetic variation for the traits but also large variation in the estimates between studies and breeds (Fouilloux et al., Reference Fouilloux, Renand, Gaillard and Ménissier1999; Eriksson et al., Reference Eriksson, Näsholm, Johansson and Philipsson2003; Hickey et al., Reference Hickey, Keane, Kenny, Cromie and Veerkamp2007; Altarriba et al., Reference Altarriba, Yagüe, Moreno and Varona2009; Tarrés et al., Reference Tarrés, Fina, Varona and Piedrafita2011; Veselá et al., Reference Veselá, Vostrý and Šafus2011).
Annually around 87 million kg of beef is produced in Finland, of which 10% are produced from beef breeds, 10% from beef–dairy crosses and the remaining from dairy cows. Currently, Finnish Animal Breeding Association (Faba Co.) estimates breeding values for birth weight, weaning weight, 1-year weight and for mothering ability (maternal genetic component of weaning weight) for Hereford, Aberdeen Angus, Simmental, Charolais and Limousin, the five main beef breeds farmed in Finland. Breeding value evaluations are performed separately for each breed. To include carcass traits into a selection index, the objective of the present study was first to estimate heritabilities and genetic correlations for carcass weight, carcass conformation and carcass fat for the five main beef cattle breeds used in Finland. When more than two traits are of interest, it is challenging to understand the way genetic correlations influence breeding just by looking at several pair-wise correlations. In contrast, the whole phenotypic and genetic covariance matrices can be included into selection index calculations. This allows to simultaneously take into account all genetic relationships between all traits, and to study the way selection for one (or several) trait changes both the selected trait and all the correlated traits. Consequently, to study the way genetic correlations constrain breeding of carcass weight, carcass conformation and carcass fat, the second objective was to quantify genetic responses in the three traits, when either one or several traits are simultaneously selected. This was performed by comparing alternative selection scenarios using selection index calculations.
Material and methods
The data for the current study originated from the beef breeding recording scheme maintained by Faba Co., a breeding company collectively owned by Finnish farm animal entrepreneurs. The pedigree is maintained by Faba Co. and phenotypic records are collected from farms and slaughterhouses located across Finland.
Traits analyzed
Carcass weight, carcass conformation and carcass fat were recorded in abattoir on Hereford, Aberdeen Angus, Simmental, Charolais and Limousin cattle. In Finland, the breeding objective for these breeds is to improve carcass growth and conformation. For fat, the objective is to be able to effectively control fat deposition. The required level of carcass fat, and the direction of a genetic change in fat may depend on the current trait mean and on the marketed product, and may be breed specific (Amer et al., Reference Amer, Simm, Keane, Diskin and Wickham2001).
Animals were slaughtered and guts, intestines, skin, head, legs and blood were removed (EU Council regulation 1208/81 and 1930/81), and carcass weight, conformation and fat were recorded 1 hour after slaughter and before chilling. Carcass weight was expressed as 0.98 times the original measured hot carcass weight. Carcass conformation was visually recorded using 15-level EUROP scoring, and 1 stands for poor and 15 for extensive carcass muscularity. Carcass fat was recorded using 5-level EUROP scoring, with 1 standing for low amount of fat and 5 for extensive carcass fat. The animals were recorded in five slaughterhouses by independent trained evaluators under supervision of the Finnish Meat Research Institute.
Data structure
The analyzed data included a total of 6879 to 19 539 phenotyped individuals per breed, born between 2004 and 2012 (Table 1). The records were only on purebred animals whose parents were recorded to be of the same breed. Only records between 250 and 1200 days of age at slaughter were included, and slaughter weight needed to be between 100 and 850 kg. The trait records of the cows having a calf were removed from the data. If a herd-year class had only one observation, it was deleted. The phenotyped animals had 31 852 to 74 364 ancestors per breed in the pedigree. There were no castrated animals in the data. A total of 72.6% of farms had a single breed. None of the animals with a trait record had a missing sire.
Descriptive statistics showing data structure of the phenotypic data in five beef cattle beefs

Statistical model
The phenotypic and genetic parameters were estimated for each breed separately using the following three-trait animal model in DMU software applying restricted maximum likelihood (Madsen and Jensen, Reference Madsen and Jensen2008):
 $$\eqalignno{ y_{{ijklmno}} = \mu _{i} {\plus}{\rm animal}_{j} {\plus}{\rm Herd}\;{\rm Year}_{k} {\plus}{\rm Dam}\;{\rm Age}_{l} \cr \quad{\plus}{\rm Birth}\;{\rm Season}_{m} {\plus}{\rm Twin}_{n} {\plus}{\rm Sex}_{o} {\plus}b_{{1,{\rm Sex}}} {\rm Age} \cr \quad{\plus}b_{{2,{\rm Sex}}} {\rm Age}^{2} {\plus}{\rm error}_{{ijklmno}} $$
where μ i is the trait mean for a trait i (i=1 to 3 traits: carcass weight, carcass conformation, carcass fat), animal j the random genetic effect of an animal j modeled with a pedigree (j=1: number of animals), Herd Year k the fixed herd-slaughter year interaction (k=1: number of combinations), Dam Age l the fixed age class of a dam of an individual j (l=1 to 7; for Hereford and Angus: 1=365 to 729 days, 2=730 to 910 days, 3=911 to 1275 days, 4=1276 to 1640 days, 5=1641 to 3830 days, 6=3831 to 8000 days, and for Simmental, Charolais and Limousin: 1=365 to 910 days, 2=911 to 1275 days, 3=1276 to 1640 days, 4=1641 to 2370 days, 5=2371 to 3100 days, 6=3101 to 8000 days and for all breeds 7=unknown or above 8000 days), Birth Season m the fixed season class for the birth date of an animal (m=1 to 5; 1=January to March, 2=April, 3=May, 4=June to August, 5=September to December), Twin n the fixed effect of whether an animal was born with a twin or as a singleton (n=1 to 2), Sex o is the fixed effect of an animal’s sex (o=1 to 2), b 1,SexAge the fixed linear regression coefficient of slaughter age fitted for each sex separately, b 2,SexAge2 the fixed quadratic regression coefficient of slaughter age fitted for each sex separately and error ijklmno the random residual term. The variation in the age of the slaughtered animals is great (250 to 1200 days), and thus the non-linear age regression, rather than a linear one, was needed. The use of the age regression term makes the estimates of genetic parameters age constant. Fixed slaughterhouse effect and random maternal effect were tested and considered minor; hence, they were excluded from the analysis.
The estimated variance components were used to calculate heritability (h 2=σ G 2/σ P 2, where phenotypic variance σ P 2=σ G 2+σ R 2, the sum of genetic and residual variance), coefficient of genetic variation (CV G=σ G/trait mean) and residual variation (CV R=σ R/trait mean) (Houle, Reference Houle1992). The CV values were calculated to reveal whether it is residual and/or genetic variation that creates breed differences in heritability estimates. Moreover, CV G , rather than h 2, is a suitable measure of potential for genetic responses (Houle, Reference Houle1992). We did not calculate CV for conformation and fat because they have been arbitrarily assigned scores ranging between 1 to 15 and 1 to 5, respectively, but equally well they could be ranging between 11 to 25 and 11 to 15, giving the same variance but a different mean, and thus reduced CVs (Houle, Reference Houle1992).
Selection scenarios
To quantify the consequence of selecting either for carcass weight or for a combination of the slaughter traits, genetic gains in slaughter weight, carcass conformation and carcass fat resulting from three selection scenarios were calculated for each breed. These calculations assumed mass selection, which is unrealistic for the slaughter traits, but effectively illustrates the consequences of selection on multiple traits (Hazel, Reference Hazel1943).
In the first strategy, only carcass weight was selected (I CW). In the second strategy, both carcass weight and conformation were selected (I CW+CON). A multitrait selection index was constructed in which 85% of relative emphasis was allocated to carcass weight and 15% to conformation. The emphases were obtained from Finnish breeders as the first guidelines to actively improve both traits. Carcass fat had zero relative emphasis because in Finland there is no clear agreement among breeders about the direction and magnitude of a desired genetic change for fat. There are no economic values calculated for beef cattle in Finland. In the third strategy (I CW+CON+FAT0), a restricted multitrait selection index in which genetic gain in fat was restricted to zero was constructed following Kempthorne and Nordskog (Reference Kempthorne and Nordskog1959).
The relative emphasis of the traits in an index was calculated as the proportion of a trait’s standardized economic value (a
S
=a σ
G) from the total sum of all standardized values (relative importance of a trait=a
S
/Σ a
S
; Wolfová et al., Reference Wolfová, Nitter, Wolf and Fiedler2001). Genetic responses in the three traits (R) were calculated as
 $$R={i \over {\sigma _{I} }}b'G$$
, where i is the selection intensity (set to 0.5), σ
I
the standard deviation of the selection index, b the vector of three selection index weights and G the 3×3 genetic (co)variance matrix for the three traits, and σ
I
was calculated as
 $$\sigma _{I} =\sqrt {b'Pb} $$
, where P is the 3×3 phenotypic (co)variance matrix and b=P
−1
Ga, where a is the vector of the three economic values.
Results
Trait means
Simmental, Charolais and Limousin were the heaviest, and Hereford and Angus were the lightest at slaughter (Table 2). Charolais and Limousin had the highest carcass conformation and the lowest carcass fat levels, whereas Hereford and Angus had the lowest conformation levels and the highest fat levels. These breed differences are as previously reported (Marshall, Reference Marshall1994).
Trait means, phenotypic (
 $$\sigma _{{\rm P}}^{2} $$
), genetic (
 $\sigma _{{\rm G}}^{2} $
) and residual variances (
 $\sigma _{{\rm R}}^{2} $
), heritabilities (h
2±their standard error), coefficient of genetic variation (CV
G
) and coefficient of residual variation (CV
R
) for three slaughter traits in five beef cattle breeds

Genetic variation
Heritability estimates for carcass weight were moderate ranging between 0.39 and 0.51 across the breeds (Table 2). The highest heritabilities were for Hereford and Angus, which had high CV G and low CV R. Coefficient of genetic variation for carcass weight ranged between 6.7% and 7.7%, implying moderate potential for genetic responses (Table 2). Heritability estimates for carcass conformation ranged between 0.24 and 0.44; Limousin had the highest and Simmental the lowest heritability. For carcass fat, Limousin again had the highest heritability (0.44), whereas for the other breeds heritability varied very little (h 2=0.29−0.32; Table 2). Genetic standard deviation of carcass conformation ranged between 0.58 and 1.16 across the breeds. Hence, a change of one genetic standard deviation will improve conformation by approximately half to one EUROP score units. For fat, a change of 1 genetic standard deviation is expected to change the trait by 0.35 to 0.45 scores.
Correlations between traits
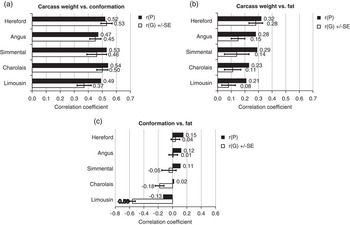
The phenotypic and genetic correlations between carcass weight and carcass conformation were moderately positive and consistent across all breeds (Figure 1a). Thus, increasing carcass weight was favorably related to more conformed carcasses.
Phenotypic (black bars) and genetic correlations and their standard errors (white bars) between slaughter traits for each breed.

The phenotypic correlations (r P) between carcass weight and carcass fat were moderately positive in all breeds (0.21 to 0.32), indicating that increasing carcass weight will lead to increase in fat levels (Figure 1b). The respective genetic correlation (r G) was the strongest in Hereford and Angus (1.96×s.e. does not include zero), which were the two breeds with the lowest average carcass weight and carcass conformation.
For Hereford, Angus and Simmental, the estimated phenotypic correlation between conformation and fat was weakly positive (0.11 to 0.15; Figure 1c). Hence, more conformed carcasses were phenotypically linked to increased fat levels, but the respective genetic correlations were close to zero. For Charolais and Limousin, the two large-sized and muscular breeds, the estimated genetic correlation between conformation and fat was negative (1.96×s.e. does not include zero) and the phenotypic correlation was close to zero (0.02; Charolais) or negative (−0.13; Limousin) (Figure 1c).
Selection scenarios
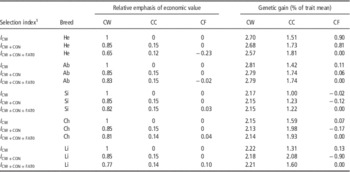
The index calculations showed that when selecting solely for carcass weight (I CW), carcass weight is expected to increase 2.15% to 2.81% per generation and carcass conformation 1.00% to 1.59% per generation as a correlated response in all breeds (Table 3). Carcass fat is expected to increase in Hereford (0.90%), but to remain rather unchanged in the other breeds (−0.02% to 0.13%).
Genetic gains in three slaughter traits in response to selection for alternative indices in five beef cattle breeds

CW=carcass weight; CC=carcass conformation; CF=carcass fat; He=Hereford; Ab=Aberdeen Angus; Si=Simmental; Ch=Charolais; Li=Limousin.
1 I CW=selection index with carcass weight; I CW+CON=Selection index with carcass weight and conformation; I CW+CON+FAT0=Selection index with carcass weight and conformation, and genetic gain in fat restricted to zero.
When selecting simultaneously for carcass weight and conformation (I CW+CON), the expected genetic responses in carcass weight remain high (2.13% to 2.79%) and the responses in conformation are improved (1.23% to 2.08%) from the I CW selection strategy in all breeds (Table 3). The responses in carcass fat show breed differences. Fat is expected to increase in Hereford (0.81%), and to reduce in the other breeds, especially in Limousin (−0.90%).
To restrict the genetic gain of fat to zero while simultaneously improving carcass weight and conformation, the relative emphasis needed for fat in the index ranged from −0.23 in Hereford to +0.10 in Limousin (Table 3). In Angus, Simmental and Charolais, the use of the restricted index compromised very little or not at all with the genetic gains in carcass weight and conformation, compared with the use of index ICW+CON. In contrast, in Hereford, genetic gain in carcass weight was reduced and in conformation it was elevated, and in Limousin, genetic gain in conformation was reduced. This is logical because Hereford has the strongest genetic correlation between carcass weight and fat (Figure 1b), and Limousin has the strongest genetic correlation between carcass conformation and fat (Figure 1c).
Discussion
Trait variation
The results indicate that there is ample genetic variation for improving carcass weight, carcass conformation and carcass fat by selection in all five breeds. This was revealed by moderate heritabilities for all traits, moderate genetic CV for carcass weight and genetic standard deviation for carcass conformation and fat. The average heritabilities across breeds for carcass weight, carcass conformation and carcass fat were 0.43, 0.34 and 0.33. Across the studies in which all the three traits have been recorded, the average heritability estimates are 0.30, 0.23 and 0.20, revealing the same pattern as in our data, yet with a lower overall level (More O’Ferrall et al., Reference More O’Ferrall, Joseph, Tarrant and McGloughlin1989; Dijkstra et al., Reference Dijkstra, Oldenbroek, Korver and van der Werf1990; Hirooka et al., Reference Hirooka, Groen and van der Werf1998; van der Werf et al., Reference van der Werf, van der Waaij, Groen and de Jong1998; Liinamo et al., Reference Liinamo, Ojala and van Arendonk1999; Parkkonen et al., Reference Parkkonen, Liinamo and Ojala2000; Eriksson et al., Reference Eriksson, Näsholm, Johansson and Philipsson2003; Altarriba et al., Reference Altarriba, Yagüe, Moreno and Varona2009; Hickey et al., 2007; Veselá et al., Reference Veselá, Vostrý and Šafus2011). Our estimate of 0.43 for carcass weight is, however, not unusual. Three review studies report average carcass weight heritability of 0.41 (Marchall, Reference Marshall1994), 0.42 (Ríos-Utrera and van Vleck, Reference Ríos-Utrera and van Vleck2004) and 0.45 (Koots et al., Reference Koots, Gibson, Smith and Wilton1994).
The range in heritability estimates among the breeds was 0.39 to 0.51 for carcass weight, 0.24 to 0.44 for carcass conformation and 0.29 to 0.44 for carcass fat. Hickey et al. (2007) reported a range of 0.17 to 0.65 for heritability of carcass weight, 0.10 to 0.36 for carcass conformation and 0.00 to 0.40 for carcass fat for the same breeds as used in our study. Our study may have smaller breed differences and smaller standard errors compared with Hickey et al. (2007) because sample size is higher in our study.
The visually scored EUROP carcass quality classification was applied in our study. The EUROP visual scoring seems to be effective in revealing genetic differences between animals, but a more precise method would likely reduce measurement error. Carcass composition can be recorded also using advanced video image analysis and weights of specific body parts and cutlets (Pabiou et al., Reference Pabiou, Fikse, Näsholm, Cromie, Drennan, Keane and Berry2009 and Reference Pabiou, Fikse, Amer, Cromie, Näsholm and Berry2012; Sarti et al., Reference Sarti, Pieramati, Lubricchio, Giontella, Lasagna and Panella2013).
Correlations between traits
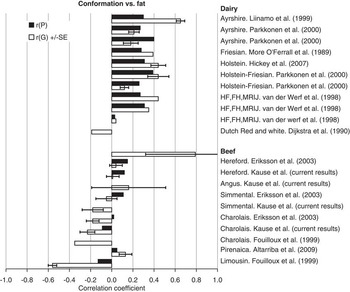
According to our results, increasing carcass weight was favorably genetically related to more conformed carcasses in all breeds. In contrast, the correlation estimates for fat indicate consistent differences between the breeds. These differences may be related to the characteristics of the breeds. In Angus and Hereford, the two British small body-sized breeds with the highest fat and the lowest conformation levels (Marshall, Reference Marshall1994), carcass weight was genetically related to increasing fat, but conformation and fat were not related to each other. On the other hand, in Charolais and Limousin, the two continental large body-sized and muscular breeds with the lowest fat levels (Marshall, Reference Marshall1994), carcass weight and fat were weakly related to each other, but more conformed carcasses were genetically related to decreasing fat. Similarly, in the literature the strongest negative genetic correlations between conformation and fat occur in Charolais and Pirenaica (Fouilloux et al., Reference Fouilloux, Renand, Gaillard and Ménissier1999; Eriksson et al., Reference Eriksson, Näsholm, Johansson and Philipsson2003; Altarriba et al., Reference Altarriba, Yagüe, Moreno and Varona2009; Figure 2).
The summary of the estimates of phenotypic (black bars) and genetic correlations and their standard errors (white bars) between carcass conformation and fat in the literature and in the present study. HF=Holstein–Friesian; FH=Dutch Friesian; MRIJ=Red and white Meuse-Rhine-Issel.

In our study, the average genetic and phenotypic correlations (in brackets) between the studied traits across the five breeds were 0.46 (r P=0.51; carcass weight v. conformation), 0.15 (r P=0.27; carcass weight v. fat) and −0.15 (r P=0.05; conformation v. fat). The first two correlations are consistent with the previous studies on beef and dairy cattle, which have the average estimates of 0.42 (r P=0.49) and 0.12 (r P=0.47) (More O’Ferrall et al., Reference More O’Ferrall, Joseph, Tarrant and McGloughlin1989; Dijkstra et al., Reference Dijkstra, Oldenbroek, Korver and van der Werf1990; Hirooka et al., Reference Hirooka, Groen and van der Werf1998; van der Werf et al., Reference van der Werf, van der Waaij, Groen and de Jong1998; Liinamo et al., Reference Liinamo, Ojala and van Arendonk1999; Parkkonen et al., Reference Parkkonen, Liinamo and Ojala2000; Eriksson et al., Reference Eriksson, Näsholm, Johansson and Philipsson2003; Altarriba et al., Reference Altarriba, Yagüe, Moreno and Varona2009; Hickey et al., 2007). Our estimates for the correlations between conformation and fat seem to be, at first sight, in contrast with the literature average of 0.20 (r P=0.28). However, when the estimates are split between dairy and beef cattle, the correlations between carcass conformation and fat are close to zero or negative especially in beef cattle, and close to zero or positive especially in dairy cattle (Figure 2). This was noted also by Altarriba et al. (Reference Altarriba, Yagüe, Moreno and Varona2009). Our genetic correlation estimates ranged from −0.56 to 0.04 matching well with the published estimates of beef cattle (see Figure 2 for references).
Potential reasons for breed differences
Breeds may have different heritability and correlation estimates because of several reasons. First, sampling error alone can produce variation in the estimates. Second, heritabilities and correlations may exhibit true biological differences among cattle breeds rather than just variation due to sampling error. Koots and Gibson (Reference Koots and Gibson1996) found that the heritability estimates for beef cattle traits have an observed between-population variance that is four times their expected variance. This indicates either underestimation of sampling variances of the individual estimates and/or real differences in the parameters among populations. In our study and in the literature, the consistent breed differences in correlations were observed (Figure 2). It is possible that genetic divergence of beef and dairy breeds has resulted in the different genetic correlations. Moreover, the five studied beef breeds have diverged genetically during their phylogenetic history. Charolais and Limousin are continental French breeds, Hereford and Angus are of British origin, and Simmental originated from Switzerland (Decker et al., Reference Decker, Pires, Conant, McKay, Heaton, Chen, Cooper, Vilkki, Seabury, Caetano, Johnson, Brenneman, Hanotte, Eggert, Wiener, Kim, Kim, Sonstegard, VanTassell, Neibergs, McEwan, Brauning, Coutinho, Babar, Wilson, McClure, Rolf, Kim, Schnabel and Taylor2009). In breeds with low muscularity and high fat deposition (especially Hereford), high fat levels are more strongly genetically connected to heavier carcasses and high muscularity. This suggests that within beef cattle, breeding for muscularity and heavy carcasses may have changed the genetic characteristics of the slaughter traits. Genetic correlations can indeed evolve because of selection (Falconer and Mackay, Reference Falconer and Mackay1996; Roff, Reference Roff1996; Kause et al., Reference Kause, Saloniemi, Morin, Haukioja, Hanhimäki and Ruohomäki2001; Steppan et al., Reference Steppan, Phillips and Houle2002). The third potential reason is that the breeds are both managed differently and held mostly at different farms. This may induce breed-specific residual and genetic (co)variation, for instance via genotype-by-environment interactions.
Implications
In Finland, all five beef cattle breeds are evaluated separately and breed-specific phenotypic and genetic parameters are used in the breeding value estimation. Separate breed-specific evaluations are needed not only because of the breed-specific genetic parameters but also because breeding objectives differ. The breeding objective is to improve both growth and conformation, whereas the goal for carcass fat depends on the marketed product, breeds and producers.
The index theory calculations showed that simultaneous improvement of carcass weight and conformation should be obtainable consistently in all breeds. However, the expected genetic gains in carcass fat are expected to be different for each breed. In a selection scenario with selection for carcass weight and conformation, carcass fat can increase in one breed and reduce in another breed. This is true when using the same relative emphases of the traits in a selection index for all breeds. If carcass fat needs to be fixed to maintain its current level, there will be breed differences in the economic values of fat. Fortunately, the genetic correlations between the three traits do not expose strong constraints that would strongly compromise genetic gains in carcass weight and conformation, when restricting the genetic gain of fat to zero. Economic calculations and opinions of breed associations are needed to establish suitable index weights in the future.
To summarize, our results imply favorable correlation structure for simultaneous breeding for faster carcass growth and improved conformation in all breeds, but unfavorable for breeding against high carcass fat in Hereford and Aberdeen Angus. The estimated correlations and variance components can be used to develop breeding value evaluations for beef cattle in Finland.
Acknowledgement
The study was funded by Faba Co.