




No CrossRef data available.
Article contents
Molecular characterisation of neonatal cardiac hypertrophy and its regression
Published online by Cambridge University Press: 21 January 2005
Abstract
Neonatal cardiac hypertrophy associated with diabetic pregnancy is transient and regresses naturally, but is associated with increased morbidity and mortality.
This study was undertaken to analyse the changes in expression of 5 cardiac genes, including atrial natriuretic peptide, α- and β-myosin heavy chain, and cardiac and skeletal α-actin genes, using a rat neonatal model, in which cardiac hypertrophy was induced via maternal diabetes.
In the hypertrophied left ventricle of neonates from diabetic mothers, the levels of mRNA from all the above genes except skeletal α-actin were increased by between 1.8- and 12-fold compared with the controls at birth (p < 0.05). In the first 28 days, the level of mRNA for α-myosin heavy chain increased slightly, while that for atrial natriuretic peptide and β-myosin heavy chain decreased continuously similar to the controls, but at a significantly faster rate. No significant difference between the two groups of neonates was observed in all 5 genes after 1 month, indicating complete regression.
Expression of 5 cardiac genes in the neonatal cardiac hypertrophy was characterised in both hypertrophic and regressive phases. Hypertrophic regression provides a unique model for the testing of new drugs or genetic modifying factors in cardiac hypertrophy.
Information
- Type
- Original Article
- Information
- Copyright
- © 2004 Cambridge University Press
Neonatal cardiac hypertrophy has a number of aetiologies, including mitochondrial diseases, genetic syndromes, defects in glycogen metabolism and fatty acid oxidation,1 diabetic pregnancy, and iatrogenic factors.2–5 It is a major cause of neonatal morbidity and mortality, and is usually associated with congestive heart failure and sudden death. A high risk of cardiac hypertrophy has been recognised in infants of diabetic pregnancies since the mid 1940s.6–8 The association has been reinforced by a recent population-based case-control study, which confirmed that preconceptional maternal diabetes was strongly associated with neonatal cardiomyopathy.9
The characteristics of neonatal cardiac hypertrophy resulting from diabetic pregnancy include asymmetric septal hypertrophy, which can cause obstruction to the left ventricular outflow tract, and a transient effect, the latter regressing spontaneously in humans during the first 6 months of life.4, 10 Recently, a similar phenotype including natural regression has been reported in newborns who have been exposed to corticosteroids.2, 3, 5, 11 Antenatal corticosteroids are commonly used for preventing mortality and morbidity from respiratory distress and intraventricular haemorrhage of premature birth,5 while postnatal corticosteroids are used for the treatment of brochopulmonary dysplasia, especially in preterm infants.2, 3 Neonatal cardiac hypertrophy has also been encountered postnatally in recipients of allogeneic transplants treated with corticosteroids.11
To understand cardiac hypertrophy in newborns, rat models have been established related both to diabetic pregnancies and induction with corticosteroids.12–14 These models mimic the human neonatal phenotype. The rats from streptozotocin-induced diabetic mothers had significant asymmetrical septal hypertrophy, and underwent a spontaneous regression within the first 4 weeks of life.12, 14 Little has been done, however, to characterise the expression of cardiac genes in this model, especially during regression of the hypertrophy.
Molecular characterisation can provide new insights into the pathogenesis of cardiac hypertrophy, as demonstrated in previous studies. In 1992, Schwartz et al.15 studied the patterns of expression of myosin heavy chain and actin genes using molecular techniques. From this work, they noted temporal gene switches in rat neonatal hearts, and provided evidence of primary regulation at the transcriptional levels. In hypertrophied fibres, there was a shift from α- to β-myosin heavy chain, which can lead to a slower rate of cycling of adenosine triphosphate by myosin, and increased economy of generation of force. Molecular analysis also indicated that re-activation of the atrial natriuretic peptide gene in the left ventricle is a sensitive molecular marker for cardiomyopathy.16 Up-regulation of atrial natriuretic peptide, β-myosin heavy chain, and skeletal α-actin genes has been observed in many rodent models of cardiac hypertrophy.15, 17, 18 These include transgenic mice with a constitutively active form of calcineurin, rats with banded abdominal aortas, and transgenic mice with defects in the cardiac contractile unit. Interestingly, up-regulated genes can be suppressed, along with cardiac hypertrophy, with cyclosporine, an inhibitor of calcineurin.17, 18 In this study, we characterised the temporal changes during the hypertrophic and regression phases in the expression of the genes for atrial natriuretic peptide, 2 isoforms for ventricular myosin heavy chain, and 2 actin isoforms, using as our model neonatal rats from diabetic mothers.
Materials and methods
Animals
Female Sprague-Dawley rats weighing from 150 to 175 g were randomly divided into a diabetic and control group (Fig. 1). Diabetes mellitus was induced by peritoneal injection of streptozotocin at a concentration of 50–55 mg/kg body weight in 100 millimolar citrate buffer at a pH of 4.5. In the control group, an equal volume of buffer was injected.19 The blood glucose was measured when rats were fed freely one week after the injection using the Advantage II glucose meter (Roche, Castle Hill, NSW, Australia). Rats with a non-fasting blood glucose concentration of 12–18 millimolar were selected for mating one week after injection of streptozotocin. Their levels of glucose in the blood were in the range of 16–20 millimolar during pregnancy. The pups from diabetic rats were transferred to healthy surrogate mothers from the first day after birth (Fig. 1). The female controls had levels of glucose in the blood <5.5 millimolar both before and during pregnancy, and they reared their pups. All mated female rats were kept in individual cages, and had free access to rat chow and tap water. The animal house was maintained on a light and dark cycle of 12 h, with a constant temperature at around 22°C. Neonates from diabetic and control mothers were killed using carbon dioxide on the 1st, 7th, 14th, 21st, and 28th days (Fig. 1). The corresponding heart and body weights were recorded, and the ventricular muscle near the apex of the left ventricle was collected into pre-chilled RNAlater (Ambion, Austin, TX, USA). The samples were incubated at 4° overnight, and then transferred to the freezer for further molecular analysis. The research protocol involving rats was approved by the Institutional Animal Welfare Committee of Royal Prince Alfred Hospital.

Figure 1. Experimental design. Induced diabetic female rats had blood glucose levels of 12–18 millimolar (pre-pregnancy) and 16–20 millimolar (during pregnancy), while the control female rats had <5.5 millimolar blood glucose levels during these times. Neonates from diabetic mothers were transferred to a healthy surrogate mother on day 1. Heart muscle near the apex of the left ventricle was collected on days 1, 7, 14, 21 and 28 for gene expression studies.
Molecular analysis
RNA extraction and reverse transcription polymerase chain reaction
RNA was isolated from the ventricular muscle using a total RNA Isolation Kit (Promega Corporation, Madison, WI, USA) according to the manufacturer’s recommendation, which included DNase I digestion. The integrity of RNA was electrophoretically verified by ethidium bromide staining. The quantity and quality of the total RNA extracted were measured at ultraviolet wavelengths 260 and 280 nm, and the optical density ratio of 260 over 280 nm was maintained between 1.7 and 2.1. We used 22 μg of total RNA from each sample for 20 μL reverse transcription reactions, which included poly-thymidine oligonucleotide (500 ng, Roche, Castle Hill, NSW, Australia), 2.5 millimolar of each deoxynucleotide triphosphate (Applied Biosystems, Foster City, CA, USA), SuperScriptTM II RNase H− Reverse Transcriptase, and First Strand Buffer (Invitrogen, Carlsbad, CA, USA). Reverse transcription was carried out at 42°C for 60 min, and was followed by removal of RNA templates using the endonuclease-free ribonuclease A (Qiagen, Clifton Hill, VIC, Australia). The resulting cDNA was frozen at −20°C until required.
Quantitative analysis
Target genes were amplified and measured with real time polymerase chain reaction using the LightCycler (Roche, Castle Hill, NSW, Australia). The primers and probes were designed at the 3′ untranslated region for efficient amplification and quantitation (Table 1). The probes for target gene analysis were labelled with the red640 fluorophore and measured in the F2 channel. Glyceraldehyde-3-phosphate dehydrogenase was amplified as an endogenous reference. The reference probe was labelled with the red705 fluorophore and detected in the F3 channel. In order to improve the accuracy and reproducibility, replicates of each sample were quantified and average values were used for analysis.
Table 1. Primer sequences, amplicon sizes and amplification efficiencies in the quantitative analysis.

Results were analysed for each target with relative quantification comparing the difference between target and reference crossing point values. The crossing point indicates the fractional cycle number where the fluorescence rises above background. The differences in crossing point values (Fig. 2a) were then transformed according to the formula 2−ΔCT to give expressions of target genes relative to the reference genes. The efficiency of the polymerase chain reaction was calculated conventionally based on the slope of a standard curve (Table 1).20 Conversely, in this study, validation for the use of the comparative method for the crossing point was more relevant by plotting the logarithm of input concentrations versus differences in crossing point. If the slope of the plot has values of <0.1, it indicates compatible and acceptable efficiencies for quantitative analysis.21 Real-time reactions were performed in a glass capillary with total reaction volume of 10 μL, which contained 1 μL 10x Hybridisation Probe Master Mix (Roche, Castle Hill, NSW, Australia), additional magnesium chloride, amplification primers, probes and ±1.7 ng cDNA.

Figure 2. Quantitative analysis of gene expression using LightCycler. (a) Changes of fluorescent intensities in real time polymerase chain reaction. The crossing point (CT) is automatically recorded in the LightCycler using the second derivative method (see Materials and methods). The crossing point difference (ΔCT) is relatively constant when the rate of fluorescent change is at its maximum and is calculated by subtracting the average crossing point of the reference gene from that of the average of a target gene. (b–f) Expression patterns of the atrial natriuretic peptide, α- and β-myosin heavy chain, and cardiac and skeletal α-actin genes in the neonate hearts from control (□) and diabetic mothers ([squf ]) from day 1 to day 28. The vertical axis is the target gene relative to the reference gene based on 2−ΔCT values and the horizontal axis indicates postnatal days. Atrial natriuretic peptide expression is shown in (b). The expression patterns for the cardiac α- and β-myosin heavy chain genes are indicated in (c) and (d) and demonstrated opposite trends. The expression of the cardiac α-actin gene (e) shows a more prominent change compared with the skeletal α-actin gene (f). All target genes in neonates from diabetic pregnancies restored their gene expression profiles to control levels by day 28. *Gene expression in neonates from diabetic mothers versus neonates from control mothers at the same postnatal day was significantly different, p < 0.05
Statistical analysis
Data are presented as the mean ± standard error of the mean. Linear regression analysis was performed to estimate the relationship between postnatal day and relative expression of each of the candidate genes. In addition, a two-way analysis of variance was applied. This was followed by Bonferroni t-test to compare target expression levels between the 2 neonatal groups and at different developmental stages. In analysis of variance, all data were log transformed to normalise the distributions and eliminate heterogeneity of variance between the groups. The general level of significance was set to p values of <0.05, unless otherwise specified. All the statistical analyses were performed using SigmaStat 2.0 (Jandel Co., San Rafael, CA, USA).
Results
Animal model
The neonates from diabetic mothers had significant cardiac hypertrophy, and their hearts were heavier than those of controls from first to the 14th days after birth (p < 0.001, Table 2). Although healthy mothers served as surrogates, the growth of the heart in the neonates of a diabetic pregnancy still lagged behind their controls after 21 days. The ratios of the weight of the heart to the body were significantly greater in the neonates from diabetic mothers from the first to the 14th days. There was no significant difference between the two groups by the 21st and 28th days. There were no significant differences in the weights of either the heart or the body between male and female neonates in both groups at the same postnatal ages until the 28th day (data not shown).
Table 2. Heart weights and heart-to-body weight ratios.

Profiles of expression of genes
Reference gene and molecular marker. Glyceraldehyde-3-phosphate dehydrogenase was used as the reference gene. Its crossing point values were compatible during the first to 28th days, and there was no significant difference when comparing different days and between the neonates from diabetic and control mothers (data not shown).
The expression of atrial natriuretic peptide in the ventricular myocytes decreased continuously between the first and the 28th days in both neonates from control and diabetic mothers (Fig. 2b). The abundance of mRNA of the gene for atrial natriuretic peptide in the neonates from diabetic mothers was about 4-fold higher than controls at birth (p < 0.05). This difference remained significant until the 14th day, and then no significant differences were observed at the 21st and 28th days. There was an 18-fold decrease in mRNA from the gene for atrial natriuretic peptide in the neonates of a diabetic pregnancy from the 1st to the 28th day in comparison with a 5-fold decrease in the controls during the same period.
Myosin heavy chain genes. In neonates from control mothers, expression of α-myosin heavy chain was positively correlated with the postnatal days (r = 0.77, Fig. 2c). There was a 5-fold increase in expression during this postnatal transition. While in neonates from diabetic mothers, the same expression was about 4 times higher than that in the controls on the 1st day, the overall increase was limited to 1.5-fold during this period. The levels of mRNA for α-myosin heavy chain in the neonates of a diabetic pregnancy were significantly higher than those of the controls on the first and seventh days, but there were no significant differences after the seventh day.
Expression of β-myosin heavy chain demonstrated opposite trends to that of its α-isoform in neonates from diabetic and control mothers (Fig. 2d). The levels of mRNA for β-myosin heavy chain were significantly correlated with the postnatal days in the neonates from control and diabetic groups (r = 0.83 and 0.78, respectively). In the controls, a significant decrease in gene expression was observed between the seventh and 14th days, and continued into the 21st day. This significant decrease did not occur in the neonates from diabetic mothers until the 21st day, and similar expression levels as the controls were observed at the 28th day. mRNA from the β-myosin heavy chain gene in neonates from diabetic mothers was between 1.5- and 1.7-fold higher from the first day to the 14th day when compared with the controls (p < 0.05).
α-Actin genes. The expression pattern of the cardiac α-actin gene was similar to that of the α-myosin heavy chain gene in the control group (Fig. 2e). It increased continuously 10-fold over the first 28 days. This temporal pattern was disrupted in neonates from diabetic mothers. No significant change in the expression of the cardiac α-actin gene was observed based on analysis of variance. On the first day, expression of cardiac α-actin gene in the neonates from diabetic mothers was 12-fold higher than that in the controls, and remained significantly higher until the 21st day.
In regards to the skeletal α-actin gene, there was no significant correlation between expression and postnatal days (Fig. 2f). Expression reached a peak at the seventh day in the neonates from diabetic mothers. A significant decrease in gene expression was observed between the 21st and 28th days in the controls, and between the seventh and fourteenth days in the neonates of diabetic pregnancy.
Discussion
Neonatal cardiac hypertrophy has a significant impact on perinatal care, since it is associated with poor prognosis. This form of hypertrophy can result from a diabetic pregnancy or exposure to corticosteroids. Both forms have a similar phenotype, with thickening of the ventricular septum followed by natural regression.2, 4, 10 Hyperglycaemia related to maternal diabetes, or the glucocorticoid effect of corticosteroids, can induce foetal or neonatal hyperinsulinaemia, which accelerates metabolism and depletes the stores of oxygen. Increased metabolic demand and relative hypoxia can act as a haemodynamic stimulant and significantly increase cardiac output.22 In addition, corticosteroids can have a direct anabolic effect on myocardium,2 cause systemic hypertension, and increase the afterload.13 This type of hemodynamic stimulant, hyperinsulinaemia and or iatrogenic corticosteroids, can cause neonatal cardiac hypertrophy. Regression of the hypertrophy occurs when hyperglycaemia or corticosteroids are discontinued.
To understand better the molecular events in neonatal cardiac hypertrophy and its regression phase, we quantified mRNA from atrial natriuretic peptide gene, myosin heavy chain genes, and actin isoform genes, in a previously established rat model.12, 14 The gross changes in terms of neonatal heart weights, and ratios of weight of heart to body (Table 2) in our model were consistent to those reported previously. Histological analysis was not repeated here, since it has been described in detail in previous studies.12 Postnatal development was greatly improved when surrogate mothers rather than the natural ones were used to raise the pups, as diabetic mothers were often too sick to provide sufficient milk to their pups. In this respect, malnutrition can be a confounding factor in gene expression analysis.
Since glyceraldehyde-3-phosphate dehydrogenase is ubiquitously and constitutively expressed, its levels of mRNA were used in our quantitative analysis as an endogenous reference to standardise the initial templates added to a reaction. It has been reported that this expression of a reference gene can vary during different stages of development, in the middle of a diabetic pregnancy, and under experimental hypoxia.23–25 In our experimental system, we did not find any significant difference in the expression of the glyceraldehyde-3-phosphate dehydrogenase gene at different days, nor between the neonates from control and diabetic mothers. Our results were consistent with what was found in the rat neonatal ventricular myocytes of the Sprague-Dawley strain.26 We believe that it was appropriate, therefore, to use the glyceraldehyde-3-phosphate dehydrogenase gene for standardisation in our assays. The crossing point was the key parameter used for the quantitative analysis, and was objectively derived with the LightCycler analysis software (v3.5) using the second derivative maximum method. The relative expression of target transcripts was obtained using the comparative method. This is similar to the standard curve method, except it uses arithmetic formulas to achieve the same results for quantitation.
In ventricles from control animals at birth, the β-isoform is the principal myosin heavy chain, and both the cardiac and skeletal α-actin isoforms were expressed. Thereafter, the levels of mRNA for both α-myosin heavy chain and cardiac α-actin genes increased continuously until the 28th day (Fig. 2c, e), while β-myosin heavy chain had the opposite trend, and decreased to a low level after the 21st day (Fig. 2c). These findings were consistent with the results reported previously by Schwartz et al.15 In control hearts, the skeletal α-actin mRNA accounted for just over one-quarter of the total actin at birth, and remained relatively constant from the seventh to the 21st days, before it significantly decreased to 3% at the 28th day. These changes were the same that were found previously in rat neonates in a study looking at regulation of cardiac isogenes using a primer extension assay.27 Results from our control group indicated that our quantitative assays worked well, and reproduced the molecular changes that were known through previous studies.
The profile of expression of the genes we examined has not previously been described in the ventricles of the neonates from diabetic mothers. It was not surprising that the mRNA from atrial natriuretic peptide was 4-fold higher compared with the controls on the first day, since it is a sensitive molecular marker for cardiomyopathy.16 Increased abundance of the atrial natriuretic peptide gene was consistent with the hypertrophy that was found at a gross anatomic level (Table 2). As a result, elevated levels can assist in lowering the pre-load through its natriuretic and vasorelaxant effects. At birth, the cardiac α-actin, α- and β-myosin heavy chain genes were all significantly up-regulated in the neonates of a diabetic pregnancy (Fig. 2c, d, e), whereas transcription of the skeletal α-actin gene did not show any significant difference in our rat model.
During the regression phase of hypertrophy, the expression patterns for atrial natriuretic peptide and β-myosin heavy chain were similar to those observed in the controls, although at a significantly faster rate. Elevated expression of the α-myosin heavy chain gene at birth lasted to the seventh day, which was similar to the findings in dexamethasone induced neonatal cardiac hypertrophy.13 A significant difference was observed in the expression of the β-myosin heavy chain gene in our diabetic pregnancy-related model compared with corticosteroid-induced hypertrophy model. The former had significantly increased levels of the β-myosin heavy chain gene from the first to the 21st days (Fig. 2d), while in the corticosteroid induced model, the β-myosin heavy chain gene was down-regulated compared to the controls. This could be related to the direct transcriptional effect of steroids on the regulation of the myosin heavy chain isoforms.13 These data reinforce the importance of molecular characterisation, since the two hypertrophic models were phenotypically similar. The levels of mRNA for cardiac α-actin was persistently high until the 21st day (Fig. 2e), which was similar to a rat neonatal model of cardiac hypertrophy induced by pressure overload.15 But the temporal pattern of this transcription was completely different from the controls. Down-regulation of the skeletal α-actin gene occurred between the 7th and 14th days, which was a week earlier compared with the controls (Fig. 2f). Otherwise, changes in gene expression were minimal compared to the other three genes. Variations in transcriptional levels and patterns of expression for five cardiac expressing genes studied implied that the myosin heavy chain and actin families are independently regulated.15 A return to normal of atrial natriuretic peptide, myosin heavy chain and actin gene expression in the neonates from diabetic mothers was achieved by the 28th day.
Cardiac hypertrophy occurring in the neonates of diabetic pregnancy is an interesting model, but has also demonstrated some limitations. The heart samples were collected weekly after birth, but gene expression could change more rapidly during neonatal development. Our quantitative analysis was based on transcriptional changes. Although the main regulation of myosin heavy chain and α-actin genes was considered at the transcription level,13, 15 post-transcriptional regulation could not be completely excluded.28 The number of target genes was limited compared to what would be available through a microarray approach. Nevertheless, this molecular characterisation has provided a basis for further study of neonatal cardiac hypertrophy induced by maternal diabetes. The changes in gene expression occurring during the development of cardiac hypertrophy, as well as in the phase of regression, provide molecular markers that could be used in development of drugs, or testing of potential genetic modifying factors for cardiac hypertrophy.
Acknowledgement
We thank Professor Dennis Yue for the support in the establishment of diabetic model, and Dr Michael Stuart for the statistical advices. This study was partially supported by the Heart Foundation of Australia and a University of Sydney Grant.
References
Towbin JA, Lipshultz SE. Genetics of neonatal cardiomyopathy. Curr Opin Cardiol 1999; 14: 250–262.Google Scholar
Lilien LD, Lilien RH, Setrakian S. Hemopericardium and cardiac tamponade as presenting findings of dexamethasone-induced hypertrophic cardiomyopathy complicated by transmural myocardial infarction. Pediatr Cardiol 2003; 24: 280–283.Google Scholar
Bensky AS, Kothadia JM, Covitz W. Cardiac effects of dexamethasone in very low birth weight infants. Pediatrics 1996; 97: 818–821.Google Scholar
Weintrob N, Karp M, Hod M. Short- and long-range complications in offspring of diabetic mothers. J Diabetes Complications 1996; 10: 294–301.Google Scholar
Yunis KA, Bitar FF, Hayek P, Mroueh SM, Mikati M. Transient hypertrophic cardiomyopathy in the newborn following multiple doses of antenatal corticosteroids. Am J Perinatol 1999; 16: 17–21.Google Scholar
Miller HC, Wilson HM. Macrosomia, cardiac hypertrophy, erythroblastosis and hyperplasia of the islets of Langerhans in infants born to diabetic mothers. J Pediatr 1943; 23: 251–266.Google Scholar
Loffredo CA, Wilson PD, Ferencz C. Maternal diabetes: an independent risk factor for major cardiovascular malformations with increased mortality of affected infants. Teratology 2001; 64: 98–106.Google Scholar
Zielinsky P, da Costa MH, Oliveira LT, Bonow FP, da Silva NI, Hagemann LL. Natural history of myocardial hypertrophy and its association with hyperinsulinism in infants of diabetic mothers. Arq Bras Cardiol 1997; 69: 389–394.Google Scholar
Lesnik JJ, Singh GK, Balfour IC, Wall DA. Steroid-induced hypertrophic cardiomyopathy following stem cell transplantation in a neonate: a case report. Bone Marrow Transplant 2001; 27: 1105–1108.Google Scholar
Takino Y, Iwasaki T, Suzuki T. The cardiomyopathy in infants of streptozotocin-induced diabetic female rats. Jpn Circ J 1990; 54: 1554–1562.Google Scholar
Muangmingsuk S, Ingram P, Gupta MP, Arcilla RA, Gupta M. Dexamethasone induced cardiac hypertrophy in newborn rats is accompanied by changes in myosin heavy chain phenotype and gene transcription. Mol Cell Biochem 2000; 209: 165–173.Google Scholar
Menezes HS, Barra M, Bello AR, Martins CB, Zielinsky P. Fetal myocardial hypertrophy in an experimental model of gestational diabetes. Cardiol Young 2001; 11: 609–613.Google Scholar
Schwartz K, Carrier L, Chassagne C, Wisnewsky C, Boheler KR. Regulation of myosin heavy chain and actin isogenes during cardiac growth and hypertrophy. Symp Soc Exp Biol 1992; 46: 265–272.Google Scholar
Vikstrom KL, Bohlmeyer T, Factor SM, Leinwand LA. Hypertrophy, pathology, and molecular markers of cardiac pathogenesis. Circ Res 1998; 82: 773–778.Google Scholar
Lim HW, De Windt LJ, Mante J, et al. Reversal of cardiac hypertrophy in transgenic disease models by calcineurin inhibition. J Mol Cell Cardiol 2000; 32: 697–709.Google Scholar
Sussman MA, Lim HW, Gude N, et al. Prevention of cardiac hypertrophy in mice by calcineurin inhibition. Science 1998; 281: 1690–1693.Google Scholar
Yu B, Pugazhenthi S, Khandelwal RL. Effects of metformin on glucose and glucagon regulated gluconeogenesis in cultured normal and diabetic hepatocytes. Biochem Pharmacol 1994; 48: 949–954.Google Scholar
Ramakers C, Ruijter JM, Deprez RH, Moorman AF. Assumption-free analysis of quantitative real-time polymerase chain reaction (PCR) data. Neurosci Lett 2003; 339: 62–66.Google Scholar
Livak KJ. ABI Prism 7700 Sequence Detection System. User Bulletin 2: Applied Biosystem, 2001, pp 2–36.Google Scholar
Lisowski LA, Verheijen PM, De Smedt MM, Visser GH, Meijboom EJ. Altered fetal circulation in type-1 diabetic pregnancies. Ultrasound Obstet Gynecol 2003; 21: 365–369.Google Scholar
Wentzel P, Ejdesjo A, Eriksson UJ. Maternal diabetes in vivo and high glucose in vitro diminish GAPDH activity in rat embryos. Diabetes 2003; 52: 1222–1228.Google Scholar
Patel P, Boyd CA, Johnston DG, Williamson C. Analysis of GAPDH as a standard for gene expression quantification in human placenta. Placenta 2002; 23: 697–698.Google Scholar
Zhong H, Simons JW. Direct comparison of GAPDH, beta-actin, cyclophilin, and 28S rRNA as internal standards for quantifying RNA levels under hypoxia. Biochem Biophys Res Commun 1999; 259: 523–526.Google Scholar
Winer J, Jung CK, Shackel I, Williams PM. Development and validation of real-time quantitative reverse transcriptase-polymerase chain reaction for monitoring gene expression in cardiac myocytes in vitro. Anal Biochem 1999; 270: 41–49.Google Scholar
Boheler KR, Carrier L, Chassagne C, de la Bastie D, Mercadier JJ, Schwartz K. Regulation of myosin heavy chain and actin isogenes expression during cardiac growth. Mol Cell Biochem 1991; 104: 101–107.Google Scholar
Day DA, Tuite MF. Post-transcriptional gene regulatory mechanisms in eukaryotes: an overview. J Endocrinol 1998; 157: 361–371.Google Scholar

Experimental design. Induced diabetic female rats had blood glucose levels of 12–18 millimolar (pre-pregnancy) and 16–20 millimolar (during pregnancy), while the control female rats had <5.5 millimolar blood glucose levels during these times. Neonates from diabetic mothers were transferred to a healthy surrogate mother on day 1. Heart muscle near the apex of the left ventricle was collected on days 1, 7, 14, 21 and 28 for gene expression studies.
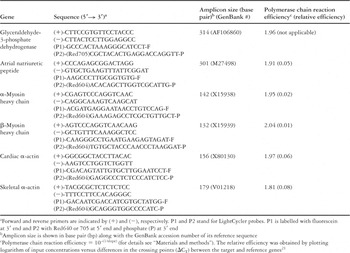
Table 1.

Quantitative analysis of gene expression using LightCycler. (a) Changes of fluorescent intensities in real time polymerase chain reaction. The crossing point (CT) is automatically recorded in the LightCycler using the second derivative method (see Materials and methods). The crossing point difference (ΔCT) is relatively constant when the rate of fluorescent change is at its maximum and is calculated by subtracting the average crossing point of the reference gene from that of the average of a target gene. (b–f) Expression patterns of the atrial natriuretic peptide, α- and β-myosin heavy chain, and cardiac and skeletal α-actin genes in the neonate hearts from control (□) and diabetic mothers ([squf ]) from day 1 to day 28. The vertical axis is the target gene relative to the reference gene based on 2−ΔCT values and the horizontal axis indicates postnatal days. Atrial natriuretic peptide expression is shown in (b). The expression patterns for the cardiac α- and β-myosin heavy chain genes are indicated in (c) and (d) and demonstrated opposite trends. The expression of the cardiac α-actin gene (e) shows a more prominent change compared with the skeletal α-actin gene (f). All target genes in neonates from diabetic pregnancies restored their gene expression profiles to control levels by day 28. *Gene expression in neonates from diabetic mothers versus neonates from control mothers at the same postnatal day was significantly different, p < 0.05
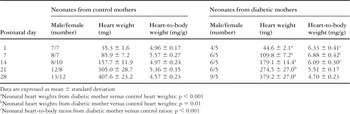
Table 2.
 You have
Access
- 4
- Cited by