Introduction
South Korea's rapidly aging population has created a major social and public health concern for the country. By 2026, the proportion of the elderly (aged 65 years or older) population is expected to increase by more than 20%, at which point South Korea will be considered an aged society (Statistics Korea, 2010). This demographic change in turn could cause a socioeconomic burden, mainly due to the exorbitant health-related costs of the aged group (Harper, Reference Harper2014).
Depression associated chronic diseases, such as diabetes and arthritis, are major contributors to healthcare costs (Karakus and Lisa, Reference Karakus and Lisa2011; Zivin et al., Reference Zivin, Wharton and Rostant2013). Global Burden of Disease reported that depression contributed 2.5% of all DALYs in 2010, making it the 11th highest cause of all DALYs (Ferrari et al., Reference Ferrari2013). Depression is heavily associated with suicide (Shin et al., Reference Shin2013; Jang et al., Reference Jang2014), harmful behaviors such as smoking and mental disorders (Choi et al., Reference Choi, Lee, Cho, Park and Gim2015). Moreover, due to the rising unemployment rate and cost of living, the prevalence of depression in South Korea has increased dramatically over the past few decades (Park et al., Reference Park, Lee, Sohn, Seong and Cho2015) from 1.8% in 2001 to 2.5% and 3.1% in 2006 and 2011, respectively (Cho et al., Reference Cho2011a). Similar results were observed in the elderly population. According to Korean health insurance review and assessment service (HIRA), the prevalence has increased by 6.4% each year since 2010. However, the prevalence of mental health problems among Korean elderly varies considerably across studies. A recent systematic review indicated that the prevalence of major depressive disorders (MDD) among the Korean elderly ranges from 4.2% to 9.1%, and that of depressive symptoms from 9.1% to 33.0% (Cho et al., Reference Cho, Lee, Kim, Lee and Sohn2011b). One possible reason for this discrepancy could be the methodological issue of using different instruments for screening depression in each survey. Consequently, implementing appropriate measures that are able to screen for depression is critical in order to cope with an increase in the prevalence of depression, understand determinant factors and mechanisms, and establish policies for this issue for the Korean elderly population.
In South Korea, nationwide surveys including the Korean National Health and Nutrition Examination Surveys (KNHANES) have commonly administered a single screening question to identify depression. The question asks respondents, “Have you felt sad or depressed for more than two weeks continuously in the past year?” Several studies have used this single-item measure of depression to investigate the link between socio-economic factors and depressive symptoms and this link's behavioral pathways. Using this single measure, for example, Jung et al. (Reference Jung, Shin and Kang2015) suggested a significant association between depression and secondary smoke. Lee and Kim (Reference Lee and Kim2015) also indicated that marital status, stress, and employment conditions are risk factors for depression in Korean female workers. The single measure for depression has also been used to identify the relationships between depression and chronic diseases. In a study designed to investigate the association between hormone replacement therapy (HRT) and depression, the measure was used to identify depression as a pre-stage for suicidal ideation (Lee et al., Reference Lee2016). Another study also evaluated mental health and suicidal risk in diabetes patients (Chung et al., Reference Chung, Moon, Kim, Min, Kim and Hwang2014). Despite the popular usage of the single-item measure of depression, there is ongoing debate about whether the measure is reliable and valid. Despite the wide use of the indicator in community-based research, the selection process and the validity of the indicator have not been documented well. Researchers argue that the single-item measure of depression might not capture the complex characteristics of depression, which may cause underestimation of mental health problems at the community level. Most importantly, it also may prove inaccurate for theory-based tests.
Various measurement tools or indicators for depression or depressive symptoms have been developed, including the Beck Depression Inventory-II (BDI-II), Center for Epidemiologic Studies Depression Scale (CES-D), Geriatric Depression Scale (GDS), and Patient Health Questionnaire-9 (PHQ-9) (Smarr and Keefer, Reference Smarr and Keefer2011). Among these, CESD and GDS have been validated as effective tools by previous epidemiological studies and have been widely used in social and/or health surveys (Orme et al., Reference Orme, Reis and Herz1986, Stiles and McGarrahan, Reference Stiles and McGarrahan1998; Watson and Pignone, Reference Watson and Pignone2003). Both indicators were developed as screening tools to measure depressive symptoms and identify at risk patients for developing clinical depression. Furthermore, both can also be applied to different target populations: CESD was developed for the general population while GDS was designed for the elderly. These indicators have been administered in health surveys of South Korean elderly populations, including the Korean Longitudinal Study of Aging, the Korea Welfare Panel Survey, and National Survey of Actual Living Conditions of the Elderly.
This study aims to evaluate the accuracy of the single-item depression measure based on two composite indices – the CESD and the GDS – as a gold standard.
Materials and method
Study design
The data used in this study were obtained from the “Health and Functional Capacity of the Elderly Survey” conducted in November 2015 in Seoul, South Korea. The target population was the elderly ranging from 60 to 80 years of age and living in Seoul. A total of 800 subjects were sampled by a two-stage cluster sampling method with proportional allocation by age and sex (using the average of Seoul). The survey was conducted by 37 interviewers using a structured questionnaire in the form of a personal interview and a physical function test. To minimize measurement errors, first, all interviewers were provided with standardized interviewing techniques and protocols. Second, the Computer-Assisted Personal Interviewing (CAPI) method was employed. The reliability of the data collected using CAPI has been reported in a previous study (Manners, Reference Manners1990).
Instruments for measuring depression
We used three instruments for measuring depression in a pre-set order: The CESD, a single question for depressive symptom indicators, and the GDS. The single-item question indicates the presence of depressive symptoms for at least two weeks in the past year. This simple instrument has been used in the KNHANES, and the question is based on the Diagnostic and Statistical Manual of Mental Disorders (DSM-IV), suggesting that the essential feature of a major depressive episode is a period of at least two weeks. During this two-week period there is either the presence of a depressed mood or a loss of interest or pleasure in nearly all activities (1995). The CESD was developed by Radloff LS (Radloff, Reference Radloff1977) as a screening instrument of depression evaluating mood and functionality over the past week. The CESD consists of 20 items, rated on a 4 point Likert-scale ranging from rarely or none of the time (less than one day, score = 0) to most or all of the time (5 to 7 days a week, score = 3), with a summed score spanning from 0 to 60.
The CESD is known to be an accurate and valid instrument for measuring depressive symptoms, which covers four factors of mental disorders: depressed emotion, positive emotion, physical problems (including retarded activities), and problems with interpersonal relationships. On the other hand, the GDS was developed in order to assess depressive symptoms that differentiate between depression and dementia. The first version consists of 30 items, and subsequently a shorter version employing only 15 items was developed because of a lack of concentration in the elderly population (Yesavage et al., Reference Yesavage1983; Yesavage and Sheikh, Reference Yesavage and Sheikh1986). Each item has binary answers, scored by applying 1 for “yes” and 0 for “no”. A summed score ranged from 0 to 30.
Based on the recommendations from prior studies, we used a cut-off value of 20 points for CESD and 8 points for GDS (Cho and Kim, Reference Cho and Kim1998; Bae and Cho, Reference Bae and Cho2004).
In this study, we used translated questions for CESD and GDS. Since the two measures have been widely used in South Korea, several studies investigated the validity of the Korean version of CESD (Cho et al., Reference Cho1993) and GDS (Cho et al., Reference Cho1999).
Ethics statement
The study has been approved by the institutional review board (IRB) of J University (IRB No. 1044297-HR-201504-002-02) and informed consent was provided by all participants prior to the survey.
Statistical analysis
A descriptive analysis was conducted to show the general socio-demographic characteristics and the prevalence of depressive symptoms in the study population. Age (categorized as 60s, 70s, and 80s), sex, marital status (with spouse and others), educational level (university degree or higher, high school, middle school, and elementary school or less), employment status (employed and others), and financial status (rich, middle, and poor in a subjective manner) were used to describe socio-demographic characteristics, and the prevalence from three measurements were estimated in each of the categories using those characteristics.
Second, we evaluated the validity of the single-item question for depressive symptoms with comparisons to the other valid indicators, CESD and GDS. To measure agreement between those indicators, kappa value, area under curve (AUC), and McNemar test statistics were estimated and sensitivity, specificity, positive predictive value (PPV), and negative predictive value (NPV) of the single item were also estimated with the other two indicators as a gold standard. A subgroup analysis of the socio-demographic characteristics was conducted via an identical method. All analyses employed in this study were conducted by SAS 9.4.
Results
General characteristics
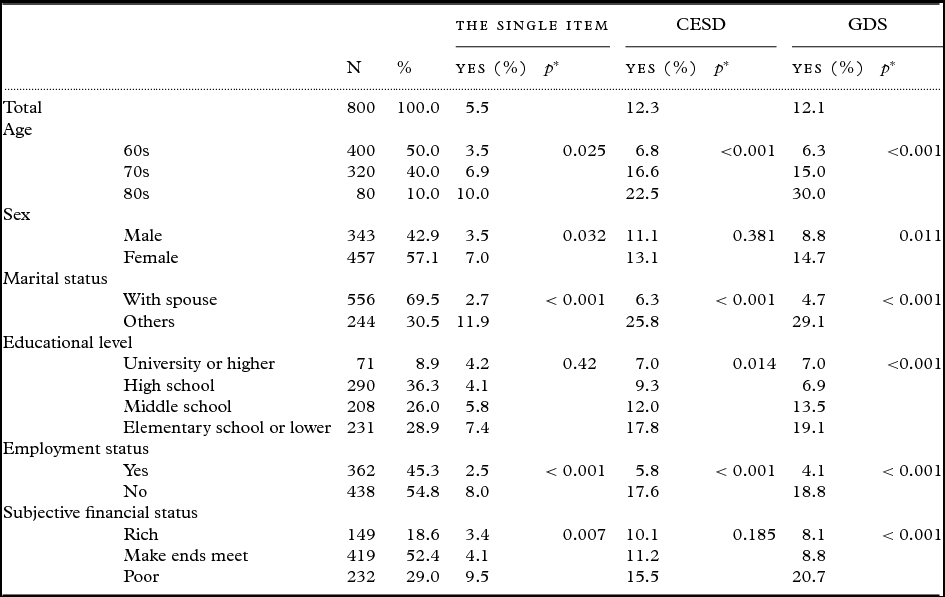
The socio-demographic characteristics of the study population with a prevalence of depressive symptoms were measured using the three instruments shown in Table 1. The age and sex distributions were matched with those of Seoul as described above. The majority of the study participants lived with their spouses and did not have university degrees.
Descriptive characteristics of study population

*χ 2 test.
On the whole, the prevalence from CESD and GDS were similar, but they were approximately two times higher than the prevalence measured by the single-item question. In the single-question measure, different levels of the general characteristics showed significantly different depressive symptom prevalence, with the exception of educational level, but in the CESD measure the difference between male and female was not significant. On the other hand, in the GDS measure, all characteristics were significantly associated with prevalence.
Agreement between indicators of depressive symptoms
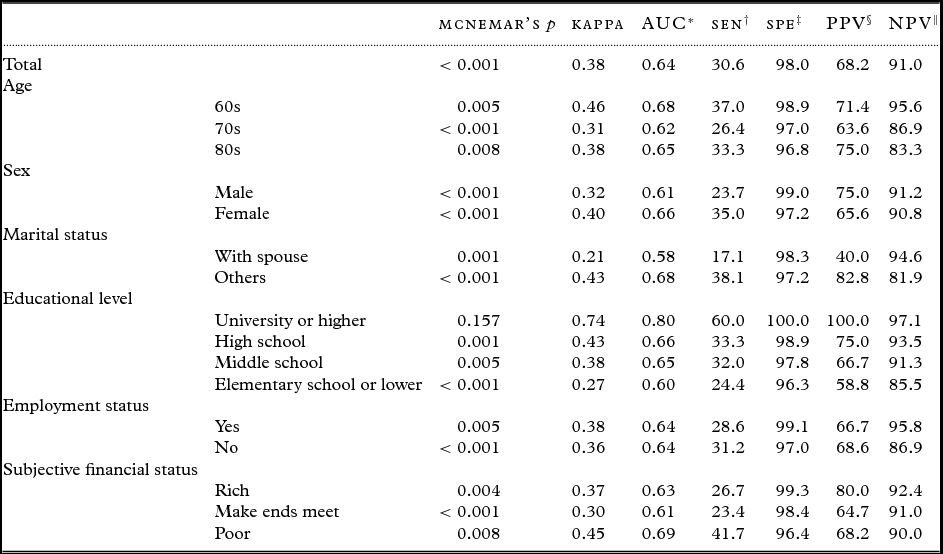
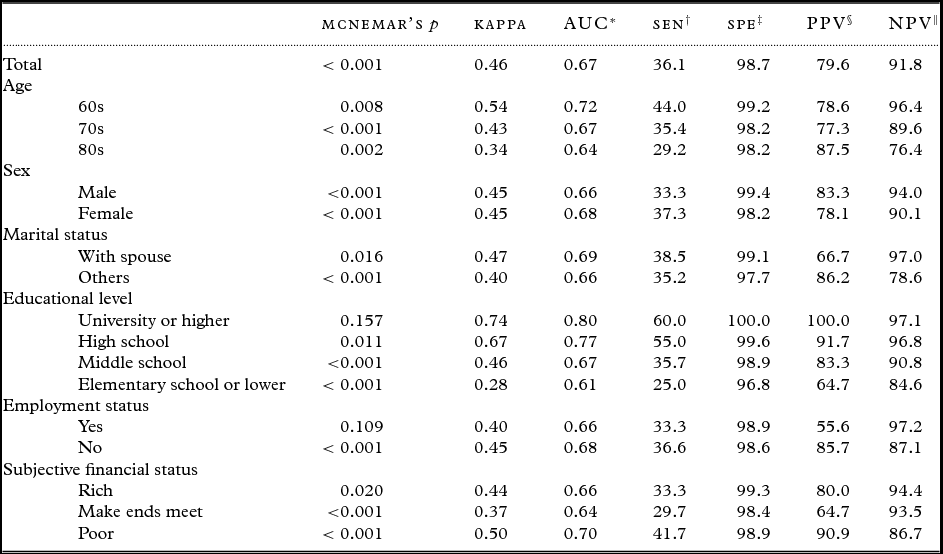
Tables 2 and 3 present the results of the agreement between the three instruments: single-item depression measure, CESD, and GDS. The kappa values in comparison with CESD and GDS were 0.38 and 0.46, respectively, and the AUC was 0.64 and 0.67. Comparing the CESD and GDS with a single item depression measure, the youngest participants and those with university degrees showed a higher kappa value than the other groups.
Validity test of single-depression measure, based on the CESD

* Area under curve.
† Sensitivity.
‡ Specificity.
§ Positive predictive value.
‖ Negative predictive value.
Validity test of single-depression measure, based on the GDS

* Area under curve.
† Sensitivity.
‡ Specificity.
§ Positive predictive value.
‖ Negative predictive value.
Overall, sensitivity based on CESD and GDS was low (30.6% and 36.1% respectively), but specificity was high (98.0% and 98.7% respectively). Sensitivity and specificity differ across socio-demographic factors. Women showed greater sensitivity than men but the direction of specificity was the opposite, in comparison with both CESD and GDS. Married participants showed higher sensitivity, in comparison with CESD, but the direction was not consistent, in comparison with GDS. Those who were unemployed and those who were economically poor also had a higher sensitivity but lower specificity than their counterparts. Participants with higher education (university or higher) and the youngest group (60s) reported greater sensitivity and specificity than their counterparts.
Discussion
This study aimed to evaluate the validity of the single-item measure for depressive symptoms in comparison to two validated composite indices: CESD and GDS. The prevalence of depression by the single-item measure was much lower than that of CESD and GDS (5.5%, 12.3%, and 12.1%, respectively). Furthermore, this suggests that the single-item measure did not achieve acceptable levels of sensitivity. When compared to CESD and GDS, the sensitivity of single-item measures was extremely low: 30.6% and 36.1%. In the subgroup analysis, there was a marked educational discrepancy in sensitivity, and people with a university degree or higher showed about 2.4 times higher sensitivity than those having only a primary school education.
There could be many explanations for the discrepancy of prevalence between the single item and the others. The different contents that each measurement represented could be a major contributor for the discrepancy. CESD incorporates four factors, a depressed affect, positive affect, somatic problems and retarded activity, and interpersonal relationship problems with an emphasis on the depressed affect (Radloff, Reference Radloff1977). On the other hand, GDS examines elderly depression in the affective and cognitive domains, but excludes somatic concerns that are common in the elderly population (Yesavage et al., Reference Yesavage1983). Considering that the single item measure for depression chiefly detects the depressed (or negative) affect, the measure can fail to determine many positive depressive cases that could be observed by the other instruments: CESD or GDS. Furthermore, for Asian cultures, people tend to perceive depression as physical symptoms, called somatization, rather than as emotional symptoms. Thus, measures that only include the negative affect might not be appropriate (Ryder et al., Reference Ryder, Jian and Steven2002). Instead, composite measures that include cognition and somatic symptoms may be more appropriate.
On the other hand, this study showed that the prevalence rates of depression in the elderly were similar between GDS and CESD. However, some studies showed the prevalence in Korean elderly was lower with the GDS method (Li et al., Reference Li, Zhang, Shao, Qi and Tian2014), or opposite to the prevalence indicated by CESD (Qadir et al., Reference Qadir, Haqqani, Khalid, Huma and Medhin2014). These results could be derived from a contextual difference. Considering that there is no significant difference in the performance of the two indicators for the elderly population (Watson and Pignone, Reference Watson and Pignone2003), the results in this study are acceptable.
In terms of inter-rater agreement between the single item and CESD and GDS, the single item in our study showed relatively low sensitivity and high specificity. These results are similar with previous studies in the USA (Corson et al., Reference Corson, Gerrity and Dobscha2004) and in Germany (Blozik et al., Reference Blozik, Scherer, Lacruz and Ladwig2013) that used a similar single-item screener for depressive symptoms (Have you felt depressed or sad much of the time in the past year?) and evaluated its validity using a diagnostic interview (Williams et al., Reference Williams1999) or a 9-item PHQ-9.
There may be several underlying explanations for the higher agreement with GDS than CESD, including the differences in the contents of each measurement. For example, CESD includes somatic symptoms, such as anorexia and insomnia, whereas GDS and the single-item question do not. Consequently, the variations could be derived from this discrepancy, which would be larger in CESD than in GDS.
In this study, we observed significant educational gradients in sensitivity for the single-item depression measure. This finding has some implications. First, the single-item measure may have limitations for detecting somatic symptoms or cognitive functions, captured by CESD or GDS. Less educated people, in fact, not only tend to have more severe forms of depression, including symptomatic, comorbid mental problems, but also are less likely to recognize their symptoms than their educated counterparts (Lorant et al., Reference Lorant, Deliege, Eaton, Robert, Philippot and Ansseau2003; Alonso et al., Reference Alonso2004).
Second, “masked depression” can cause lower sensitivity in people with low education. Since “masked depression” refers to a form of atypical depression, less educated people tend to report more somatic and neuro-vegetative symptoms than affective symptoms (Collins and Abeles, Reference Collins and Abeles1996; Neskes and Jarvik, Reference Neskes and Jarvik1987). For these reasons, less educated people appeared to show lower sensitivity. In contrast, regardless of depression measurements, highly educated elderly seem to report their depressive symptoms accurately.
For an appropriate interpretation of the results shown in this study, several limitations should be considered. First, the sample size used in this study may not be adequate to produce reliable results. However, considering that the target area and age group were limited to Seoul and the elderly population and its well-designed multistage sampling scheme, the sampled population could be representative of the total Seoul population. Also, it is important to consider that CESD and GDS are screening tools for depressive symptoms, and comparing the single-item measure to other tools that are not a gold standard may cause biased results. However, these two indicators have been validated in various contextual settings. Additionally, because CESD and GDS are used in many social and health related surveys, comparing the two indicators has some meaning. The data collection method that we employed has some limitations. For example, we administered questions related to the depression measures in a preset order, and this order might have affected the results. We also cannot ignore the possibility of bias from inter-interviewer differences, although we provided a standardized training program and guidelines to all the interviewers.
The results support the conclusion that the single-question depression measure should be used with caution in the community. In addition, the single-question measure could substantially underestimate the risk group of depressive older adults. In the questionnaire survey, there have been many trials to minimize the burden of participants by using the simplest tools (Ulrich et al., Reference Ulrich, Wallen, Feister and Grandy2005). In this regard, the single-item depression measurement has been used in KNHANES, the representative health survey in South Korea. Considering the poor performance of the single-item depression measure, it cannot be viewed as reliable in estimating the prevalence and risk factors for depression in the elderly population. Considering the importance of KNHANES data as evidence for national health policy, our findings suggest reconsideration of the single-question measure as a depression measure, especially for older Korean adults.
Conflict of interest
None.
Description of authors’ roles
K.D. Min wrote the draft of the manuscript and conducted the statistical analysis. H. Chun designed the study, supervised the data collection, and wrote the paper. I.H. Kim and S.I Cho contributed to development of the statistic model and interpretation and revision of the manuscript.
Acknowledgment
This work was supported by South Korea Research Foundation (NRF-2014S1A3A2035458; NRF-2013R1A1A1076139; NRF-2017R1D1A3- B03028703).