1. Introduction
Many structural studies have focused on ‘ideal’ extensional or strike-slip controlled basins. There is also increasing interest in transtensional basins where the angle between the rift boundary and the displacement direction is >0° but <90°. Some transtensional basins are well exposed (e.g. Death Valley, California: Unruh, Humphrey & Barron, Reference Unruh, Humphrey and Barron2003), allowing a detailed structural analysis of a range of lithologies of different age in all parts of a basin. However, for the majority of transtensional basins, the exposure, lithologies or access are less than ideal for structural analysis. Despite this, such basins can be effectively interpreted by integrating a range of structural, sedimentological and geophysical information. We demonstrate this multi-disciplinary approach here for the neotectonic Hatay Graben in the easternmost Mediterranean region, in an area undergoing diachronous collision of the African and Eurasian plates. We first outline the regional importance of the Hatay Graben and alternative tectonic models that have been proposed to explain its formation. Several alternative tectonic hypotheses are outlined that can be tested using a combination of field structural, Global Positioning System (GPS) and seismicity data. Field-based information includes fault types, fault patterns and kinematic measurements, and statistically derived stress analysis. We use the entire database to test the alternative tectonic hypotheses for graben formation and then develop a new tectonic model that highlights the importance of transtension in an area of tectonic escape. Our results also help to constrain the plate configuration of a critical tectonically active area of the eastern Mediterranean region that is located at the boundary between an area of collision to the east and a pre- or syn-collisional area to the west.
2. Regional tectonic setting
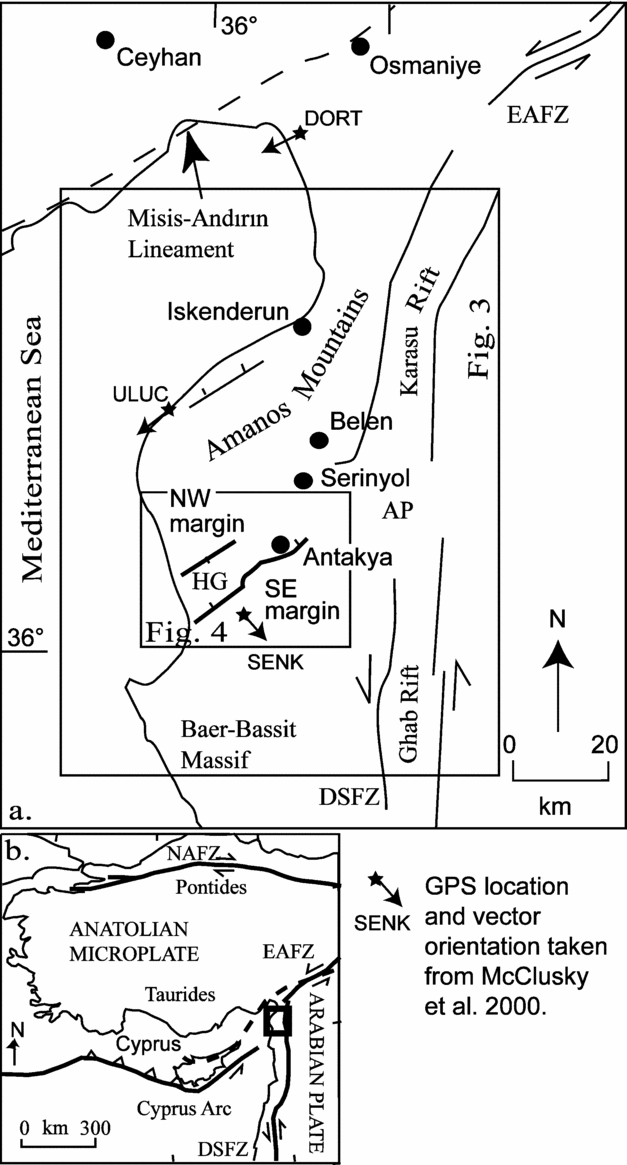
The Hatay Graben (Fig. 1) is located in south-central Turkey, near the intersection of several regional-scale structural lineaments of Cenozoic age, namely the Dead Sea Fault Zone, the East Anatolian Fault Zone and the Cyprus Arc. The Dead Sea Fault Zone accommodates relative motion between the African and Arabian plates through sinistral strike-slip (Freund, Reference Freund1965; Mart & Rabinowitz, Reference Mart and Rabinowitz1986). The Dead Sea Fault Zone trends N–S from a sea-floor spreading centre in the Red Sea in the south to the northern boundary of the Arabian plate, a zone of sinistral strike-slip along the East Anatolian Fault Zone. Initiation of motion along the Dead Sea Fault Zone occurred first in the south sometime during the Miocene (dated as <20 Ma: Lyberis, Reference Lyberis1988 or 18 Ma: Garfunkel & Ben-Avraham, Reference Garfunkel and Ben-Avraham1996) as a result of the opening of the Gulf of Suez.
(a) Regional map with boxes indicating the position of Figures 3 and 4. AP – Amik Plain; HG – Hatay Graben; EAFZ – East Anatolian Fault Zone; DSFZ – Dead Sea Fault Zone; DORT, ULUC and SENK indicate position of GPS stations, GPS vectors (star with an arrow; McClusky et al. Reference McClusky, Balassanian, Barka, Demir, Ergintav, Gurkan, Hamburger, Hurst, Kahle, Kastens, Kekelidze, King, Kotzev, Lenk, Mahmoud, Mishin, Nadariya, Ouzounis, Paradissis, Peter, Prilepin, Reilinger, Sanli, Seeger, Tealeb, Toksoz and Veis2000) are shown for these locations. (b) Neotectonic map of the Eastern Mediterranean region; box indicates position of the main map.

The East Anatolian Fault Zone, together with the North Anatolian Fault Zone, accommodates the westward extrusion of Anatolia, which is a response to the progressive collision of Eurasian and African plates. The timing of East Anatolian Fault Zone initiation is not well constrained; suggested ages range from Late Miocene–Early Pliocene (Şengör, Görür & Şaroğlu, Reference Şengör, Görür, Şaroğlu, Biddle and Christie-Blick1985; Arpat & Şaroğlu, Reference Arpat and Şaroğlu1972) to Late Pliocene (Yürür & Chorowicz, Reference Yürür and Chorowicz1998; Westaway & Arger, Reference Westaway and Arger1998). By contrast, the timing of activation of the dextral North Anatolian Fault Zone is better constrained as earliest Pliocene (~5 Ma: Barka & Kadinsky-Cade, Reference Barka and Kadinsky-Cade1988).
The Cyprus Arc, to the south of Cyprus, is considered to be an active plate boundary, which accommodates convergence between Africa and Anatolia in this region (Ben-Avraham, Reference Ben-Avraham1978; Kempler & Garfunkel, Reference Kempler and Garfunkel1994). To the south of Cyprus the boundary coincides with a deep-sea trench (Robertson et al. Reference Robertson, Kidd, Ivanov, Limonov, Woodside, Galindozaldivar and Nietol995). However, further east the plate boundary is ill-defined, with several different interpretations of its position: (1) there is no plate boundary in the area (Ben-Avraham, Reference Ben-Avraham1978); (2) two boundary segments exist to the north and south of Cyprus (Lort, Reference Lort1971; Le Pichon & Angelier, Reference Le Pichon and Angelier1979); (3) a zone of active convergence extends from Cyprus through the Iskenderun Basin to the Kahramanmaraş triple junction where the East Anatolian Fault Zone and Dead Sea Fault Zone meet (McKenzie, Reference McKenzie1978; Dewey & Şengör, Reference Dewey and Şengör1979); (4) the plate boundary is a wide diffuse zone dominated by sinistral strike-slip (Kempler & Garfunkel, Reference Kempler and Garfunkel1994; Robertson, Reference Robertson, Robertson, Emeis, Richter and Camerlenghi1998; Vidal, Alvarez-Marron & Klaeschen, Reference Vidal, Avarez-Marron and Klaeschen2000; Harrison et al. Reference Harrison, Newell, Batihanli, Panayides, McGeehin, Mahan, Özhür, Tsiolakis and Necdet2004), with the most southerly boundary of this zone of deformation extending onshore in northern Syria (Hardenberg & Robertson, Reference Hardenberg and Robertson2007).
3. Geological setting of the Hatay Graben
The Hatay Graben is an asymmetrical fault-controlled basin trending NE–SW from the Mediterranean Sea, past the city of Antakya/Hatay to the Amik Plain. This type area was previously considered as the extension of another approximately N–S-trending graben to the northeast (Fig. 1), variously known as the Hatay Graben (Perinçek & Çemen, Reference Perinçek and Çemen1990), the Amanos Fault Zone (Lyberis et al. Reference Lyberis, Yürür, Chorowitcz, Kasapoğlu and Gündoğdu1992; Över, Ünlügenç & Bellier, Reference Över, Ünlügenç and Bellier2002) or the Karasu Rift (Lovelock, Reference Lovelock1984; Westaway, Reference Westaway1994; Rojay, Heimann & Toprak, Reference Rojay, Heimann and Toprak2001). Here, the NE–SW-trending graben extending from the coast to near Antakya is termed the ‘Hatay Graben’, which includes the city of Antakya/Hatay, whereas the northern approximately N–S structure is defined as the Karasu Rift (Fig. 1). A general account of the geological development of the Hatay Graben was recently published, based on new data (Boulton, Robertson & Ünlügenç, Reference Boulton, Robertson, Ünlügenç, Robertson and Mountrakis2006), which also considered several early interpretations of the Hatay Graben (Dubertret, Reference Dubertret1955; Tinkler et al. Reference Tinkler, Wagner, Delaloye and Selçuk1981; Pişkin et al. Reference Pişkin, Delaloye, Selçuk and Wagner1986). Here, we focus on more recent structural interpretations of the Hatay Graben in relation to the Karasu Rift further north.
Boulton, Robertson & Ünlügenç (Reference Boulton, Robertson, Ünlügenç, Robertson and Mountrakis2006) outlined the latest Cretaceous to Recent development of the Hatay Graben, based on a combination of stratigraphic, sedimentological and structural evidence. The Hatay Graben was interpreted to have formed in two different tectonic settings at different times. A Miocene basin (‘Hatay basin’) formed first in the area of the Hatay Graben and is interpreted as the distal, southerly part of a foreland basin associated with the collision of the Anatolian (Eurasian) and Arabian (African) plates. Stratigraphic and sedimentological data concerning this Miocene stage of development are given by Boulton, Robertson & Ünlügenç (Reference Boulton, Robertson, Ünlügenç, Robertson and Mountrakis2006), Boulton & Robertson (Reference Boulton and Robertson2007) and Boulton et al. (Reference Boulton, Robertson, Ellam, Safak and Ünlügenç2007). The present topographic graben (the Hatay Graben sensu stricto) formed during during Plio-Quaternary times during a second phase of tectonic development. This phase relates to the westward tectonic escape of Anatolia following the Eurasia/Africa collision and is the main subject of this paper.
3.a. Alternative tectonic models
Published tectonic models fall into two classes, the first of which assumes a constant regional strain during Miocene–Recent time and a second which assumes changes in strain with time.
Strike-slip models. Several authors have inferred that the Hatay Graben formed in a sinistral strike-slip-controlled system involving extension at a releasing bend and the formation of, variously, a pull-apart basin (Perinçek & Çemen, Reference Perinçek and Çemen1990), a half-graben (Lyberis et al. Reference Lyberis, Yürür, Chorowitcz, Kasapoğlu and Gündoğdu1992) or a graben (Muehlberger, Reference Muehlberger1981; Perinçek & Çemen, Reference Perinçek and Çemen1990). Rojay, Heimann & Toprak (Reference Rojay, Heimann and Toprak2001) proposed that the Hatay Graben (their Antakya–Samandağ depression) represents a releasing bend on a larger-scale strike-slip zone represented by the Karasu Rift (Figs 1, 2a). Most of their data came from the Karasu Rift, but they also reported some data for faults in the Hatay Graben. Other authors envisaged the Hatay Graben as a strike-slip, transtensional or extensional basin related to an eastward extension of the Cyprus Arc (Kempler & Garfunkel, Reference Kempler and Garfunkel1994; Ben-Avraham et al. Reference Ben-Avraham, Tibor, Liminov, Leybov, Ivanov, Tokarev and Woodside1995; Yürür & Chorowicz, Reference Yürür and Chorowicz1998). This lineament might link through the Hatay Graben to the Karasu Rift to the northeast (fig. 2b, c), and relate regionally to the westward tectonic escape of Anatolia (Yürür & Chorowicz, Reference Yürür and Chorowicz1998).
The four different models proposed for the development of the Hatay Graben: (a) extension at a releasing bend in a strike-slip-controlled fault system (Muehlberger, Reference Muehlberger1981; Perinçek & Çemen, Reference Perinçek and Çemen1990; Lyberis et al. Reference Lyberis, Yürür, Chorowitcz, Kasapoğlu and Gündoğdu1992); (b) a graben resulting from the westward escape of Anatolia (Yürür & Chorowicz, Reference Yürür and Chorowicz1998); (c) a strike-slip or transtensional basin related to the Cyprus Arc to the west (Kempler & Garfunkel, Reference Kempler and Garfunkel1994; Ben-Avraham et al. Reference Ben-Avraham, Tibor, Liminov, Leybov, Ivanov, Tokarev and Woodside1995; Yürür & Chorowicz, Reference Yürür and Chorowicz1998); (d) a transtensional graben formed as a result of Pliocene-Quaternary strike-slip superimposed on older basement faults of the Arabian Platform (Boulton, Robertson & Ünlügenç, Reference Boulton, Robertson, Ünlügenç, Robertson and Mountrakis2006).

Multi-phase model. Över, Ünlügenç & Bellier (Reference Över, Ünlügenç and Bellier2002) interpreted the Plio-Quaternary to present-day stress regime of the Hatay Graben based on field measurements of faults and earthquake focal plane solutions. They concluded that there was a change from an older, strike-slip to a younger, normal fault regime that reactivated pre-existing faults. However, they gave little explanation of how this could fit into the regional tectonic setting.
Transtensional model. Boulton, Robertson & Ünlügenç (Reference Boulton, Robertson, Ünlügenç, Robertson and Mountrakis2006) proposed that the Hatay Graben formed as a result of Pliocene–Quaternary transtension generally related to westward tectonic escape of Anatolia (fig. 2d). This deformation followed on from the development of the Miocene Hatay basin as the distal part of a foreland basin related to collision of the African (Arabian) and Eurasian (Anatolian) plates.
Each of the above tectonic models can be tested utilizing the structural dataset we have assembled during this work, especially when combined with other evidence including seismicity and GPS data (summarized below).
4. GPS vectors and seismicity
GPS provides an invaluable tool for investigating and quantifying instantaneous crustal displacements in the Eastern Mediterranean region (McClusky et al. Reference McClusky, Balassanian, Barka, Demir, Ergintav, Gurkan, Hamburger, Hurst, Kahle, Kastens, Kekelidze, King, Kotzev, Lenk, Mahmoud, Mishin, Nadariya, Ouzounis, Paradissis, Peter, Prilepin, Reilinger, Sanli, Seeger, Tealeb, Toksoz and Veis2000). Although there are no GPS stations within the Hatay Graben itself, there are three relevant stations in the region: SENK (near Senköy, south of the field area; Fig. 1), ULUC (near Uluçınar, in the Iskenderun Basin; Fig. 1) and DORT (near Dörtyöl, also in the Iskenderun Basin; Fig. 1).
Using a Eurasia-fixed reference frame, the data from these three stations exhibit anticlockwise rotations consistent with plate motion vectors across Anatolia (McClusky et al. Reference McClusky, Balassanian, Barka, Demir, Ergintav, Gurkan, Hamburger, Hurst, Kahle, Kastens, Kekelidze, King, Kotzev, Lenk, Mahmoud, Mishin, Nadariya, Ouzounis, Paradissis, Peter, Prilepin, Reilinger, Sanli, Seeger, Tealeb, Toksoz and Veis2000). The Hatay area can thus be considered to form part of an Anatolian microplate, north of the East Anatolian Fault Zone and east of the Dead Sea Fault Zone. However, in an Arabia-fixed reference frame, DORT and ULUC show a similar velocity to the Anatolian stations, but SENK has a vector directed to the SE (Fig. 1; McClusky et al. Reference McClusky, Balassanian, Barka, Demir, Ergintav, Gurkan, Hamburger, Hurst, Kahle, Kastens, Kekelidze, King, Kotzev, Lenk, Mahmoud, Mishin, Nadariya, Ouzounis, Paradissis, Peter, Prilepin, Reilinger, Sanli, Seeger, Tealeb, Toksoz and Veis2000). These GPS vectors are directed in opposing directions, implying the existence of sinistral oblique-extension. McClusky et al. (Reference McClusky, Balassanian, Barka, Demir, Ergintav, Gurkan, Hamburger, Hurst, Kahle, Kastens, Kekelidze, King, Kotzev, Lenk, Mahmoud, Mishin, Nadariya, Ouzounis, Paradissis, Peter, Prilepin, Reilinger, Sanli, Seeger, Tealeb, Toksoz and Veis2000) suggest that a plate boundary could exist between ULUC and SENK, in effect within the Hatay Graben. The limited available GPS evidence is therefore consistent with a tectonic model of the Hatay Graben involving oblique extension (transtension).
The Hatay Graben is known to be tectonically active, and thus present and historical seismicity is potentially useful to test alternative tectonic hypotheses. The USGS National Earthquake Information Centre (NEIC) lists 30 earthquakes that have occurred during the last twenty years in the area, extending from 35.9° N to 36.75° N and 35.76° E to 36.7° E (Table 1). Several of the earthquakes appear to define a NE–SW linear trend, within the Hatay Ophiolite and offshore areas (Fig. 3). However, the calculated epicentres of these earthquakes should be treated with caution because the errors in the location can be as much as 10–15 km (see Jackson, Reference Jackson2001 for a discussion of problems in calculating epicentre position).
Recent earthquakes in the Hatay region

Earthquake data for the Hatay area from 1977 to the present, downloaded from the National Earthquake Information Centre (NEIC) of the USGS (http://neic.usgs.gov/neis/epic/epic_rect.html; accessed 07/11/07).
Map showing the coast and the main faults in the Hatay region, with earthquake information overlain (data acquired from the USGS NEIC). Focal mechanisms are shown for two earthquakes, the only ones in the field area with focal mechanism data available.

According to the USGS catalogue, all the earthquakes are relatively shallow (<46 km) but those with epicentres near the axis of the graben are generally deeper (21–41 km) than those on the margins (~10 km), although depth calculations may also be subject to error (e.g. Kagan, Reference Kagan2003).
The calculated focal mechanisms of the earthquakes are consistent with dip-slip to oblique-slip faulting (M. Erdik and others, unpub. Kandilli Observatory Report, 1997; Över, Ünlügenç & Bellier, Reference Över, Ünlügenç and Bellier2002; Över et al. Reference Över, Kavak, Bellier and Özden2004; Global CMT catalogue, formerly the Harvard CMT catalogue). Stress inversion carried out on these seismic data by Över, Ünlügenç & Bellier (Reference Över, Ünlügenç and Bellier2002) suggest that σ1 is vertical, corresponding to normal faulting with σ3 trending 051°.
In addition, there is evidence from historical earthquakes. Between the founding of Antakya (c. 300 bce) and 1000 ce, the area experienced thirteen significant earthquakes (Table 2) (Guidoboni, Comastri & Traina, Reference Guidoboni, Comastri and Traina1994). At least three large earthquakes took place between the late 10th century and 1899, when a seismic station was installed in the Eastern Mediterranean (Al-Tarazi, Reference Al-Tarazi1998). One of these earthquakes on the 20th November 1114 was of magnitude ~7 (Al-Tarazi, Reference Al-Tarazi1998), while others on the 29th June 1169/1170 and 29th December 1408 had estimated magnitudes of >7.5 (Akyuz et al. Reference Akyuz, Altunel, Karabacak and Yalciner2006). Two large earthquakes also occurred during the 19th century: a magnitude 7.4 earthquake on August 13th, 1822 and a M≈7.2 on April 13th, 1872 (Över, Ünlügenç & Bellier, Reference Över, Ünlügenç and Bellier2002). The Hatay area was thus affected by earthquake activity throughout the historic era.
Historical earthquake data for the Hatay area

*Guidoboni, Comastri & Traina (Reference Guidoboni, Comastri and Traina1994); †Al-Tarazi (Reference Al-Tarazi1998); ‡Över, Ünlügenç & Bellier (Reference Över, Ünlügenç and Bellier2002).
The seismicity data, therefore, point to a tectonic model that would involve crustal extension in and around the Hatay Graben, although these data indicate a pure-extension regime; the limited available GPS data indicate transtension. However, it should be noted that our structural data, as set out below, were mainly collected from pre-Pleistocene sediments and may thus be representative of a time when the regional stress patterns differed from the Recent.
5. Field data
The faults exposed in the Hatay Graben are mostly normal, oblique and strike-slip in nature. These are made up of: (1) basin-bounding normal faults and major oblique-slip faults. These faults are designated ‘first-order structures’, with >1 km in length and >500 m in throw based on measured offsets of stratigraphy and inferences from topography; (2) map-scale faults, defined as ‘second-order faults’, are 10 m to 1 km in length, with throws of several to hundreds of metres based on stratigraphic offsets. These faults are mostly observed along the flanks of the graben; (3) minor outcrop-scale faults, defined as ‘third-order faults’, <10 m in length, with small observed throws of generally <1 m throughout the area. Good structural data are mainly obtained from third-order faults, as larger faults are commonly eroded or poorly exposed. Third-order faults pervasively deform the sediments in the axial zone of the graben. In addition, jointing is commonly developed, especially associated with third-order faults.
5.a. First-order structures
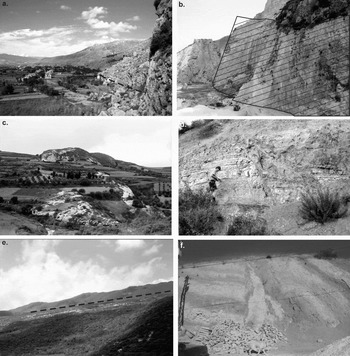
First-order normal faults are characterized by NW-dipping faults that are present along the SE margin of the Hatay Graben (Figs 4, 5a). Fault planes are generally eroded but still have a strong topographic expression. In the NE of the field area, adjacent to the city of Antakya, basin-scale faults displace Upper Cretaceous or Eocene limestone, and Upper Cretaceous ophiolitic rocks against Plio-Quaternary graben sediment fill (fig. 5b). Two large normal faults define the edge of the graben in this area where the width of the graben margin, defined as the area between the innermost and outermost boundary faults, is estimated as 4 km. The innermost fault has the greater throw (>500 m), although the outer fault also has significant throw (>200 m). Further south, the width of the graben margin increases to about 10 km. First-order faults form two en échelon arrays of sub-parallel fault segments that step away from the axis of the graben (fig. 4b, c). The outer array comprises three main segments, whereas the inner array is shorter, comprising two fault segments. This second array is truncated, possibly by a transverse fault that is orientated at a high angle to the graben in this area (Fig. 4). Near Antakya, two normal fault segments overlap to form a relay ramp that exhibits relay-breaching faults, which are at an oblique angle and link the two boundary faults (fig. 4c). This relay ramp forms a minor half-graben (<10 km2) on the flank of the main graben and is cut by dominantly NE–SW-trending faults, although NW–SE faults also cross-cut these faults.
(a) Inset graphic in top left shows the zones used to divide fault data. (b) Geological map of the Hatay Graben; lines A–A' and B–B' indicate the position of the cross-sections (c) and (d) below, respectively; TF – inferred transfer fault; modified from Boulton, Robertson & Ünlügenç (Reference Boulton, Robertson, Ünlügenç, Robertson and Mountrakis2006). Positions of the photographs in Figures 5 and 7 are indicated by stars and a letter. Boxes indicate spatial extent of Figures 6 and 8.

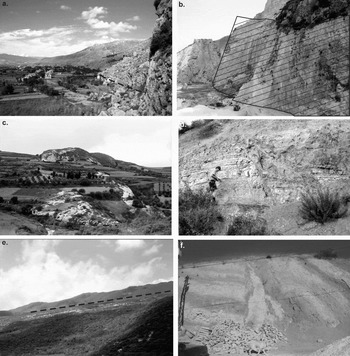
(a) View to the north along the innermost fault plane on the southwestern margin, near the present coast; note a prominent fault scarp in the foreground, width of view about 1 km. (b) View along major fault plane (~10 m high) east of Antakya cutting Upper Cretaceous and Eocene limestone, downthrowing to the left/west towards the graben floor; orientation of main fault plane 160°/67 °W. (c) View of limestone horsts (furthest is 500 m away) bounded by normal faults near Sebenoba; the softer marl is covered with crops. (d) Normal faults in Pliocene sandstone and marl in the axis of the graben, outcrop about 8 m wide. (e) View to the NW of the first-order oblique-slip fault observed near the coast cutting Middle Miocene limestone, width of view ~2 km. Figure 6 is a topographic map of this fault. (f) Photograph of the vertical shear zone (1 m wide) observed near Kesecik.
As noted above, first-order normal faults are uncommon on the northwestern margin of the graben (fig. 4b). None were observed in the northwest but a few do occur on the coast near Çevlik, striking NE–SW. The outer faults expose Middle Miocene limestone in the footwall and Upper Miocene marl in the hangingwall. The innermost faults cut Upper Miocene sediments at the surface. The magnitude of the throw on these faults is unknown as there are no exposed stratigraphic constraints.
The majority of first-order faults trend parallel or sub-parallel to the graben. In addition, a large NW–SE-striking transverse fault is inferred, running along the course of the Karaçay (fig. 4b). The evidence for this is: (1) numerous faults strike NW–SE in the vicinity; (2) there is a stratigraphic offset on the northern margin of the graben across the Karaçay valley; (3) there is a difference in the height of the graben margin on either side of the Karaçay and (4) to the south, one of the graben-parallel boundary faults appears to terminate at the Karaçay.
5.b. Second-order normal faults
Second-order normal faults are exposed along the margins of the graben and also cut the graben sediment fill. Movements along normal faults striking at a high angle to the trend of the graben have resulted in back-rotation of fault blocks. For example, a second-order fault strikes E–W through the Harbiye gorge at a high angle to the graben margins near Harbiye (Fig. 4). This fault, a probable dip-slip or oblique-slip fault, displaces Upper Cretaceous and Eocene limestone by tens of metres. In addition, many third-order E–W-striking faults are present in the vicinity.
A zone of intense deformation is present between two basin-bounding faults near the village of Sebenoba in the southeast (Figs 4, 5c). Two main populations of faults are observed there: NE–SW-striking (basin-parallel) and NW–SE-striking (basin-perpendicular). Together, these faults form a series of horst–graben structures, in which blocks of well-lithified Middle Miocene limestones have been uplifted, whereas Upper Miocene marls have been downthrown. Both sets of faults are generally extensional, although a few show reverse slip. Fault planes are planar and are associated with narrow zones (<25 cm) of fault breccia composed of hard limestone clasts. The two fault populations (NW–SE and NE–SW-striking faults) repeatedly cross-cut each other, but despite careful examination, do not exhibit any systematic relative chronology. Furthermore, it has not been possible to establish any systematic chronology of faulting throughout the Hatay Graben as a whole (Boulton, Robertson & Ünlügenç, Reference Boulton, Robertson, Ünlügenç, Robertson and Mountrakis2006).
Another zone of map-scale faulting that is situated between two basin-bounding faults was observed in the north, east of Antakya (fig. 4a). In this area, faulting has resulted in back-rotation of a large fault-block (~4 × 1 km) between two first-order faults and the formation of an intervening sub-basin. Smaller (second- and third-order) synthetic and antithetic faults are mostly orientated parallel to the boundary faults. These are planar dip-slip faults with a throws of <5 m metres, placing Eocene limestones against Upper Miocene marls and thereby forming a series of small horst and graben structures. Cross-cutting third-order faults trend NW–SE, with measured offsets of <5 m.
5.c. Third-order normal faults
Third-order normal faults are common at outcrop-scale and in sediments of all ages (latest Cretaceous–Pliocene), on both the floor and the flanks of the graben (fig. 5d). For example, a first-order graben-bounding fault cuts latest Cretaceous to Eocene sediments in a quarry near the village of Dursunlu (fig. 4a), downthrowing to the west. The exposed fault plane has been quarried (fig. 5b), revealing a series of third-order conjugate dip-slip and oblique-slip faults that strike at a high angle to the boundary fault; unfortunately, the relationship between the boundary fault and the smaller faults has been concealed by the quarrying.
5.d. First-order oblique-slip faults
First-order oblique-slip faults are uncommon in the Hatay Graben, although one was identified on the NW margin, near the village of Yoğunoluk (Figs 4, 5e). The sense of movement cannot be determined directly from structural measurements and there is no direct evidence of the age of this fault. However, landscape features provide an indication of the sense of movement and age of the fault. First, there is evidence of sinistral offset of streams by at least 100–150 m. Strike-slip faulting has separated the upper and lower stream courses creating a left-lateral ‘dog-leg’ across the fault (Fig. 6). Second, there is a vertical component of motion along this fault as shown by noticeable differences in height (~150 m) between the footwall and hangingwall; also, streams are more incised on the footwall compared to the hangingwall. There is also evidence of ‘beheaded streams’, where fault motion has been greater than the capacity of the streams to down-cut so that the catchments and downslope segments of the stream have become separated across the fault zone. The presence of stream offset and ‘beheaded streams’ suggests that this first-order oblique-slip has been active at least during later Quaternary times.
SPOT image of the fault plane shown in Figure 5e. Note the geomorphological evidence for lateral motion on the fault plane, for example, offset and beheaded streams. Excerpt of SPOT image (shown top left) 5 118–278 06/11/23 08:21:49 2 J, copyright CNES (2007), Distribution Spot Image, S.A., France, all rights reserved.

In addition, some first-order normal faults along the SE margin could be oblique-slip in nature, but the kinematics of these faults is unknown because slickenlines are not preserved.
5.e. Third-order oblique-slip faults
Third-order oblique slip faults are only recognized in the field where there is a three-dimensional exposure or the presence of slickenlines. One such fault was observed near the village of Güneysöğüt (fig. 4b), where a vertical fault plane (117/90°) has a throw of 2 m, offsetting Pliocene sandstone and Quaternary conglomerate along a 40 cm wide fault zone (fig. 7a).
(a) Third-order oblique-slip fault in Plio-Quaternary sediments in the graben; the fault plane is vertical (117°/90°) with 2 m vertical offset; the horizontal motion is unknown. (b) Series of third-order strike-slip faults (174°/90°W, 168°/77°W, 180°/56°W) with low-angle slickenlines (6–7°) in Pliocene sandstones adjacent to the basin-bounding fault in the southwest. Note the sinistral motion on faults. Compass is 20 cm long.

5.f. Third-order strike-slip faults
Third-order strike-slip faults are common at an outcrop scale especially in sediments of Pliocene age. Good examples were observed near Kesecik (fig. 4b), where a small-scale flower structure is exposed. In this outcrop the main fault strikes at 140° with a dip of 90° and splays upwards into three smaller faults. Local changes in bedding orientation indicate that the sediments between these faults have been rotated. Another vertical shear zone was observed at the same location (Fig. 5f). Although the geometry is less clear in this instance, the sediments on either side of the shear zone are deformed and do not correlate across the shear zone. In many other locations, strike-slip faults are inferred based on the presence of small offsets (<10 cm) or lack of vertical offset across a vertical fault plane. For example, small strike-slip faults are observed south of Samandağ (fig. 4b), where three sub-parallel sinistral strike-slip faults (fig. 7b) are present within a deformed zone adjacent to a first-order basin-bounding fault. Where a sense of motion can be determined in the field, it was found that sinistral strike-slip faults (N = 31) are more common than dextral faults (N = 10). The sinistral strike-slip faults show no preferred orientation (that is, all points of the compass are represented), whereas the dextral faults are generally orientated NE–SW or NW–SE.
In addition, significant variation was observed in the orientations of bedding planes within Pliocene sediments near Samandağ; locations <200 m apart exhibit differences in dip direction of >90° (Fig. 8). This variation is considerably more than can be accounted for by primary depositional processes and thus a tectonic cause is inferred, possibly relating to block rotation along a strike-slip zone (see below).
Topographic map (derived from SRTM data; source for this dataset was the Global Land Cover Facility, www.landcover.org) showing the location of Pliocene sediments and the strike of the bedding planes at various locations (see Fig. 4 for location within the Hatay Graben); inset rose diagrams show the orientation of third-order faults measured at those locations.

5.g. Third-order reverse faulting
Reverse faults are uncommon within the Hatay Graben. Where present, they are always small, third-order structures with a maximum displacement of <10 m, and commonly associated with normal, oblique-slip, or strike-slip faults. For example, reverse faults associated with normal faults were observed in the Sebenoba area (fig. 4b). In addition, reverse faults are spatially associated with strike-slip faults near Kesecik (fig. 4b).
5.h. Evidence of folding
There is little evidence of compressional folding in the Hatay Graben. Folding was not generally observed in post-Eocene units. A gentle fold was observed on the main road between Antakya and Samandağ; however, this is closely associated with normal faults and is interpreted as a drag fold.
By contrast, Eocene strata are extensively folded, as seen to the east of Antakya, where medium-bedded calcarenites are folded into disharmonic, asymmetrical, gentle folds. The dip of the bedding in this area is nearly vertical in places. Further north, around the towns of Belen and Kırıkhan, the Eocene strata are more deformed. Folding there is highly variable, but fold vergence was observed as always being towards the NW or W. Fold geometry ranges from open to tight and angular folds; fold axial planes are widely dispersed and the fold wavelengths are <5 m. The largest fold observed in the study area is a N-vergent monocline deforming the boundary between the Hatay Ophiolite and the Upper Cretaceous limestones south of Harbiye.
6. Fault orientation data
6.a. Fault trends and patterns
In total, more than 850 measurements of fault planes were made in the Hatay Graben. Most of these are of third-order faults, which are generally better exposed than the first- and second-order faults. The data include measurements of strikes and dips, fault displacements and the orientations of slickenlines on fault planes (Appendix; available online as supplementary material at http://multimediafluids.uam.elogim.com/journals/geo). In addition, thirteen fault planes showed two sets of lineations, but no relative chronology could be determined in these cases.
When all the data are considered together, the majority of the faults strike between 60° and 140°. There are three main trends in strike direction: NE–SW, NW–SE, N–S. The majority of the faults dip at >50°. There is no clear relationship between fault orientation and angle of dip (fig. 9a). When the strike of a fault is compared to the rake of the lineations on its fault plane (fig. 9b), there is no obvious trend. The rakes of the lineations are highly variable and show no preferred relationship with the dip angles of the fault planes (fig. 9c). This lack of a clear relationship between dip and rake implies these faults do not satisfy coulomb theory that predicts an inverse relationship between the magnitude of rake and dip of the fault plane, and thus these faults instead record 3D-strain (Reches & Dieterich, Reference Reches and Dieterich1983; ten Veen & Kleinspehn, Reference ten Veen and Kleinspehn2002).
(a) Graph showing the strike of faults against the dip, for all data (n = 880). (b) Graph showing the strike of faults against the rake of any lineation measured upon the fault (n = 244). (c) Graph showing the dip of the fault plane against the rake of lineations present (n = 244).

To refine the interpretation, the structural data were divided into sub-groups and analysed in several ways. This approach has been shown to be effective in other regions (e.g. Rhodes, Greece: ten Veen & Kleinspehn, Reference ten Veen and Kleinspehn2002) in order to counterbalance the limitations of fault data due to heterogeneity of fault populations.
First, the data were divided into structural ‘zones’ (Fig. 10) to assess any spatial variation in fault population. Six zones were accordingly defined for the Hatay Graben, three for the graben floor and three for the flanks of the graben (labelled 1–6; fig. 4a). Zone 1 covers the NW graben margin and zones 2 and 3 the graben floor. The recognition of zones 2 and 3 takes into account the proposed transverse fault that strikes perpendicular to the graben margins along the course of the Karaçay valley (fig. 4b). This structure also defines the NE edge of zone 4 that is represented by an uplifted block between the graben floor and its SE margin. Zones 5 and 6 are delineated on the SE graben margin, again recognized by the location of the possible transverse fault.
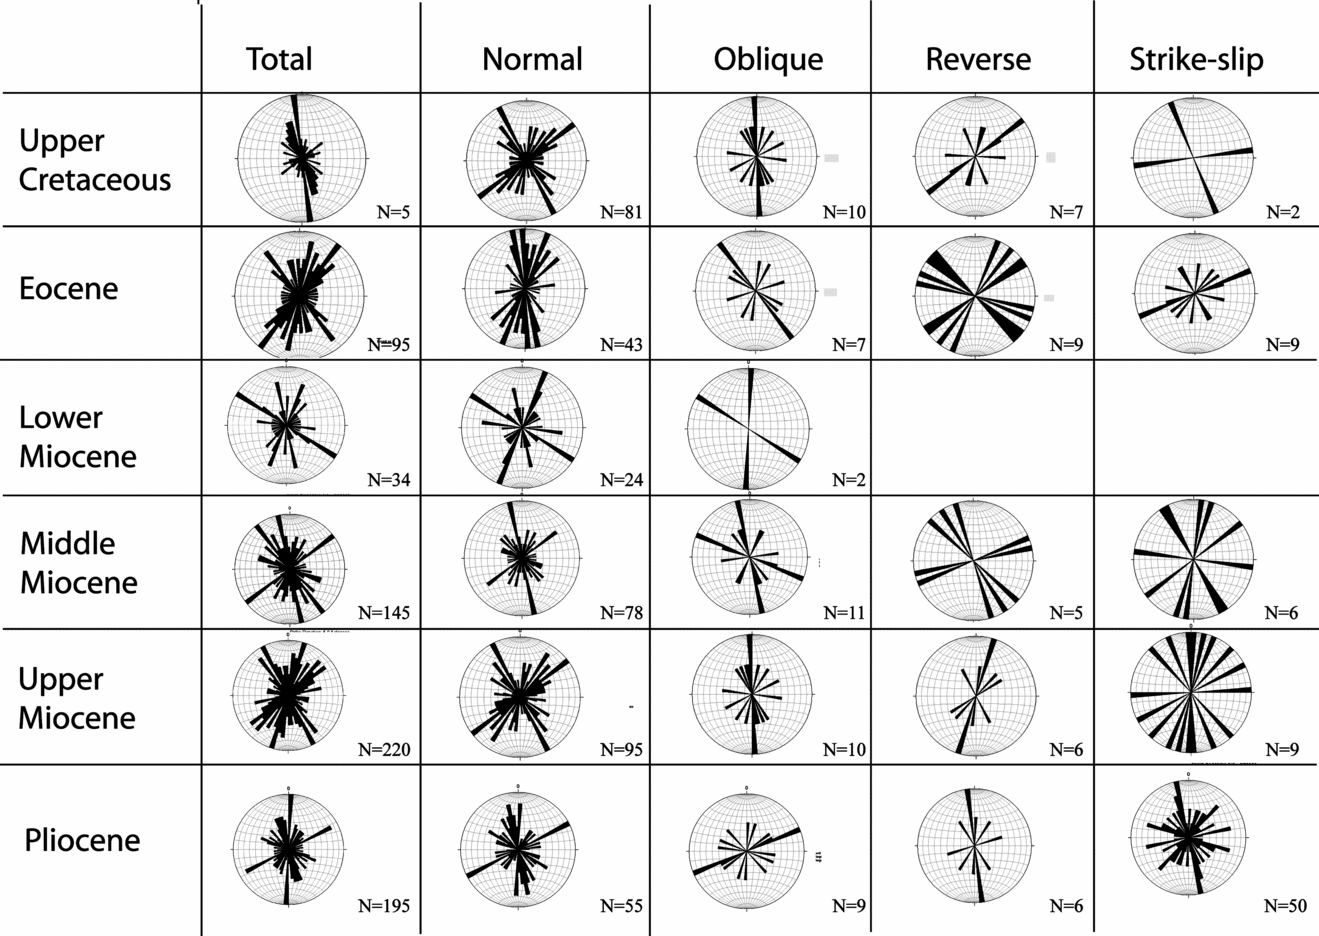
Chart showing breakdown of fault strike data into different types of fault for each spatial zone defined; see Figure 3. Note that the total number of faults is greater than the numbers of specific faults due to the motion on the fault plane not always being identifiable.

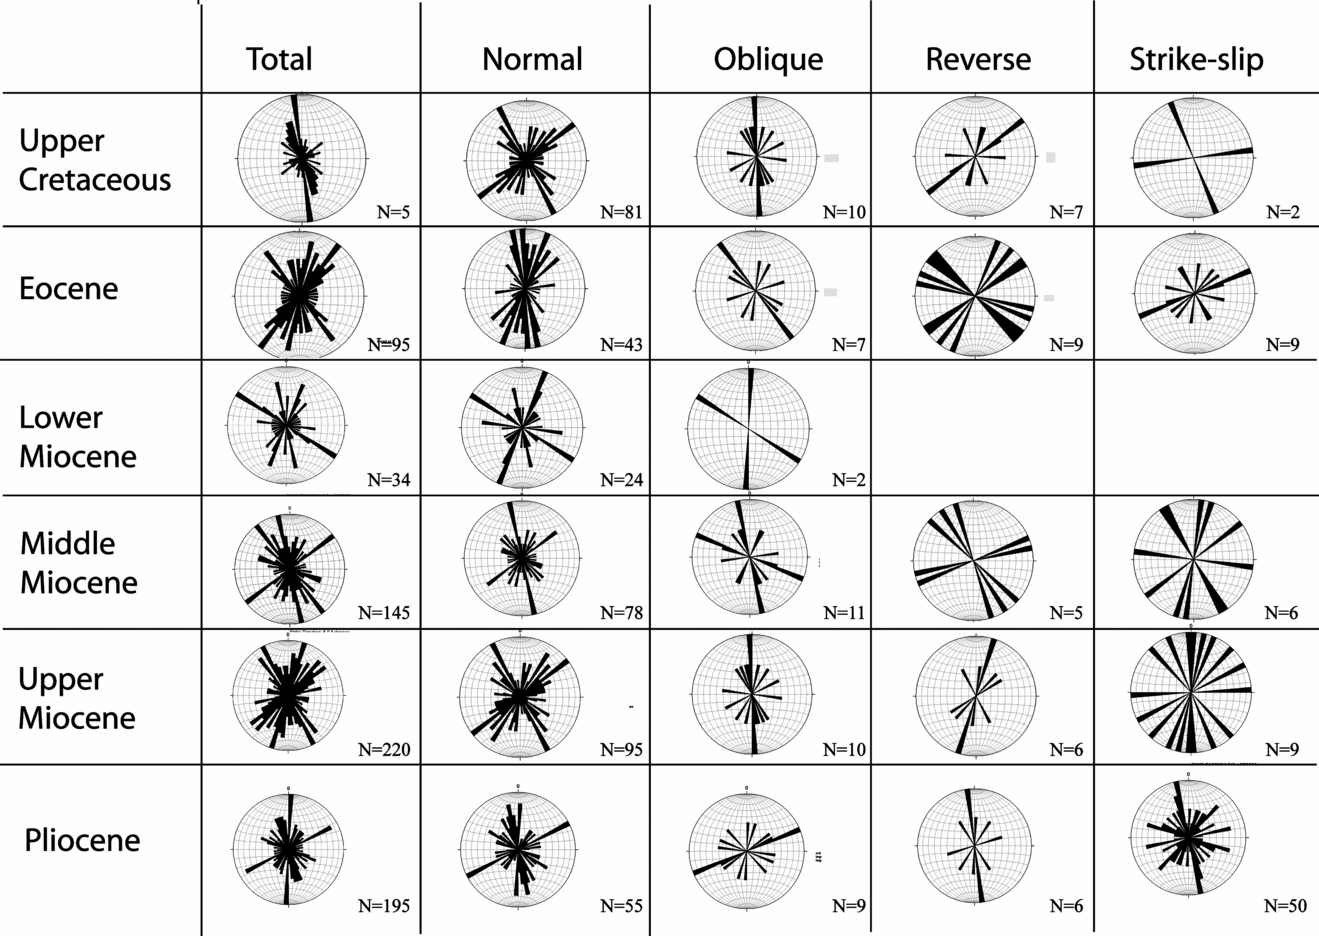
Second, the faults were considered according to the inferred age of the faulting (Fig. 11). For example, a fault measured in a Middle Miocene unit is necessarily Middle Miocene or younger and is placed in a ‘Middle Miocene or younger’ age category; a fault cutting the Middle-Late Miocene boundary is Late Miocene or younger and is placed in the ‘Late Miocene or younger’ category, etc.
Chart showing breakdown of fault strike data into different types of fault, depending on the age of the sedimentary rock in which the fault was measured. Note that the total number of faults is greater than the numbers of specific faults due to the motion on the fault plane not always being identifiable.
6.b. Spatial distribution of faults
Zone 1 is dominated by normal faults striking 030–070°, 160–180° and 090–140°. However, a few faults are of oblique-dip or strike-slip type (both sinistral and dextral) with strikes of 050–070° and 150–160°. By contrast, zones 2 and 3, covering the axial zone of the graben, exhibit numerous normal and strike-slip faults, plus a few oblique and rare reverse faults. In both of these areas, the strikes of normal faults exhibit two main trends (040–060° and 150–190°) with a subordinate trend striking 110–130° (Fig. 10). Similarly, strike-slip faults also exhibit a range of strikes (140–200° in zone 2; 100–120° in zone 3). Zone 4 covers an uplifted block encompassing the mountainous Samandağ and is bounded to the south and southeast by the River Asi. The faults of this zone are again dominantly normal and strike-slip, but oblique-slip faults are also present. The general trends of faults are similar to elsewhere; however, the dominant orientation of fault strike is different, as NW–SE faults are more common. Normal faults mostly strike 090–130°, although there are N–S- and NE–SW-striking faults as well. By contrast, oblique-slip and strike-slip faults exhibit two dominant trends: 050–070°, 100–120° and 020–080°, 140–170°, respectively. Zones 5 and 6 cover the SE margin of the graben. The majority of faults of zone 5 are normal faults, generally striking 140–180°. Oblique-slip, strike-slip (both mainly striking 150–180°) and reverse faults (striking 050–080°) are also present. Zone 6 again shows a spread in the orientation of faults; normal faults predominantly strike 0–020° and 040–060°, with a sub-set striking 120–140°. Oblique faults, the next most common type, show a dispersed fault pattern. Small numbers of reverse faults and strike-slip faults (sinistral and dextral) are also present (Fig. 10).
In summary, normal faults predominate, commonly with trends of 030–070°, 090–140° and 150–190°. Oblique-slip and reverse faults are uncommon, as are strike-slip faults in zones 1, 5 and 6. However, strike-slip faults, generally trending 020–080° or 100–170°, are numerous in zones 2, 3 and 4, representing the floor of the graben.
6.c. Temporal distribution of faulting
Further analysis depends on assessing the maximum age of faulting. To determine the age of any particular fault or set of faults it is necessary to define an unconformably overlying unit that is not affected by this faulting. This is the case for the Upper Cretaceous/Eocene sediments in the area, which were deposited and deformed prior to the formation of the Hatay Graben. These sediments were folded and faulted and then covered by much less deformed Miocene sediments. In addition, intraformational syn-sedimentary faulting has been documented from Middle Miocene limestone related to the inferred early foreland basin phase, again prior to formation of the neotectonic graben (Boulton, Robertson & Ünlügenç, Reference Boulton, Robertson, Ünlügenç, Robertson and Mountrakis2006).
No such clear stratigraphic relationships are seen within the Miocene–Recent sediments of the Hatay Graben. However, it is useful to determine the abundances, trends and fault types in sediments of progressively younger age. Any fault types not seen in a younger unit in the same area could indicate that this faulting had ended before deposition of this particular sedimentary unit. Using this approach, the fault populations were separated into those in Upper Cretaceous, Eocene, Lower Miocene, Middle Miocene and Upper Miocene and Pliocene sediments, respectively (Fig. 11). Very few faults were identified in Quaternary deposits and no slickenlines were identified, presumably because of the coarse, unconsolidated nature of the sediments. Occasional measurements of Quaternary faults are combined with Pliocene faults.
Faults cutting Pliocene–Quaternary sediments exhibit three clear trends. The dominant fault orientations are NE–SW (040–065°) and N–S (0–010°) with a subordinate 120–140° trend (Fig. 11). Normal and strike-slip faults predominate with similar trends. There are also a few oblique and reverse faults. Faults considered to be Late Miocene or younger (that is, observed in Upper Miocene sediments) show similar trends in fault strike to the Pliocene dataset. However, Middle Miocene sediments contain far fewer identified strike-slip faults than those of Pliocene age. This is also true for the Middle–Early Miocene sediments, where there are three main trends of faulting (NW–SE, N–S, NE–SW), dominated by normal faults (Fig. 11).
Faults measured within Eocene and latest Cretaceous lithologies differ noticeably. All of the faults measured in the Eocene rocks have similar orientations to those observed within younger sedimentary rocks. However, when fault types are considered, it is seen that normal faults dominate in the Eocene rocks but have only one main trend in strike (340–040°), in contrast to two or three different trends in younger units. The Upper Cretaceous dataset is different again. When all of the fault data from Upper Cretaceous rocks are considered, a dominant trend emerges: 330–000° (Fig. 11). This pattern results from a combination of oblique-slip faults trending N–S and normal faults with two dominant strike directions (030–070° and 120–150°).
In summary, analysis of the fault data indicates that faulting in the pre-Miocene rocks (Upper Cretaceous & Eocene) is dissimilar to the younger rocks. This is to be expected, as the older rocks experienced a prior period of deformation as mentioned above. In addition, the margins of the graben, mainly composed of Middle Miocene and older rocks, are dominated by normal faults in three main trends (NE–SW, NW–SE and N–S). By contrast, the graben floor that is composed of Upper Miocene and younger sediments also exhibits numerous normal faults, but strike-slip faults are more common than observed elsewhere.
7. Stress inversion
Various methods have been proposed to analyse polyphase fault data for situations where there are clearly different datasets (e.g. Nemcok & Lisle, Reference Nemcok and Lisle1995; Liesa & Lisle, Reference Liesa and Lisle2004; Shan, Li & Lin, Reference Shan, Li and Lin2004). However, cross-cutting relationships in the field area do not demonstrate any temporal progression of faulting, as noted above. For this reason the most appropriate stress inversion is that based on the methods of Bott (Reference Bott1959) and Angelier (Reference Angelier1984). The main limitation of this method is that the sense of motion must be known for all of the slip data used. As a result, only a subset of the data from the Hatay Graben can be used; also the friction on the fault must be taken as zero. The method does not give a unique solution for the orientations of the principle stress axes, and the results will not be meaningful if rotations about vertical or inclined axes have taken place, as is likely in an area affected by strike-slip faulting. As noted above, local variations in dip are suggestive of tectonic rotation, but may not have affected the entire graben, especially for models which involve transtension rather than pure strike-slip (or transpression).
With these limitations in mind, the stress analysis was undertaken on the fault data in an attempt to indicate the orientation of the principle stress axes in the area, and also to allow comparisons with previous interpretations (Över, Ünlügenç & Bellier, Reference Över, Ünlügenç and Bellier2002). Slickenlines, groove marks and mineral fibre growths were measured as kinematic indicators. No kinematic information was available for the large basin-bounding faults, owing to a lack of exposure and weathering of fault planes; thus all of the data come from second- and third-order faults.
The structural measurements were initially analysed in subsets, using the same groups as before (geographic area and age of sedimentary unit). The results were largely inconclusive, possibly because of the large area and long time span represented by each group of faults. However, the results are generally consistent with an extensional to oblique-extensional stress regime. To increase precision, the data were then analysed for individual outcrop locations where the fault planes were measured. This allowed the stress to be calculated for 11 point locations where suitable data exist.
These data were mostly from Pliocene sediments but some were from older lithologies (Table 3). In the northern part of the field area, σ3 was found to be orientated at a relatively high angle to the basin margins (Fig. 12), parallel to the inferred direction of maximum extension as indicated by the orientation of the graben. Further south, near Samandağ, σ3 orientations are more variable and generally NE–SW, suggesting that the stress field in this area was variable over short distances, or that faults have been rotated after formation resulting in misaligned principal stress axes.
Stress analysis results

Results of stress tensor inversions for slip data for eleven locations. The stress ratio R = (σ2−σ3)/(σ1−σ3) and RMS (the root mean square) = {(Σ r2 k)/2k}1/2 where r k is the residual of the kth fault and R is the residual vector with terms from r1 to r2 k. Az – azimuth; Pl – plunge.

In other areas, strain is known to be compartmentalized between different lithologies (e.g. De Paola, Holdsworth & McCaffery, Reference De Paola, Holdsworth and McCaffery2005); this could also be true in the Hatay Graben. The graben margins (zones 1 and 2) are mainly limestone and serpentinite, whereas the axial parts of the graben (zones 2–4) are dominated by sandstone, marl and conglomerate. Therefore, any interpretation of the structural significance of the fault data must take account of the lithologies exposed within the graben, as faults could exploit one lithology rather than another (e.g. differential sediment competency). To investigate any possible effects that different lithologies could have on the stress inversion results (and fault orientation), the fault data were then plotted according to the lithology in which they were recorded (limestone, marl or sandstone). All lithologies show similar orientations of stress axes (Fig. 13); these are also the same as the orientations calculated for the total number of faults in the field area. Therefore, there is no evidence that faulting was influenced by the differing lithologies exposed on the flanks and floor of the graben. Consequently, the observed differences in fault character between individual zones and within sediments of different ages must have some other explanation, as discussed below.
Three stereonets showing stress analysis on faults measured in limestone, marl and sandstone, to assess whether strain partitioning by lithology has occurred.

8. Testing alternative tectonic hypotheses
Tectonic hypotheses for the Hatay Graben can be summarized as follows.
8a. The Hatay Graben represents a releasing bend on a regional sinistral strike-slip fault (Fig. 2)
In one scenario (Yürür & Chorowicz, Reference Yürür and Chorowicz1998), the Karasu Rift should be a pull-apart basin on the East Anatolian Fault, with the Hatay Graben as the surface expression of the Anatolian/African plate boundary. In this case, the Hatay Graben would be a NE–SW sinistral strike-slip fault with NNE–SSW normal faults and sinistral strike-slip faults, N–S and NW–SE dextral strike-slip faults and E–W reverse faults.
In reality, we observe NE–SW-trending normal faults forming a NE–SW-orientated half-graben. Sinistral strike-slip faults show no preferred orientation (that is, all points of the compass are represented); dextral faults are generally orientated NE–SW or NW–SE and rare reverse faults are N–S-trending, which in effect excludes this hypothesis.
In other, similar, scenarios, motion along a N–S-trending strike-slip fault should result in the development of a NW–SE-orientated pull-apart graben (Muehlberger, Reference Muehlberger1981; Perinçek & Çemen, Reference Perinçek and Çemen1990; Lyberis et al. Reference Lyberis, Yürür, Chorowitcz, Kasapoğlu and Gündoğdu1992; Rojay, Heimann & Toprak, Reference Rojay, Heimann and Toprak2001). In this case, normal/oblique-normal faults should trend parallel to the graben/half-graben margins (NW–SE). Three sets of strike-slip faults should develop with sinistral faults orientated NW–SE, and dextral faults orientated E–W and NE–SW; reverse faults should also develop which should be NE–SW-trending. However, the Hatay Graben is NE–SW-trending and faults are not consistent with these predictions, again excluding this model as a viable hypothesis.
Rojay, Heimann & Toprak (Reference Rojay, Heimann and Toprak2001) recognized four main sets of faults with NE–SW-strikes dipping to the NW or SE in the Hatay Graben, and with kinematic indicators suggesting an oblique-normal-slip motion with a left-lateral component. These data are consistent with our observations for the Hatay Graben using a much larger dataset. However, two lines of evidence oppose the interpretation of Rojay, Heimann & Toprak (Reference Rojay, Heimann and Toprak2001), and other authors (Muehlberger, Reference Muehlberger1981; Perinçek & Çemen, Reference Perinçek and Çemen1990; Lyberis et al. Reference Lyberis, Yürür, Chorowitcz, Kasapoğlu and Gündoğdu1992; Yürür & Chorowicz, Reference Yürür and Chorowicz1998), that the Hatay Graben formed as a pull-apart basin on a releasing bend of a strike-slip fault system represented by the Karasu Rift/Dead Sea Fault Zone. First, the orientation and geometry of the present graben are not consistent with this model. A pull-apart basin along the sinistral Dead Sea Fault Zone in this area (fig. 2a) should be orientated NW–SE, whereas the Hatay Graben is NE–SW-trending (Fig. 1), and therefore should be an area of transpression if controlled by motion on the Dead Sea Fault Zone. Second, the Miocene initiation of normal faulting in the area took place before the Dead Sea Fault Zone intersected this region during the Pliocene or later (Ben-Avraham, Reference Ben-Avraham1978), and thus the formation of the Hatay Graben cannot be directly related to the initiation of the Dead Sea Fault Zone.
In addition, if a dextral lineament associated with the Cyprus arc (the Larnaca Ridge) extends through the Hatay Graben (fig. 2c) as suggested by Kempler & Garfunkel (Reference Kempler and Garfunkel1994), Ben-Avraham et al. (Reference Ben-Avraham, Tibor, Liminov, Leybov, Ivanov, Tokarev and Woodside1995) and Yürür & Chorowicz (Reference Yürür and Chorowicz1998), it should result in E–W-trending normal faults, NE–SW-trending sinistral strike-slip faults, NW–SE and N–S dextral strike-slip faults, and N–S reverse faults. Again, these predicted fault orientations are not compatible with our observations of fault patterns and stress analysis.
8b. The Hatay Graben changed from strike-slip to extension with time
In this interpretation the field evidence would be expected to document early strike-slip faults cut by a later generation of extensional faults. Strike-slip faults should be present in large numbers on the flanks of the Hatay Graben but should be uncommon within the graben, which should be dominated by graben-parallel normal faults. This is not consistent with the patterns of faulting observed, but is consistent with the seismicity data that point to a present-day extensional setting (see Section 4).
Över, Ünlügenç & Bellier (Reference Över, Ünlügenç and Bellier2002) reconstructed the Plio-Quaternary to Recent stress regime of the Hatay Graben using fault measurements (<300) and earthquake focal plane solutions. They inferred a strike-slip stress regime (σ3 to NE) and two extensional stress regimes (σ3 to the NE and E). They also reported two lineations, high angle and low angle, on individual fault planes, and considered normal striations to be younger, based upon superposition. These authors concluded that the present-day stress state is dominantly extensional with a small strike-slip component. They further inferred a change from an older, strike-slip to a younger, normal fault regime.
A model of strike-slip followed by extension is not supported by the data obtained during this work. First, the majority of our strike-slip faults were measured in rocks of Pliocene or younger age, whereas many of Över, Ünlügenç & Bellier's (Reference Över, Ünlügenç and Bellier2002) fault measurements were in Eocene or unspecified (Miocene?) units. Only five of their locations are in the Pliocene–Quaternary graben fill, two of which were considered together. Our data instead indicate that normal faulting was followed by a greater incidence of strike-slip faults. We were also unable to confirm any systematic cross-cutting of faults or slickenlines of fault planes.
Över, Ünlügenç & Bellier's (Reference Över, Ünlügenç and Bellier2002) conclusion of recent normal faulting is, however, consistent with focal plane mechanisms determined from recent earthquakes (see Section 4). These earthquakes are shallow and only two have had strain ellipses calculated for them and so may not be representative of the area as a whole. For example, the Marmara Sea segment of the North Anatolian Fault Zone exhibits transtension partitioned between seismic and aseismic slip in different areas (Aksu et al. Reference Aksu, Calon, Hiscott and Yaşar2000), which may also be applicable to the Hatay Graben. Given that we record numerous strike-slip faults within Pliocene sediments, the absence of calculated strike-slip focal mechanisms is surprising. Possibly, the earthquake record is simply too sparse or ill-constrained to detect evidence of strike-slip. Alternatively, the stress regime may have changed to more extensional after the Pliocene, which is quite possible as we have very little fault data for the unconsolidated Pleistocene sediments.
Över et al. (Reference Över, Kavak, Bellier and Özden2004) identified a large strike-slip lineament in the Amanos Mountains based on the location and apparent trend of recent earthquakes. However, the earthquake epicentres may well be mislocated, as noted in Section 4, by as much as 10–15 km; if so, the strike-slip lineament could instead be located near or within the Hatay Graben. Över et al. (Reference Över, Kavak, Bellier and Özden2004) further identified a possible strike-slip lineament within the Amanos Mountains using SPOT images. However, this lineament appears to run along the crest of the mountain range about 15 km north of the Hatay Graben, and is likely to mark a watershed rather than a tectonic lineament.
8c. The Hatay Graben is an oblique extensional (transtensional) structure
In this model it is predicted (assuming α is ~ 30°) that three populations of dip-slip, oblique-slip and strike-slip faults should be present. One population should form sub-parallel to the graben (approximately NE–SW) coevally with two sets of faults orientated at a high angle to the rift and displacement direction (fig. 14a). Our structural data are mainly consistent with this transtension, which is therefore explored in the next section.
(a) Diagram showing the types and orientations of structures expected to develop in a sinistral transtensional zone with the orientation of the Hatay Graben. Note the similarities with the fault orientations actually observed, that is, three orientations of normal faults, conjugate strike-slip faults and E–W-trending thrusts and fold-axes. (b) Sketch showing the development of a two-stage graben where a strike-slip zone cuts through an existing graben. (c) Sketch showing partitioned transtension with a central wrench-dominated domain with adjacent extension-dominated domains (modified from De Paola et al. Reference De Paola, Holdsworth, McCaffery and Barchi2005). (d) Sketch showing the geodynamic/neotectonic setting of the Hatay Graben (HG) within the Eastern Mediterranean. Note the directions of GPS vectors acting to create net extension in the Hatay region. NAFZ – North Anatolian Fault Zone; other abbreviations as in Figure 1.

9. Transtensional basins
Oblique-extensional/transtensional basins are those that exhibit an intermediate state of extension between pure extension and strike-slip, owing to the rift orientation being oblique to the direction of extension. Transtension represents a range between two end-members: pure extension and strike-slip (where the trend of the basin is oblique to the extension direction). In strike-slip settings, two dominant directions of faults develop ~45° apart, and normal, reverse and strike-slip faults develop within the fault zone. This contrasts with areas of pure extension where the majority of the faults are normal and strike-parallel or sub-parallel to the graben, with only small numbers of strike-slip faults that accommodate changes in the amount of extension along strike. Intermediate conditions between these two end-members involve transtensional or oblique–extensional regimes (that is, where the angle between the rift trend and the direction of displacement (α) on the plate edge is between 1° and 89°). Analogue experiments show that there is a change in the style of faulting between α of 45° and 30° (Clifton et al. Reference Clifton, Schlische, Withjack and Ackermann2000; Withjack & Jamieson, Reference Withjack and Jamieson1986). When α ≥ 45°, all of the faults are of dip-slip type. Faults near a graben margin will strike slightly obliquely to the main trend, whereas near the axis of the graben, faults strike near to the displacement-normal direction. However, when α ≤ 30°, three populations of dip-slip, oblique-slip and strike-slip faults can develop. One population of faults forms sub-parallel to the graben trend, and two have trends orientated at a high angle to the rift and displacement direction. However, when α = 15°, the majority of the faults are strike-slip in nature.
Recent work on transtensional settings includes field (Umhoefer & Stone, Reference Umhoefer and Stone1996; ten Veen & Kleinspehn, Reference ten Veen and Kleinspehn2002; De Paola et al. Reference De Paola, Holdsworth, McCaffery and Barchi2005; De Paola, Holdsworth & McCaffery, Reference De Paola, Holdsworth and McCaffery2005), experimental (Withjack & Jamieson, Reference Withjack and Jamieson1986; McClay & White, Reference McClay and White1995; Tron & Brun, Reference Tron and Brun1991; Clifton et al. Reference Clifton, Schlische, Withjack and Ackermann2000) and theoretical studies (Fossen & Tikoff, Reference Fossen and Tikoff1993; Dewey, Reference Dewey2002; Ramani & Tikoff, Reference Ramani and Tikoff2002; Waldron, Reference Waldron2005). A few studies have also considered the role of pre-existing faults or fault reactivation in transtensional settings (Krantz, Reference Krantz1991; Keep & McClay, Reference Keep and McClay1997; Dubois et al. Reference Dubois, Odonne, Massonnat, Lebourg and Fabre2002), for example, the Northumberland Basin (De Paola et al. Reference De Paola, Holdsworth, McCaffery and Barchi2005; De Paola, Holdsworth & McCaffery, Reference De Paola, Holdsworth and McCaffery2005), the North Sea graben (Bartholomew, Peters & Powell, Reference Bartholomew, Peters, Powell and Parker1993; Oudmayer & Dejager, Reference Oudmayer, Dejager and Parker1993) or the East African Rift (Theunissen et al. Reference Theunissen, Klerk, Melnikov and Mruma1996).
10. A transtensional setting for the Hatay Graben
The styles of faulting observed within the Hatay Graben are similar to those in oblique-extensional (transtensional) settings, in which normal, reverse and strike-slip faults all develop coevally within the fault zone (Withjack & Jamieson, Reference Withjack and Jamieson1986; Dewey, Reference Dewey2002; fig. 14a). However, there are some differences in fault patterns from ideal oblique-extensional settings, which require explanation.
First, some fault patterns are locally inconsistent with ideal oblique extension, as seen in zones 4 and 6, where significant numbers of E–W-striking faults are present. Some of these E–W faults parallel the inferred second-order (10 m to 1 km in length) E–W-trending fault observed along the Harbiye Gorge (zone 6). These transverse faults could reflect basement structural control (see below). In addition, variable fault orientations (that is, WNW–ESE-trending normal faults, WNW–ESE- and ENE–WSW-trending oblique-slip faults and NE–SW- and NW–SE-trending strike-slip faults) are seen in the vicinity of an uplifted fault block (zone 4). These fault trends may reflect the influence of block rotations within the graben axis (see Section 5.f), possibly about a vertical axis, but could also reflect rotation in normal fault blocks adjacent to graben-bounding faults. Alternatively, these anomalous fault trends could reflect reactivated basement faults, since E–W-trending faults are common within the underlying Cretaceous Hatay Ophiolite (J. Inwood, unpub. Ph.D. thesis, Univ. Plymouth, 2005; Morris et al. Reference Morris, Anderson, Inwood, Robertson, Robertson and Mountrakis2006).
Second, there are more strike-slip faults within the axial zone of the graben than other fault types. By contrast, the graben margins are dominated by first-order dip-slip faults. The sediments on the graben margins are mainly Miocene and older, whereas the sediments within the axial zones are mainly Plio-Quaternary. The probable explanation is that strike-slip faulting became more important in the deformation of the graben after Late Miocene times. The inferred ages of the faulting observed in the Hatay Graben (see above) support the inference that strike-slip faults developed after the Miocene. Pliocene sediments in the axis of the graben contain the highest number of small, third-order strike-slip faults (Figs 10, 11). Larger-scale strike-slip faults could also be present within the Pliocene–Recent sediments of the graben axis, but are difficult to recognize owing to the lack of lithification and limited exposure. The paucity of strike-slip faults in Miocene and older sediments also suggests that Plio-Quaternary strike-slip was concentrated near the graben axis and did not generally affect the margins of the graben.
Third, local variations in the dip (Fig. 8) of the Pliocene sediments near the graben margin could have resulted from block rotations about steeply inclined axes within a strike-slip zone. Existing palaeomagnetic work in sediments of the Hatay Graben (Kissel et al. Reference Kissel, Laj, Poisson and Görür2003; J. Inwood, unpub. Ph.D. thesis, Univ. Plymouth, 2005) did not include sampling of the area of proposed rotations. However, further north, within the Karasu Rift (Tatar et al. Reference Tatar, Piper, Gürsoy, Heimann and Koçbulut2004; Fig. 1), palaeomagnetic analysis has revealed clockwise block rotations of Quaternary basalts related to discrete sinistral strike-slip motion on rift border faults; the deforming zone is about 15 km wide with rigid crustal blocks of a similar length. It is inferred that block rotations could have resulted either from shear between faults, or record part of a strike-slip-controlled flower structure.
In summary, the fault patterns as a whole are more consistent with oblique extension than with pure extension or pure strike-slip. However, there are some apparent anomalies that could be partially explained by basement structural control.
10a. Extension followed by strike-slip?
Normal faults dominate the Miocene sediments on the flanks of the graben, whereas strike-slip faults are numerous in the axial Pliocene sediments. Possibly extension dominated during the Miocene (on graben-bounding faults), followed by strike-slip faulting in a second phase during the Plio-Quaternary (fig. 14b). However, this seems unlikely for several reasons. If the graben had switched from extensional to strike-slip with time, we would expect to find only normal faults in Miocene and older rocks orientated parallel to the graben (NE–SW), plus possibly a conjugate fault set at 60°. The fault pattern associated with Pliocene–Quaternary strike-slip faulting would depend on whether the fault zone was dextral or sinistral; both have been suggested (Muehlberger, Reference Muehlberger1981; Perinçek & Çemen, Reference Perinçek and Çemen1990; Lyberis et al. Reference Lyberis, Yürür, Chorowitcz, Kasapoğlu and Gündoğdu1992; Kempler & Garfunkel, Reference Kempler and Garfunkel1994; Ben-Avraham et al. Reference Ben-Avraham, Tibor, Liminov, Leybov, Ivanov, Tokarev and Woodside1995; Yürür & Chorowicz, Reference Yürür and Chorowicz1998). Assuming a sinistral strike-slip regime, we would predict NE–SW and NNE–SSW sinistral faults, E–W and NW–SE dextral faults and N–S normal faults in the axial zone of the graben. This is similar to what is observed, but the transtensional model in which faulting became more oblique over time fits the fault data better for the following reason.
Where the acute angle between the rift trend and direction of extension (α) is ≥45°, all faults are expected to be of dip-slip striking parallel and obliquely to the graben trend. This conforms to the fault patterns observed in pre-Pliocene sediments. However, where α ≤ 30°, dip-slip, oblique slip and strike-slip faults all develop as three discrete fault populations with one population parallel and two populations at a high-angle to the rift trend. This corresponds closely to our observations made in the Pliocene sediments. In addition, the stress analysis for the Miocene sediments shows σ3 (approximate direction of extension) as ~45° to the rift orientation, whereas σ3 from the Plio-Quaternary sediments is variable. This could reflect faulting sub-parallel to the rift, as commonly observed, coupled with faulting at a high angle to the graben with (unconstrained) block rotations.
10b. Partioned transtension?
Another option that we favour is that the two apparently different ages and locations of faulting associated with the graben relate to strain-partitioning or ‘partitioned transtension’ (De Paola et al. Reference De Paola, Holdsworth, McCaffery and Barchi2005). This allowed two styles of faulting to co-exist in different areas: extensional faulting on the rift margins (extension-dominated transtension) and strike-slip faulting (wrench-dominated transtension) near the graben axis (fig. 14c). This interpretation explains many observations, including the overall fault orientations, the presence of dip-slip faults, possible block-rotations near the graben axis, the presence of a significant topographic graben, and the deformation of Pliocene sediments by graben-bounding faults. Similar interpretations have recently been proposed for part of the North Anatolian Fault Zone (Aksu et al. Reference Aksu, Calon, Hiscott and Yaşar2000), the North Aegean Trough (McNeill et al. Reference McNeill, Mille, Minshull, Bull, Kenyon and Ivanov2004) and the Northumberland Basin, northern England (De Paola et al. Reference De Paola, Holdsworth, McCaffery and Barchi2005).
Partitioned transtension can occur where pre-existing crustal anisotropies, such as faults or shear zones, are present, controlling the location and orientation of the different structural domains. As noted above, localized E–W faults parallel large faults in the underlying kilometres-thick Hatay Ophiolite. In addition, the northern margin of the Arabian plate is known to be strongly affected by extensional faults that relate to Triassic rifting of the Tethyan Ocean to the north (Brew et al. Reference Brew, Lupa, Barazangi, Sawaf, Al-Imam and Zaza2001). Pre-Cretaceous rocks are not exposed in the study area, but it is likely that a zone of pre-existing structural weakness exists beneath the Hatay Graben that was exploited by strike-slip during Plio-Quaternary times.
Finally, it is possible the two alternatives may be mutually exclusive, that is, a trend towards more oblique transtension over time could have been accompanied by strain partitioning and basement reactivation. This is also consistent with previous interpretations of the Hatay Graben as a part of a diffuse plate boundary between the African and Anatolian plates (Kempler & Garfunkel, Reference Kempler and Garfunkel1994; Robertson, Reference Robertson, Robertson, Emeis, Richter and Camerlenghi1998; Vidal, Alvarez-Marron & Klaeschen, Reference Vidal, Avarez-Marron and Klaeschen2000). We infer that westward extrusion of Anatolia from a post-collisional area of Arabia to the east to a pre-/syn-collisional area in the Eastern Mediterranean to the west is expressed as oblique–extensional strain at the interface between these two areas, including the Hatay Graben (fig. 14d).
11. Conclusions
The Hatay Graben is interpreted as the result of oblique–extension (transtension) within a zone of left-lateral tectonic escape following continental collision to the east. Field data suggest that transtension was partitioned, with mainly normal faulting on the graben margins and strike-slip in the graben axis. Normal faulting dominated during the Early–Middle Miocene, followed by increased amounts of strike-slip faulting during the Pliocene. The focus of strike-slip near the axis of the graben is likely to reflect some combination of pre-existing basement weakness, partitioned strain or increased incidence of strike-slip faulting over time. Minor E–W transverse faults that parallel fault trends in the underlying Cretaceous ophiolite are likely to reflect ‘basement control’. Deformation continues to the present day with the Hatay Graben representing part of a distributed (diffuse) plate boundary between African and Eurasia. This study highlights the importance of detailed structural studies of relatively small areas to help understand collision-related settings.
Acknowledgements
SJB acknowledges receipt of a NERC Ph.D. Studentship (NER/S/A/2002/10361) and additional funding by the American Association of Petroleum Geologists for financial support while at the University of Edinburgh and a Royal Society Grant at University of Plymouth. AHFR thanks the Carnegie Trust for financial assistance with fieldwork. We thank Prof. Dr Ulvi Can Unlugenç (Turkey) for logistical and scientific assistance with this work. We also thank Mr Tolga Mistik and Mr Niazi Temizkan for access to their unpublished M.Sc. theses on Hatay Region. Finally, we are grateful for constructive comments from the reviewers, Jonathan Imber and Johan ten Veen, and also those from the editor, Mark Allen. Supplementary material may be found online at http://multimediafluids.uam.elogim.com/journals/geo.