Introduction
Sentinel-1B was launched on April 25, 2016, carries a C-band synthetic aperture radar (SAR) sensor and is a part of the European Union's Copernicus program on Earth observation. This European radar imaging satellite is the second of the two satellites in the Sentinel-1 constellation; the first is Sentinel-1A, which was launched in 2014 [Reference Schmidt, Tous Ramon and Schwerdt1]. Sentinel-1 SAR sensors can capture multi-frequency, multi-polarized data with different acquisition modes such as the StripMap (SM) mode, Interferometric Wide swath (IW) mode, Extra Wide swath (EW) mode, and Wave (WV) mode. Well-calibrated SAR data are required to compare with SAR data from different sensors and extract the geophysical parameters. Sentinel-1B instrument calibration stability was confirmed during the commissioning phase after extensive ground measurements and calibration campaigns [Reference Miranda, Meadows, Pilgrim, Piantanida, Recchia, Giudici, Small and Schubert2, Reference Schwerdt, Schmidt, Tous Ramon, Alfonzo, Doring, Zink and Prats3]. The German Aerospace Centre (DLR) also performed an independent system calibration in 2016 and confirmed the good performance of the system [Reference Schwerdt, Schmidt, Tous Ramon, Klenk, Yague-Martinez, Prats-Iraola, Zink and Geudtner4]. However, with time, due to various causes, the sensor tends to degrade. Hence, it is essential to monitor the changes in calibration parameters due to degradation over time. Sentinel-1B data are freely available and currently used worldwide for different applications, such as soil moisture [Reference Das Narendra, Entekhabi, Dunbar, Chaubell, Colliander, Yueh, Jagdhuber, Chen, Crow, O'Neill and Walker5], forest height, and aboveground biomass [Reference Liu, Gong, Xing, Hu and Gong6]. Hence, radiometric calibration stability monitoring of Sentinel-1B data is required to ensure the reliability of the data. Several studies have been performed to determine the radiometric accuracy and long-term stability of Sentinel-1 SAR systems [Reference Miranda, Meadows, Piantanida, Recchia, Small, Schubert, Vincent, Geudtner, Navas-Traver and Vega7, Reference Schmidt, Tous Ramon and Schwerdt8]. In 2020, Schmidt et al. [Reference Schmidt, Schwerdt, Miranda and Reimann9] analyzed the absolute radiometric accuracy and stability for both Sentinel-1A and Sentinel-1B and compared these derived measurements for an observation period of 2017–2019 [Reference Schmidt, Schwerdt, Miranda and Reimann9]. In 2021, Schmidt et al. [Reference Schmidt, Schwerdt and Miranda10] performed an intercomparison of Sentinel-1A and -1B. They found that Sentinel-1B is more sensitive to low-backscatter areas, and no significant radiometric differences are found for point targets and medium-backscatter areas [Reference Schmidt, Schwerdt and Miranda10]. Miranda et al. [Reference Miranda, Meadows, Piantanida, Recchia, Franceschi, Hajduch, Husson, Vincent, Schubert, Small and Mouche11] presented SAR system results focusing on instrument stability, and radiometric and geolocation accuracy [Reference Miranda, Meadows, Piantanida, Recchia, Franceschi, Hajduch, Husson, Vincent, Schubert, Small and Mouche11]. However, to the best of the authors' knowledge, until the submission of the manuscript, no independent quality assessment of the essential quality parameters in the Sentinel-1B SAR sensor after the commissioning phase has been performed. In this study, to ensure the consistency of the radiometric calibration and data quality parameters of Sentinel-1B data, a temporal assessment was performed using a corner reflector (CR) array deployed at the Surat Basin, Australia. This site is maintained by the Australian Geophysical Observing System (AGOS), which offers reliable means to perform radiometric, geometric, and impulse response measurements to calibrate SAR instruments on spaceborne or airborne platforms for deformation studies [Reference Garthwaite, Nancarrow, Hislop, Thankappan, Dawson and Lawrie12]. Our study monitors the radiometric calibration stability of the Sentinel-1B SAR sensor and assesses the SAR sensor performance of Sentinel-1B by analyzing different data quality parameters. Spatial resolutions in the range and azimuth directions, peak-to-side lobe ratio (PSLR) and integrated side lobe ratio (ISLR) parameters were estimated using the generated impulse response function (IRF) from the CR response in the image. The noise equivalent sigma zero (NESZ) was also measured using low-backscatter targets such as calm water bodies, which is an important metric to capture the effect of noise on the image quality.
Study area and data used
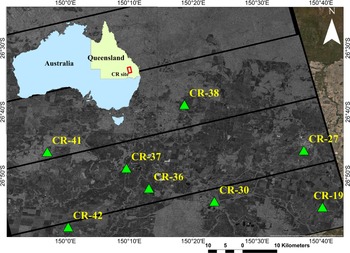
The study area Surat Basin, Australia, is situated between 26°25ʹS, 150°23′E and 27°34ʹS, 150°52ʹE, as shown in Fig. 1. The study area comprises hilly terrain and is surrounded by trees, dense vegetation, and rock outcrops. The CR array is deployed near Gunning, which is approximately 55 km from North Canberra. The CRs were numbered according to the database provided by Geoscience Australia. Among 40 reflector arrays, the location of eight CRs of 1.5 m in size is visible in the Sentinel-1B intensity image, as shown in Fig. 1.
The subset of Sentinel-1B SLC intensity image showing the location of existing CRs at the calibration site of the Surat basin, Queensland, Australia.

Data used
The study uses single look complex (SLC) images acquired by Sentinel-1B in IW mode with an incidence angle range of 29–46°. The SAR images for three different dates (July 25, 2019; August 6, 2019; and August 18, 2019) in HH polarization were downloaded from the Alaska Data Facility (ASF).
Methodology
The flowchart of the steps in the study is shown in Fig. 2. Sentinel-1B SLC data were downloaded and processed using the Gamma software. Based on the point target (CR) response in the intensity image, background-corrected point target energy (ɛp) was estimated using the integral power method as discussed by Gray et al. [Reference Gray, Vachon, Livingstone and Lukowski13] and Sharma et al. [Reference Sharma, Dadhich, Rambhia, Mathur, Prajapati, Patel and Shukla14]. To estimate the background-corrected point target (PT) energy, a 16 × 16 cell grid in the range and azimuth directions was selected centered around the PT. To determine the average clutter intensity, four areas of size 8 × 8 pixels in the range and azimuth directions around the PT are selected to exclude pixels that influence the PT or any other PT responses [Reference Sharma, Dadhich, Rambhia, Mathur, Prajapati, Patel and Shukla14]. Then, the average clutter intensity is calculated and converted into energy using the pixel area. The background-corrected PT energy is estimated by subtracting the clutter energy from the PT energy, which was used to estimate the radar cross-section (RCS) of the target using (1). The theoretical RCS (σ cr) of the CR was compared to the estimated RCS (σ est) derived from the intensity image using (1) and (2) according to [Reference Sharma, Dadhich, Rambhia, Mathur, Prajapati, Patel and Shukla14, Reference Freeman15] as:


where K is the calibration constant, ɛp is the clutter corrected point target energy, σ cr is the theoretical RCS of the CR, θ is the incidence angle of the target, λ is the radar wavelength, and a is the inner leg length of the triangular trihedral CR (1.5 m). The theoretical RCS (σ cr) of a triangular trihedral of 1.5 m CR is 38.40 dB m2 for the C-band [Reference Garthwaite, Nancarrow, Hislop, Thankappan, Dawson and Lawrie12].
Flow chart of the methodology adopted in the study.

CR with a large RCS is required to ensure adequate visibility above the surrounding clutter and be used for SAR calibration [Reference Sharma, Dadhich, Rambhia, Mathur, Prajapati, Patel and Shukla14, Reference Freeman15]. The signal-to-clutter ratio (SCR) is the measure of CR visibility in the SAR image and can be calculated using (3) according to [Reference Garthwaite, Nancarrow, Hislop, Thankappan, Dawson and Lawrie12, Reference Sharma, Dadhich, Rambhia, Mathur, Prajapati, Patel and Shukla14, Reference Freeman15] as:

where σ p is the backscattered energy of a reference point target, σ 0 is the mean backscattered energy of the clutter, and A res is the area of the resolution cell [Reference Sharma, Dadhich, Rambhia, Mathur, Prajapati, Patel and Shukla14, Reference Panozzo16]. For precise calibration results, the SCR should be >20 dB (preferably ~30 dB) to minimize errors in the computation of the calibration factor, but the signal should not be saturated [Reference Garthwaite, Nancarrow, Hislop, Thankappan, Dawson and Lawrie12, Reference Sharma, Dadhich, Rambhia, Mathur, Prajapati, Patel and Shukla14, Reference Freeman15, Reference Curlander and McDonough17]. For reliable results, only those RCS values were considered for analysis, for which the SCR, which was estimated using (3), was >20 dB.
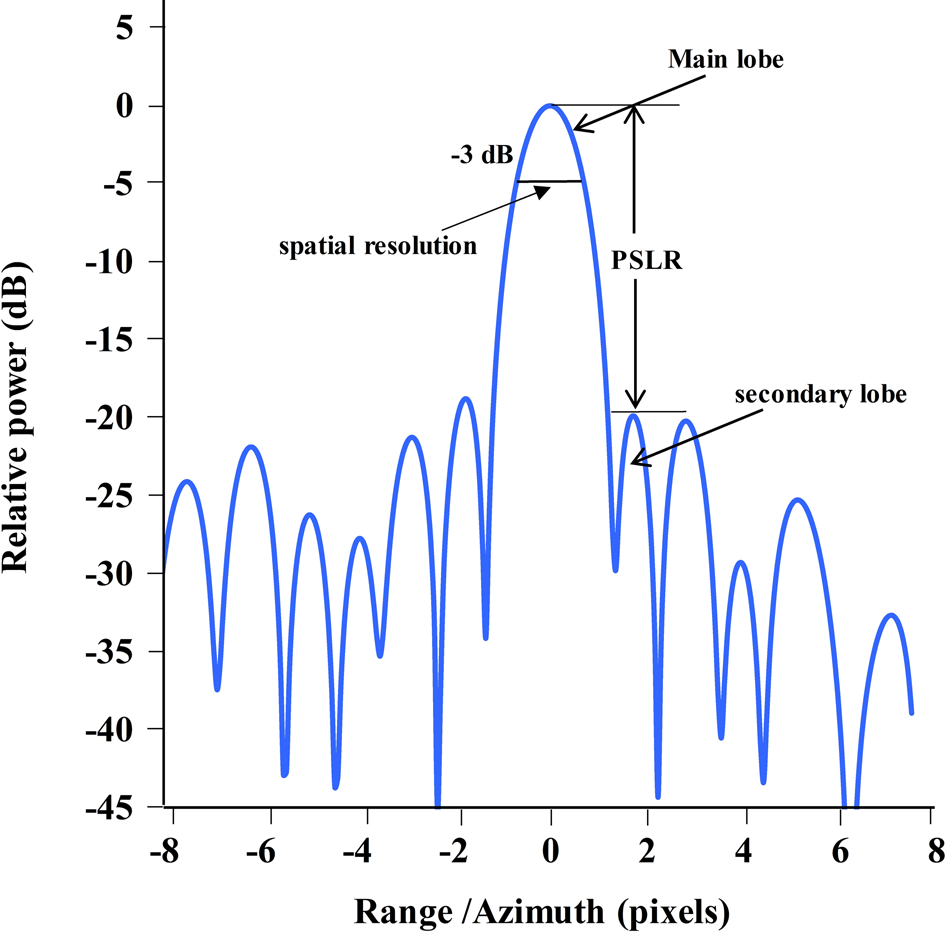
To estimate the image quality parameters, an IRF generated using the response of the CR was used. Figure 3 shows an example of an IRF extracted from the intensity image of a CR. Image quality parameters such as range and azimuth resolution, PSLR, and ISLR were measured from the IRF. It was used to estimate the range (across swath) and azimuth (along swath) resolutions at a −3 dB width of the IRF main lobe, as shown in Fig. 3. Spatial resolution is defined as the distance between the −3 dB width of the main lobe measured in both azimuth and range directions [Reference Freeman15, Reference Dadhich, Sharma, Rambhia, Mathur, Patel and Shukla18]. PSLR is defined as the power ratio between the main lobe and side lobe of the IRF [Reference Freeman15, Reference Dadhich, Sharma, Rambhia, Mathur, Patel and Shukla18, Reference Letsch and Berens19]. ISLR is defined as the ratio of the integrated side-lobe energy to the integrated main-lobe energy that describes the extent of energy spread around the main lobe [Reference Freeman15, Reference Dadhich, Sharma, Rambhia, Mathur, Patel and Shukla18, Reference Oliver and Quegan20]. These image quality parameters are sufficient to quantify the response and compare with specifications to determine the image quality.
Example of an impulse response function of a point target in the range and azimuth directions [Reference Dadhich, Sharma, Rambhia, Mathur, Patel and Shukla18].

NESZ is also an essential image quality parameter and a measure of the SAR sensitivity. The effect of system noise on image quality is captured by this parameter and estimated using the low backscatter targets such as calm water bodies in the image.
Accuracy and reliability assessment
To assess the accuracy and reliability of the estimates obtained from the analysis, the relative error and reliability coefficient were determined. Accuracy is often quantitatively reported in terms of relative error and calculated using (4) according to [21]:

The consistency of the estimates or reliability of the estimates was checked using the two most common reliability statistics: reliability coefficient and standard error of measurement (SEM). According to [Reference Livingston22], reliability statistics are the extent to which the measurements are consistent. The reliability coefficient is an absolute number of 0.00–1.00 [Reference Livingston22]. A value of zero indicates a complete lack of consistency, while a value close to 1 shows good consistency. The SEM indicates the consistency of the measurements and is expressed in the same units as the measurements [Reference Livingston22]. An SEM of zero indicates that the measurements are perfectly consistent. The reliability coefficient and SEM are related and calculated by (5) and (6), respectively [Reference Livingston22]:


where SD is the standard deviation, n = number of observations (n = 8; no. of CRs in an image) topics or overviews of the status of research and development on particular topics.
Results and discussions
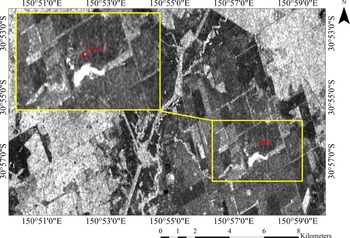
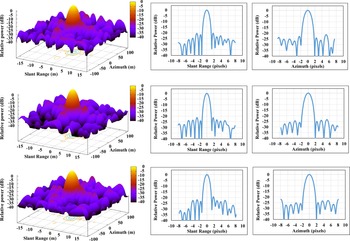
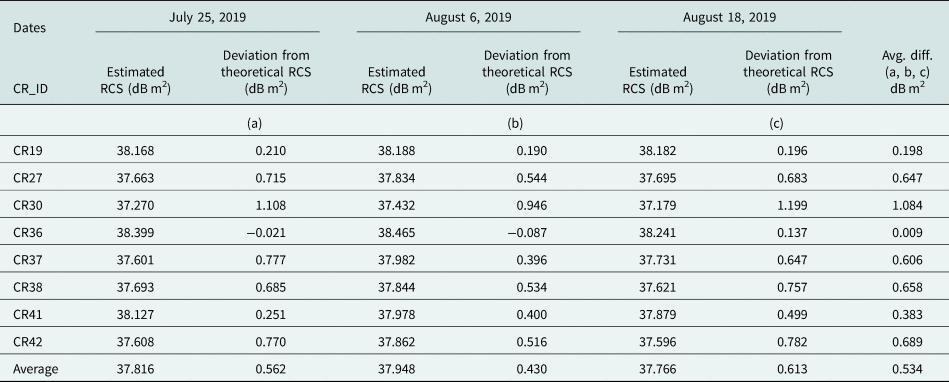
For the downloaded SAR images, RCS was estimated using the methodology described in “Methodology” section. The difference between theoretical RCS and RCS estimated from the SAR image was computed and is shown in Table 1. The theoretical RCS of a triangular trihedral of 1.5 m CR is 38.40 dB m2 for the C-band [Reference Garthwaite, Nancarrow, Hislop, Thankappan, Dawson and Lawrie12]. The difference between them was less than 1 dB m2 for all CRs except for CR30 due to less CR visibility above the background clutter. The average RCS difference for the study dates was 0.562, 0.430, and 0.613 dB m2. For precise calibration results, the SCR should be >20 dB (preferably ~30 dB) to minimize errors in the computation of the calibration factor, but the signal should also not be saturated [Reference Garthwaite, Nancarrow, Hislop, Thankappan, Dawson and Lawrie12, Reference Sharma, Dadhich, Rambhia, Mathur, Prajapati, Patel and Shukla14, Reference Freeman15, Reference Curlander and McDonough17]. The SCR computed for each CR was >35 dB, which shows the reliability of the results. Figure 4 shows the response of one of the CRs (CR19) in the Sentinel-1B (HH polarization) intensity image of July 25, 2019. Generated 3D and 2D IRFs of the same CR in all images are shown in Fig. 5. Figure 5 shows that the response of the CR is consistent on all study dates.
Response of CR-19 observed in the SLC image on July 25, 2019.

IRF, range, and azimuth resolutions generated for CR19 for July 25, 2019 (upper), August 6, 2019 (middle), and August 18, 2019 (lower) Sentinel-1B data.

Difference between estimated and theoretical RCS values

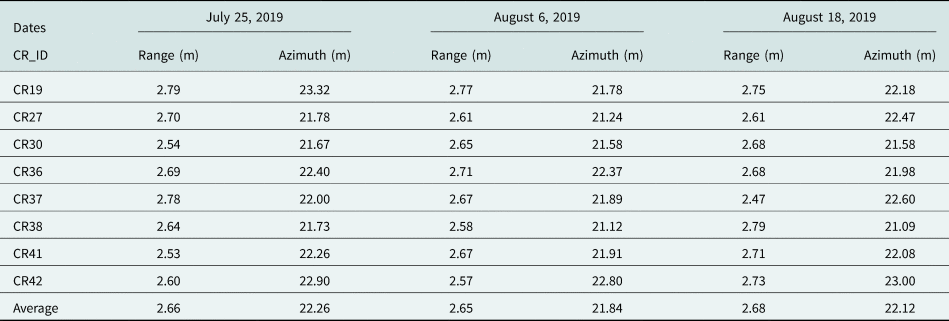
From the IRF, the range and azimuth resolution, PSLR and ISLR were measured for each CR. The average range resolutions obtained were 2.66, 2.65, and 2.68 m for the study dates, as shown in Table 2. Similarly, the average azimuth resolutions were 22.26, 21.84, and 22.12 m (Table 2). For the Sentinel-1 data product, the specified range and azimuth resolutions are 2.7 and 22.5 m, respectively [Reference Bourbigot, Johnsen, Riccardo and Hajduch23]. The results show that the estimated values are close to the specified values and confirm the good quality of the Sentinel-1B data.
Estimated spatial resolutions in the range and azimuth directions

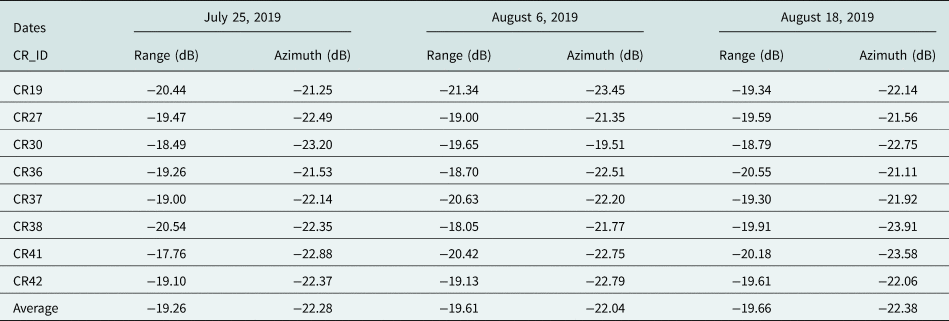
The average PSLR in the range direction for the study dates was −19.26, −19.61, and −19.66 dB, as shown in Table 3. Similarly, in the azimuth direction, the average PSLR obtained was −22.28, −22.04, and −22.38 dB, which are better than the specified PSLR value (−21.20 dB in the range and azimuth directions) [Reference Bourbigot, Johnsen, Riccardo and Hajduch23] and confirm the good quality of the data.
Estimated PSLR values in the range and azimuth directions

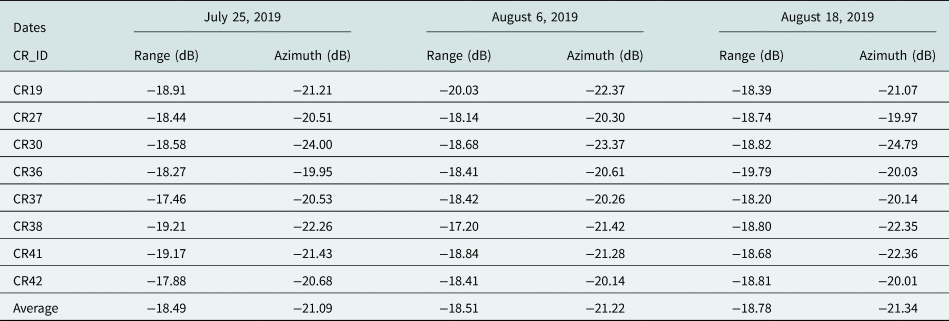
The average ISLR in the range direction obtained for the study period was −18.49, −18.51, and −18.78 dB. Similarly, in the azimuth direction, the average ISLR obtained was −21.09, −21.22, and −21.34 dB, as shown in Table 4. The estimated ISLR values in the range and azimuth directions were better than the specified ISLR value: −16.7 dB in the range and azimuth directions [Reference Bourbigot, Johnsen, Riccardo and Hajduch23].
Estimated ISLR values in the range and azimuth directions

NESZ was estimated from low backscatter areas in the intensity image. The NESZ values derived for July 25, 2019; August 6, 2019; and August 18, 2019 are −23.28, −23.10, and −23.10 dB, respectively. According to the Sentinel-1 product file, the specified NESZ is <−23.70 dB [Reference Bourbigot, Johnsen, Riccardo and Hajduch23]. The results are consistent with the provided values.
Results of accuracy and reliability assessment
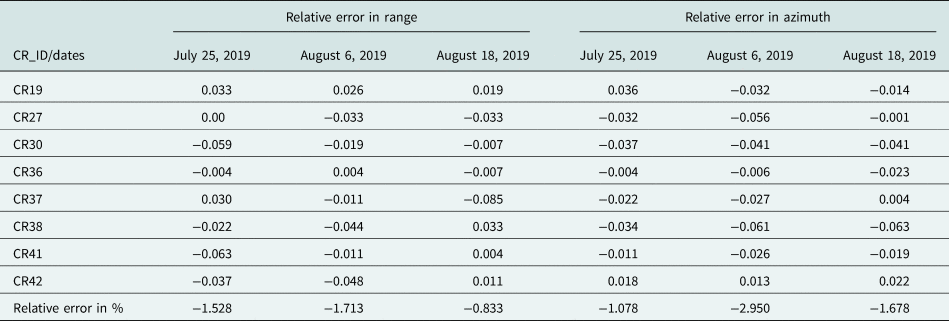
The accuracy and reliability of the estimates were determined by the method in “Accuracy and reliability assessment” section for the range and azimuth resolutions. According to the Sentinel-1 product definition, the specified values of the range and azimuth resolutions are 2.7 and 22.5 m, respectively. The relative error (in %) was calculated using (4) for each CR visible in the images in the study, as shown in Table 5. We observed that the relative error was within 2 and 3% for the range and azimuth resolution, respectively. This low error percentage indicates that the results are accurate.
Relative error estimated for spatial resolutions

Similarly, the consistency was determined using (5) for the estimated range and azimuth resolutions. The standard deviation, SEM, and reliability coefficient were calculated for the estimated spatial resolutions in Table 2. The observed SEM was close to zero, and the calculated reliability coefficient was ~0.9, as shown in Table 6. Thus, the estimated spatial resolutions were reliable at 87.5%.
Reliability coefficient estimated for spatial resolutions

Conclusions
This study presents the temporal stability assessment of the radiometric calibration and image quality parameters for Sentinel-1B SAR data using the deployed CR array in the Surat Basin, Australia. Using the integral power method, the RCS was estimated, and the difference from the theoretical value was reported in this study. The IRF generated using the response of the CR in the SAR image was used to estimate the data quality parameters. The deviation from the theoretical RCS and the derived image quality parameters were found to be consistent with the Sentinel-1 SAR system specifications, showing the good quality of Sentinel-1B data. Accuracy and reliability analyses were performed to check the error and consistency of the measurements. The calculated relative error or inaccuracy for the range and azimuth resolutions was insignificant (<3%). The reliability coefficient was close to 0.9, which proved the consistency of the results.
Acknowledgement
The authors gratefully acknowledge the encouragement and guidance received from Director-SAC. The authors express their sincere gratitude to Deputy Director, EPSA and Head, CVD, SAC Ahmedabad, for his support in performing this activity. The authors would also like to thank the Director, Institute of Technology, Nirma University for his support throughout the study. Thanks are also due to Shri V.M. Ramanujam and Shri Raghav Mehra for their cooperation and technical help. The authors express their gratefulness to the Head, Civil Engineering Department, Nirma Management.
 Sowkhya Badatala received her Bachelor's degree in Civil Engineering from Chaitanya Bharathi Institute of Technology (CBIT), Osmania University, Hyderabad, India, in 2015. She received a Master's degree in Geomatics from the Centre for Environmental Planning and Technology (CEPT) University, Gujarat, India, in 2017. Her M.Tech. thesis was focused on big data applications using open-source software. From 2017 to 2018, she worked as a research fellow with CEPT University, and later, in 2018; she joined Nirma University, Gujarat, India. Currently, she is working in the field of synthetic aperture radar data calibration as part of the collaborative project between Nirma University and Space Applications Centre, ISRO, Ahmedabad.
 Shweta Sharma received her M.Tech. degree from the Indian Institute of Technology Roorkee, India, in Solid State Electronic Materials in 2004 and Doctoral degree from the Indian Institute of Technology Bombay, India, in Geo-Informatics in 2020. She has been working as a Scientist in Space Applications Centre, ISRO, Ahmedabad, India, since 2004. She is a team member of the NASA-ISRO joint science team and theme lead of ISRO NISAR data calibration team. She is responsible for establishing the first Indian SAR calibration site in Antarctica and was one of the expedition members during the 38th Indian Scientific expedition to Antarctica (2018–2019). She is a member of many professional bodies like ISSE, IEEE-GRSS, ISG, and ISRS. She is a gold medalist and a recipient of Prof. Kakani Nageswara Rao Endowment Young Achiever Award for 2013 and the National Geomatics Award-Technology for the year 2021 conferred by the Indian Society of Geomatics.
 Saurabh Tripathi obtained his Bachelor's degree in Physical Sciences from the Indian Institute of Space Science and Technology, Trivandrum, India, in 2016, and the same year, he joined Space Applications Centre, ISRO Ahmedabad, India as a Scientist. His work is focused on the calibration of Microwave sensors. He is a team member of the NASA-ISRO joint science team and ISRO NISAR data calibration team. He was one of the members of the 39th Indian Scientific Expedition to Antarctica (2019–2020).
 Parul R. Patel received her Bachelor's degree in the year 1990 and Master's degree in the year 2000 from Birla Vishvakarma Mahavidyalaya, Sardar Patel University, Vallabh Vidyanagar. In 2009, she received a Ph.D. degree from the Indian Institute of Technology Bombay, India. She joined Nimra University, Gujarat, India, in August 1995 and currently working as a Professor in Civil Engineering Department. She has about 29 years of experience in Construction Technology & Management and Geomatics Applications. Few consultancy works are on her credit. Her areas of research are applications of remote sensing, geographical information system, and global positioning system. She has published more than 50 papers at national and international conferences and journals. She is a member of many professional bodies like ISTE, GRSS IEEE, IGS, ISG, ISRS, GICEA, etc. She is working as a secretary for ISG and GRSS, IEEE Gujarat chapter, and editorial member for the magazine published by the Indian Society of Remote Sensing.
 Aloke K. Mathur obtained his Master Degree in Physics from Rohilkhand University, Bareilly, India in 1983. He received Doctorate in Atmospheric Sciences from Berhampur University, Odisha, India in 1991. He served Indian Space Research Organisation for nearly 35 years, developed many online retrieval algorithms for various geophysical parameters using India's Earth Observational Satellite Data. He has published 125 scientific papers. He is a recipient of the Shri J Dasgupta Award in 1991 on cloud stereoscopy; he was a project leader for various ISRO missions like INSAT, Megha-Tropiques, and NISAR. He was a visiting scientist to CNES, France; ESA, Darmstadt, Germany; and Technical University, Crete, Greece.