1. INTRODUCTION
Malaria has affected Africans since at least 10,000 years. Historically, a major human killer, the disease still lead to 200 million clinical cases worldwide in 2013, causing up to 800,000 malaria-related deaths. 90% of these have been estimated to occur South of the Sahara in Africa.Footnote 1 Malaria infections not only cause mortality but also morbidity, accounting for 10% of hospital admissions in sub-saharan Africa, and involve sizable economic losses.Footnote 2 Surveys from several African countries record illness as the main risk perceived by individuals (followed by shortages of food).Footnote 3
Despite this, available empirical estimates of the effect of malaria for economic development are mixed and the role of the exposure to the pathogen for development is intensely debated. The earlier findings of a sizable negative effect of exposure to malaria on income per capita across countries, see, e.g., Gallup et al. (Reference Gallup, Sachs and Mellinger1999), Gallup and Sachs (Reference Gallup and Sachs2001), and Sachs (Reference Sachs2003), have been qualified and questioned subsequently, see Weil (Reference Weil2010, Reference Weil2011, Reference Weil2016 and Reference Weil2017). Recently, the focus has shifted to the analysis of disaggregate data, which provide substantial advantages with respect to identification. The results of the long-term effect of exposure to malaria on pre-colonial African development at the sub-national (ethnic group) level by Depetris-Chauvin and Weil (Reference Weil2016) reveal, however, no sizable and significant effect.
This paper contributes an exploration of the role of long-term exposure to malaria for economic development today using disaggregate, grid-cell, data for sub-saharan Africa. In general, higher mortality can be a burden for economic development both directly, e.g., through lower labor productivity, and indirectly, by reducing the incentives for long-term investments (most notably education and savings) or by reducing the opportunity costs to predation and civil violence.Footnote 4 Mortality also affects population growth and, therefore, population density in the long run. The predicted overall effect on income per capita, or equivalently on disaggregate proxies like night lights per capita, is therefore generally ambiguous, see Acemoglu and Johnson (Reference Acemoglu and Johnson2007), Ashraf, Lester and Weil (Reference Ashraf, Lester and Weil2008), and Cervellati and Sunde (Reference Cervellati and Sunde2011).
This paper adds new empirical evidence on the effect of malaria using a novel identification strategy that is based on epidemiological features of malaria. The first issue in isolating the role of malaria for economic development is identifying the direction of causality. Malaria incidence primarily depends on exogenous geo-climatological conditions. However, it is also affected by economic activity, urbanization, population dynamics, and health coverage, as well as by treatment opportunities of infections, among others. Problems of omitted variables and reverse causality have been argued to be particularly serious for an analysis at the level of countries. The use of disaggregate, cell level, data provides substantial advantages in this dimension by exploiting within-country variation. As proxy for local development, we use the natural logarithm of night lights per capita, following a recent literature discussed in Section 2. The results document a negative correlation between malaria, measured by a newly released disaggregate data set on clinical incidence of Plasmodium falciparum malaria, and night lights per capita. In order to explore the causal effect, we further run intention-to-treat regressions using the strength and stability of malaria transmission in a location using the index by Kiszewski et al. (Reference Kiszewski, Mellinger, Spielman, Malaney, Sachs and Sachs2004). This index provides estimates of “predicted” rather than “actual” malaria exposure using information on locally prevalent malaria vectors and bio-climatological conditions, which are less prone to reverse causality than incidence data.Footnote 5 The results are robust to extensive controls and corroborated when using alternative measures of long-term exposure to malaria including endemicity in the African population in 1900.
The second issue, which is very relevant but has been largely overlooked in the empirical literature, is about the empirical specification. The effect of malaria on economic development has been typically explored postulating a linear empirical relationship. The specific features of malaria epidemiology suggest, however, that the effect should be expected to be nonlinear. Malaria is the prototypical Mendelian disease. In fact, it is the strongest known selective pressure of the human genome, see Kwiatkowski (Reference Kwiatkowski2005). In the affected populations, long-term exposure to the pathogen induced the abnormal diffusion of several types of genetic immunities (mostly, but not only, in terms of blood disorders). Furthermore, in highly endemic areas individuals who survive, potentially repeated, malaria infections at young ages develop acquired immunities, which make them less susceptible to the pathogen as adults, even to the point of almost eliminating the likelihood of developing severe malaria symptoms and making the disease asymptomatic, see Langhorne et al. (Reference Langhorne, Ndungu, Sponaas and Marsh2008). As a result, child mortality tends to increase monotonically with the exposure to the pathogen, whereas the latent malaria risk for adults is actually higher in areas where malaria transmission stability is comparatively low (less frequent and unstable over time). This feature implies that the effect of malaria on economic activity (which is presumably mostly related to health and mortality of adults rather than children) should be expected to be nonlinear (and possibly even non-monotonic). Consistent with these arguments, we find that the effect of Malaria is mostly detrimental for areas with a high latent malaria risk for adults that are characterized by low to intermediate levels of long-term exposure to the pathogen. A first exploration of the channel behind the results suggests the important role of genetic immunities (in terms of the spread of the sickle cell trait in the population) as a significant moderating factor in high malaria risk areas.
The paper is organized as follows. Section 2 provides a short discussion of the malaria epidemiology background, presents the data, and introduces the empirical strategy. Section 3 presents the results. Section 4 offers some concluding considerations.
2. BACKGROUND, DATA, AND ESTIMATION APPROACH
This section briefly presents some relevant information concerning the specificities of malaria epidemiology, discusses the data used in the empirical analysis of Section 3, and describes the empirical strategy.
2.1. Background: Malaria Epidemiology
Malaria is a vector-transmitted infectious disease caused by the plasmodium parasite. Infections cause severe fevers and frequently lead to death, in particular at child age. Most deaths worldwide are caused by Plasmodium falciparum and occur in sub-saharan Africa. The plasmodium parasite cannot be transmitted directly from human to human, transmission occurs exclusively through female anopheles mosquitos, which require blood meals from vertebrates for reproduction. Hence, malaria transmission is closely related to the existence of suitable geographic and climatological conditions favorable for the vector and the reproduction of the parasite. Existing evidence suggests that upon recovery, infected individuals develop resistance or even protective immunity against the disease, in particular immunity against a lethal infection [Langhorne et. al. (Reference Langhorne, Ndungu, Sponaas and Marsh2008)]. The acquisition of immunity appears to be closely related to the frequent exposure to the pathogen. As a result, protective immunities are most prevalent in highly endemic areas characterized by high and stable exposure to infection [Stanisic et al. (Reference Stanisic, Fowkes, Koinari, Javati, Lin, Kiniboro, Richards, Robinson, Schofield, Kazura, Siba, Mueller and Beeson2015)]. Besides developing acquired immunity, in these areas, evolutionary pressure also led to a greater prevalence of genetic immunities, such as the prevalence of the so-called sickle cell trait, an abnormal allele of the hemoglobin beta gene (HbS) that implies greater survival chances compared to individuals with normal hemoglobin alleles in the context of Plasmodium falciparum infections [Ferreira et al. (Reference Ferreira, Marguti, Bechmann, Jeney, Chora, Palha, Rebelo, Henri, Beuzard and Soares2011)]. As consequence of selective pressure, the prevalence of sickle cell trait is closely related to the exposure to malaria infections.
2.2. Data
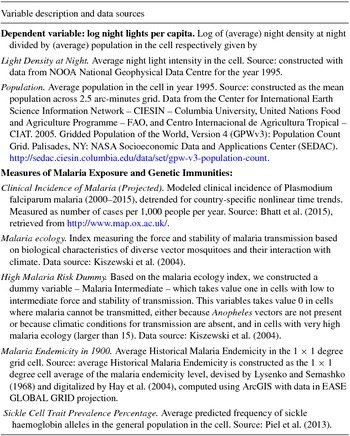
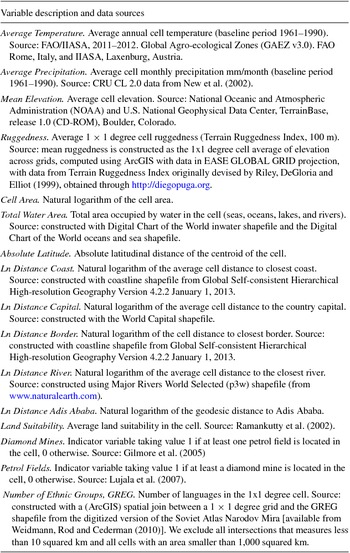
We use cells of 1 × 1 degrees as units of observation. In the following, we provide a short description of the main variables of interest and data sources. A more detailed description of the coding of each of the variables and the corresponding data sources is reported in Tables A1 and A2.
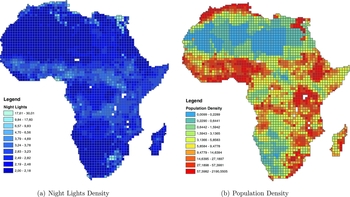
Night Light Intensity per Capita. Building on the seminal contribution of Henderson, Storeygard, and Weil (Reference Henderson, Storeygard and Weil2012), satellite image data on light density at night have recently been used as a proxy for income production at disaggregate level [see, e.g., Chen and Nordhaus (Reference Chen and Nordhaus2011), Pinkovskiy (Reference Pinkovskiy2013), Michalopoulos and Papaioannou (Reference Michalopoulos and Papaioannou2013a and Reference Michalopoulos and Papaioannou2013b), and Pinkovskiy and Sala-i-Martin (Reference Pinkovskiy and Martin2016), for recent applications]. We follow, in particular, Alesina, Michalopoulos and Papaioannou (Reference Alesina, Michalopoulos and Papaioannou2016) and proxy economic development at the disaggregate level building a measure of log ‘light density at night per capita” given by Ln(Night Lights/Population), ‘log night lights per capita”, henceforth.Footnote 6 Night light intensity per capita is computed by averaging luminosity observations across pixels that fall within each one degree cell and then dividing by population in that cell. Figure 1 depicts the spatial distribution of night lights and population density.Footnote 7
(a) Depicts the spatial distribution of Light Density at Night while (b) depicts the distribution of population density. Both figures plot the data over grid cells of 1 × 1 degrees in Africa. See Table A1 for data description and sources.

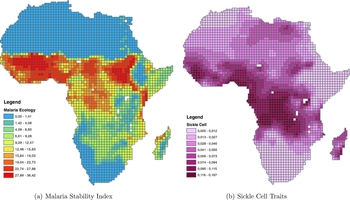
Exposure to Malaria. Data of projected clinical cases of Plasmodium falciparum malaria are from Bhatt et al. (Reference Bhatt, Weiss, Cameron, Bisanzio, Mappin, Dalrymple, Battle, Moyes, Henry, Eckhoff, Wenger, Briet, Penny, Smith, Bennett, Yukich, Eisele, Griffin, Fergus, Lynch, Lindgren, Cohen, Murray, Smith, Hay, Cibulskis and Gething2015) (data are available only for a subset of cells). Since this measure is problematic for reasons discussed below, we use the malaria strength and stability index, henceforth labeled ‘malaria ecology”, constructed by Kiszewski et al. (Reference Kiszewski, Mellinger, Spielman, Malaney, Sachs and Sachs2004) as baseline measure of malaria exposure. The index is a measure of predicted exposure to the pathogen that is built using information on the geo-climatic conditions and the biological characteristics of the dominant mosquito vectors in each location.Footnote 8 To explore the robustness of the findings and the persistence of the effect, we use data on historical malaria endemicity in 1900 constructed by Lysenko and Semashko (Reference Lysenko and Semashko1968) and digitalized by Hay et al. (Reference Hay, Guerra, Noor, Tatem and Snow2004). Finally, we use information on the spatial distribution of genetic immunities in terms of the prevalence of the sickle cell trait in the population using data from Piel et al. (Reference Piel, Patil, Howes, Nyangiri, Gething, Dewi, Temperley, Williams, Weatherall and Hay2013). Figure 2 depicts the spatial distribution of predicted malaria exposure and of the sickle cell trait.
2(a) reports the spatial distribution of the malaria stability index [from Kiszewski et al. (Reference Kiszewski, Mellinger, Spielman, Malaney, Sachs and Sachs2004)] over grid cells of 1 × 1 degrees in Africa. (b) reports the respective spatial distribution of the average sickle cell trait in the population. See Table A1 for data description and sources.

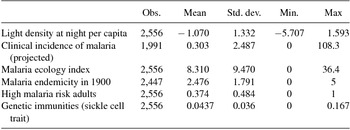
Table 1 presents the descriptive statistics for the main variables of interest.
Descriptive statistics

Note: The description, coding, and data sources used to construct each variable are described in details in Table A1.
Covariates. The empirical specification conditions on a large set of cell-specific covariates that could confound the effect of predicted malaria exposure on economic development including proxies for climate (average precipitation and temperatures), geography (mean elevation and average terrain ruggedness), natural resources (land suitability for agriculture, the presence of diamond mines, and the presence of petrol fields), ethnic inequality as well as a full set of cell area, location, and distance controls. The description of the different variables and their data sources is described in details in Table A2.
2.3. Estimation Approach
The empirical specification uses cells of 1 × 1 degrees for the whole continent of Africa as units of observation. The estimation framework exploits within-country variation in the exposure to the malaria pathogen and economic development by including country fixed effects. This allows controlling for country-specific factors, such as institutions, ethnic composition, as well as historical factors. In addition, the estimation is based on different specifications that subsequently include various sets of control variables to rule out confounding effects.Footnote 9
3. RESULTS
This section starts by presenting the baseline correlation and the results of intention-to-treat regressions. The analysis then explores the existence of nonlinear effects of long-term exposure to malaria and the role of interactions between exposure to the pathogen and genetic immunities.
3.1. Linear Specification
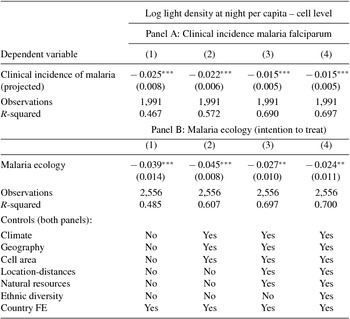
Table 2 presents the baseline results that exploits variation across cells within a country. Panel A shows the correlation between (projected) clinical incidence of Plasmodium falciparum malaria [from Bhatt et al. (Reference Bhatt, Weiss, Cameron, Bisanzio, Mappin, Dalrymple, Battle, Moyes, Henry, Eckhoff, Wenger, Briet, Penny, Smith, Bennett, Yukich, Eisele, Griffin, Fergus, Lynch, Lindgren, Cohen, Murray, Smith, Hay, Cibulskis and Gething2015)] and log night lights per capita. Column (1) presents results for the unconditional specification without additional controls. This specification is extended subsequently by including controls for climate, geography, and cell area in Column (2), and additionally for location-distances and natural resources in Column (3). Column (4) further adds controls for ethnic diversity with the caveat that, following Cervellati, Chiovelli and Esposito (Reference Cervellati, Chiovelli and Esposito2016), the number of ethnic groups in a cell is potentially endogenous to the long term exposure to malaria through evolutionary dynamics. The findings throughout all specifications reveal a negative linear relationship between projected incidence of Plasmodium falciparum malaria and log night light per capita. These correlations should be taken as purely suggestive, however. The reason is that the projection of malaria incidence is based on survey information about clinical Plasmodium falciparum cases that is then extrapolated across time and space. The survey information is likely to be subject to substantial reporting error and might be affected by the occurrence of civil conflict. Moreover, given the spatially and temporally scattered survey data of clinical cases, the extensive use of spatial and temporal interpolation is required to obtain data at the cell-year level (and even using projections only allows for a partial coverage of all the cells in Africa). In order to obtain the best possible predicted measure of malaria incidence based on limited survey information, the projections make use of a large set of geo-climatological and socio-demographic variables (including population density) that are likely to be directly related to night lights per capita. As a consequence, back-projected data on malaria incidence are not suited for the purpose of establishing a causal link between malaria prevalence and development, and the interpretation of these results is therefore potentially problematic.
Linear specification

Note: The unit of observation is a 1 × 1 degree cell. The dependent variable is the intensity of log night lights per capita. See text for details. Panel A: “Clinical incidence of malaria (projected)” is a projection of clinical incidence of Plasmodium falciparum malaria (per 1,000) obtained by interpolating across space and over time available malaria prevalence data retrieved from surveys using a large number of dynamic environmental and socio-demographic covariates to avoid missing observations. Data are from Bhatt et al. (Reference Bhatt, Weiss, Cameron, Bisanzio, Mappin, Dalrymple, Battle, Moyes, Henry, Eckhoff, Wenger, Briet, Penny, Smith, Bennett, Yukich, Eisele, Griffin, Fergus, Lynch, Lindgren, Cohen, Murray, Smith, Hay, Cibulskis and Gething2015). Panel B: Malaria ecology is the index of malaria transmission strength and stability by Kiszewski et al. (Reference Kiszewski, Mellinger, Spielman, Malaney, Sachs and Sachs2004). The “Climate” controls include average precipitation and average temperature. The “Geography” include, mean elevation, average terrain ruggedness. The ‘cell area” controls for the total cell area and the total area of the cell occupied by water. The ‘location and distances” controls include absolute latitude, the natural logarithm of the distance to the country capital, to the coast, to the country border, to the closest river and to Addis Ababa. The “natural resources” controls include the average land suitability for agriculture, the presence of diamond mines and the presence of petrol fields. The “ethnic-diversity” controls for the number of ethnic groups in the cell (GREG Database). See Table A1 for description of each variable and the sources, and Table 1 for descriptives. OLS estimates. Robust standard errors in parentheses. ***, **, * indicate significance at 1-, 5-, and 10-% level, respectively.
In order to come up with a more plausible estimate of the causal effect of malaria risk on development, Panel B of Table 2 uses the malaria ecology index from Kiszewski et al. (Reference Kiszewski, Mellinger, Spielman, Malaney, Sachs and Sachs2004), which provides an indirect measure of malaria incidence based on information about prevalent vectors and bio-climatological characteristics, rather than using projections based on actual clinical incidence from survey data. The use of this measure, which is effectively based on geo-climatological information only, also allows conducting the analysis for the full sample of cells. Moreover, the use of a measure of malaria risk based on exogenous factors, rather than on projections of the actual malaria incidence, of reverse causality and allows for improvements regarding problems of measurement error, which is a very serious issue for measures of disease incidence in sub-saharan Africa. The results confirm the patterns of Panel A.Footnote 10 In particular, the estimates display systematically and significantly negative effect of malaria prevalence on development in terms of log night lights per capita. Incidentally, the effect associated with the coefficient estimates in Panel B is larger in magnitude than in Panel A, which might point to issues of attenuation bias or potential endogeneity in Panel A.Footnote 11
3.2. Non-Linear Specifications
In view of the malaria epidemiology literature, the long-term exposure to malaria should be expected to influence development, measured by ln night light per capita, in a nonlinear way. As discussed in Section 1, the reason is that malaria exposure affects differentially economic activity and population density. Specifically, one would expect malaria to be more detrimental for income per capita for intermediate exposure to the pathogen, which implies a population that is highly susceptible to malaria infections, which are only occurring rather infrequently.
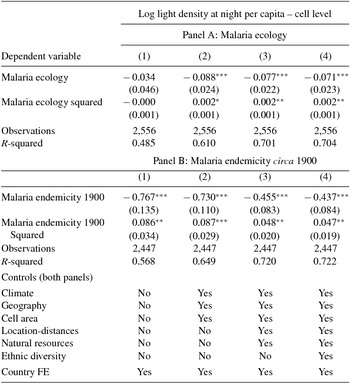
As a first exploration of this issue, Table 3 goes beyond the linear specification and presents results obtained with a nonlinear (quadratic) specification. Panel A replicates the analysis with a specification that includes malaria ecology as linear and squared term. Consistent with the hypothesis, the findings reject the null hypothesis of a linear relationship and document the existence of a U-shape relationship between malaria exposure and log night lights per capita. In fact, the effect of malaria appears to be most detrimental for cells with intermediate strength and stability of malaria transmission (i.e., an index of around 18 to 20 on a scale from 0 to 36).Footnote 12 As robustness, and to explore the persistence of the effect, Panel B replicates the analysis using information on Malaria Endemicity in 1900.Footnote 13 The findings confirm the nonlinear, U-shaped pattern of malaria exposure on economic development in terms of light intensity.Footnote 14
Non-linear effects

Note: The unit of observation is a 1 × 1 degree cell. The dependent variable is the intensity of log night lights per capita. See text for details. Panel A: “Malaria ecology” is the index of malaria strength and stability by Kiszewski et al. (Reference Kiszewski, Mellinger, Spielman, Malaney, Sachs and Sachs2004). Panel B: “Malaria endemicity in 1900” is the index of average historical malaria endemicity by Lysenko and Semashko (Reference Lysenko and Semashko1968) and digitalized by Hay et al. (Reference Hay, Guerra, Noor, Tatem and Snow2004). See the text and the caption of Table 2 for description of the variables included in each category of controls and Table A1 for a description of each variable and their sources, and Table 1 for descriptives. OLS estimates. Robust standard errors in parentheses. ***, **, * indicate significance at 1-, 5-, and 10-% level, respectively.
3.3. High Malaria Risk for Adults and Interactions with Genetic Immunities
We end the analysis by exploring the robustness of the findings as well as the potential role of immunities in moderating the detrimental effects of malaria. As a first step, which also reflects the previous findings of a nonlinear effect of malaria exposure on development, we construct a binary measure of malaria risk. This measure takes value one for low and intermediate levels of the malaria ecology index, consistent with infrequent exposure to malaria infections and thus a relatively high susceptibility of the population, as compared to cells with high malaria transmission stability and correspondingly frequent infections that are likely to lead to acquired immunity of large parts of the population. Hence, the measure effectively picks up an intermediate range of the malaria ecology index in a binary way, since a value of 1 corresponds to greater effective malaria exposure as consequence of the lack of acquired immunity.
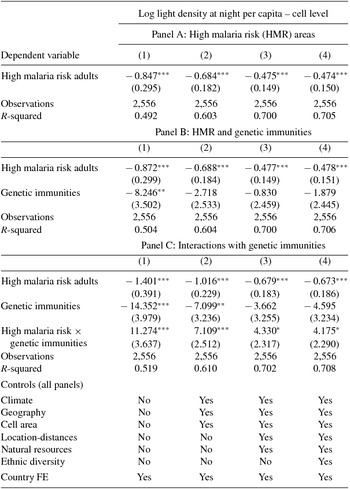
As a first step, we estimate the effect of this binary risk measure on economic performance in terms of log night lights per capita. This effectively provides an additional robustness check of the nonlinear effect of malaria exposure by comparing high risk cells to low risk cells. The results reported in Table 4 Panel A document a significantly negative effect of high malaria risk and thereby confirm the earlier findings of a nonlinear effect of malaria exposure on development. In particular, the effect of malaria appears to be particularly negative in cells that face a higher latent malaria risk for adults in view of the low levels of immunities in the population as indicated by the epidemiological literature.
High malaria risk for adults and genetic immunities (sickle cells)

Note: The unit of observation is a 1 × 1 degree cell. The dependent variable is the intensity of log night lights per capita. See text for details. “High malaria risk” is a binary indicator for low to intermediate malaria exposure taking value 1 for cells with an average malaria transmission stability index [from Kiszewski et al. (Reference Kiszewski, Mellinger, Spielman, Malaney, Sachs and Sachs2004)] larger than 0 and lower than 15. Genetic Immunities is the index of Sickle Cell Trait Prevalence (in percentage over the population) by Piel et. al. (Reference Piel, Patil, Howes, Nyangiri, Gething, Dewi, Temperley, Williams, Weatherall and Hay2013). See the text and the caption of Table 2 for description of the variables included in each category of controls and Table A1 for a description of each variable and their sources, and Table 1 for descriptives. OLS estimates. Robust standard errors in parentheses. ***, **, * indicate significance at 1-, 5-, and 10-% level, respectively.
As a second step, we extend this analysis by explicitly accounting for the prevalence of genetic immunity in terms of the sickle cell trait in the population, which provides affected individuals with some immunity to malaria parasitization of red blood cells. The prevalence of genetic immunities in the population is informative both on the extent of past malaria exposure and on the existence of genetic immunities to malaria today. Moreover, to the extent that sickle cell prevalence picks up genetic factors, the high malaria risk variable is more likely to reflect (the lack of) acquired immunity. Table 4 Panel B presents the results from this extended empirical specification that explicitly accounts for high malaria risk and the prevalence of the sickle cell trait in the population. The results suggest that both effective malaria risk (reflected in the lack of acquired immunities) and the long-term exposure in the past (reflected by the prevalence of genetic immunities) have a negative effect on development in terms of log night lights per capita.
As a last step, we explore the interaction of these two dimensions, extending the contrast between low and high risk areas by the presence of different levels of genetic immunities in terms of sickle cell prevalence.Footnote 15 The results in Panel C of Table 4 document the existence of an attenuating effect of the prevalence of genetic immunity in terms of the sickle cell trait, even within high malaria risk areas (as reflected in the positive coefficient for the interaction term). The effect of a high latent malaria risk (i.e., the lack of acquired immunity in the presence of a risk of infection) today is reduced by the existence of genetic immunities in the population, which moderates (but not fully eliminates) the negative effect of malaria risk on economic development. However, the total effect remains negative.
3.4. Magnitude of the Effects
The interpretation of the magnitude of the economic effect of long-term exposure to malaria requires evaluating the nonlinear effect on light density and providing a quantitative mapping between night light intensity and income.
Taking at face value the coefficient estimated in the linear regression of malaria ecology on night lights per capita in Panel B of Table 2, a unit increase in the malaria ecology index by 1 is associated with a reduction in per capita luminosity between 2.4 and 4.5%. The results in Table 3 show that the relationship between malaria and night lights is nonlinear and U-shaped; with a minimum for index values of around 18 to 20. This minimum represents the malaria ecology index for which light density is lowest, i.e., for which the effect is most detrimental. Since the effect varies with the malaria ecology index, a quantitative assessment appears more straightforward in the context of the nonlinear estimates obtained with a binary measure of high malaria risk as in Panel A of Table 3. Everything else equal, a high risk to malaria exposure reduces light density by 0.475 log points in the most extensive specifications.
A small but rapidly growing literature addresses the question about the link between measures of night light intensity and economic activity. This literature provides different parametric estimates of the elasticity of several measures of economic activities with respect to several measures of night light intensity. By exploiting within-country variability over time, Henderson, Storeygard and Weil (Reference Henderson, Storeygard and Weil2012) provide estimates of elasticities of approximately 0.3 for growth rates and long differences.Footnote 16 The correct mapping from night lights to GDP is far from trivial, however. Furthermore, the interpretation of our findings in terms of GDP per capita is subject to some specific caveats. First, no estimate of the elasticity between light and income within countries is available specifically for Africa. Following on the insights by Bickenbach et al. (Reference Bickenbach, Bode, Nunnenkamp and Söder2016), the elasticity for Africa might differ from the world average elasticity. Using within country variation across regions with data from Brazil, India, the United States, and Western Europe, they obtain significantly different estimates across regions with a lower bound in the range of 0.10.Footnote 17 Second, in light of the nature of the analysis, linking data of long-term malaria exposure to long-term development, we look at levels of night light density (across regions and within countries) and not growth rates as in the majority of these studies.Footnote 18 Finally, we look at night light per capita (rather than per area) since, as discussed above, the effect of malaria exposure in the long run should be expected to matter for both economic activity and population density.
Some of the available elasticity estimates in the literature discussed above are derived from empirical specifications that are conceptually equivalent to our estimates in levels with country fixed effects. In particular, Henderson et al. (2011) estimate regressions in long differences that link changes in night light per area to changes in GDP. Keeping in mind the previously discussed caveats regarding comparability, heterogeneity, and stability of the elasticity, and under the assumption that population levels are sufficiently stable over the observation period, these estimates can be used to get a sense of the bounds of the magnitude of the effect of malaria on income. Considering an elasticity between the two (lower and upper) bounds of 0.10 and 0.30 [as estimated by Bickenbach et al. (Reference Bickenbach, Bode, Nunnenkamp and Söder2016) and Henderson et al. (2011), respectively] would imply an effect of the exposure to a high latent malaria risk on GDP per capita within countries in Africa in the range of − 5 to − 15%.Footnote 19
4. CONCLUDING REMARKS
This paper has explored the role of long-term exposure to malaria for African development today using grid cell level data for the whole continent. The results document the existence of a U-shaped effect of long-term exposure to malaria and disaggregate data of economic development measured by log night lights density per capita. The documented empirical patterns are robust to a set of unreported checks.Footnote 20 The documented patterns are consistent with evidence in malaria epidemiology on the emergence of genetic and acquired immunities that make the latent malaria risk for adults highest for intermediate levels of exposure to the pathogen. The results also suggest a relevant moderating role of genetic immunities. The analysis does not allow to unfold the mechanisms behind the documented regularity, however. Investigations of the channels appear a fruitful direction for future research.
APPENDIX
Data sources and description of main variables of interest

Data sources and description of covariates