Surgical site infections (SSI) cause considerable postoperative morbidity and mortality, including increased rates of readmission and reoperation, protracted hospital stays, prolonged use of antibiotics, and death.Reference Astagneau, Rioux, Golliot and Brücker 1 – Reference Dohmen 3 Risk factors for SSI have been well described, and understanding them enables clinicians to devise strategies to modify these risks. However, the association of seasonality with SSI is less understood. To elucidate the temporal variability of SSI and changes in rate over time, we examined the rate of deep SSI (dSSI) for common surgical procedures over 9.67 years. Our null hypotheses were that there is no significant difference in dSSI rate between different months or seasons throughout the year and that there is no significant change in dSSI rates over the study period.
Materials and Methods
Data collection
In this observational study, we evaluated the dSSI rates following different operative procedures between January 2009 and August 2018. We retrospectively reviewed the prospectively collected database of SSI amassed by our institution’s Department of Hospital Epidemiology and Infection Control. The dSSI diagnoses were made according to the Centers for Disease Control and Prevention (CDC) definition.Reference Horan, Gaynes, Martone, Jarvis and Emori 4
Data collection initially began with focus on the following surgeries: colorectal surgery, hysterectomy, hip prostheses, knee prostheses, laminectomy, spinal fusion, shoulder prostheses, craniotomy, coronary artery bypass graft with and without donor site incisions, peripheral valve bypass surgery, cardiovascular valve surgery, and other cardiac surgery. Additional procedures were added during the study period. Any procedures for which collection had begun by January 2009 and for which date were available for ≥108 months were included.
Seasons were defined as winter (December–February), spring (March–May), summer (June–August), and fall (September–November). A dSSI rate was assigned to the month and season in which the operative procedure occurred.
Statistical analysis
The results were analyzed based on the overall dSSI rate for all included procedures. Poisson regression was utilized to determine the impact that season has on SSI rates over time. Additionally, the effect that individual months had on dSSI rates were assessed with Poisson regression while controlling for the year. P < .05 was considered statistically significant.
Results
Data were collected from 22 procedures spanning 121,520 cases over the course of 116 months. Of these 22 procedures, 9 procedures did not meet inclusion criteria. The remaining 13 procedures as mentioned in the methods section included 98,068 cases.
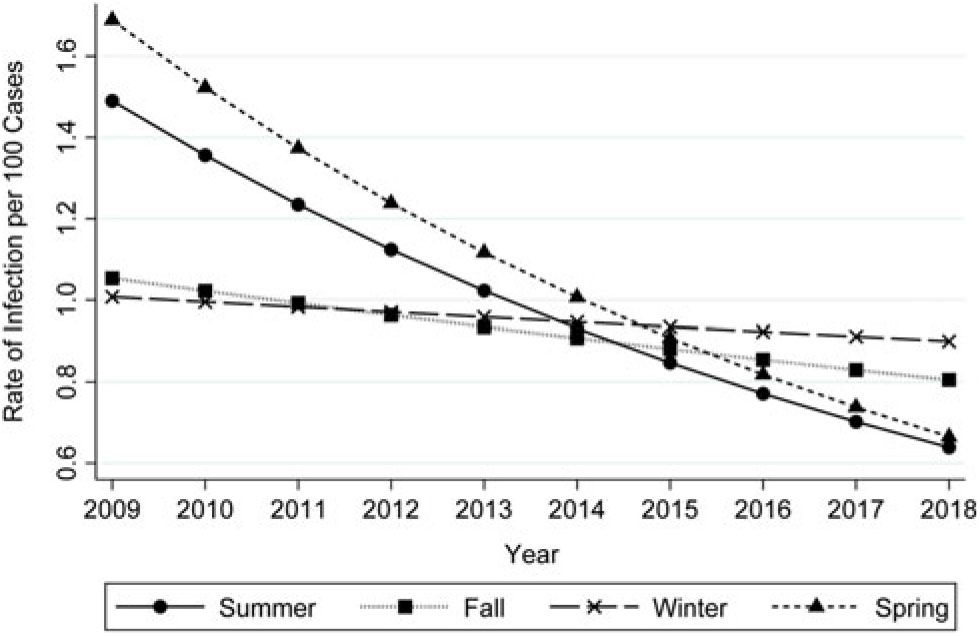
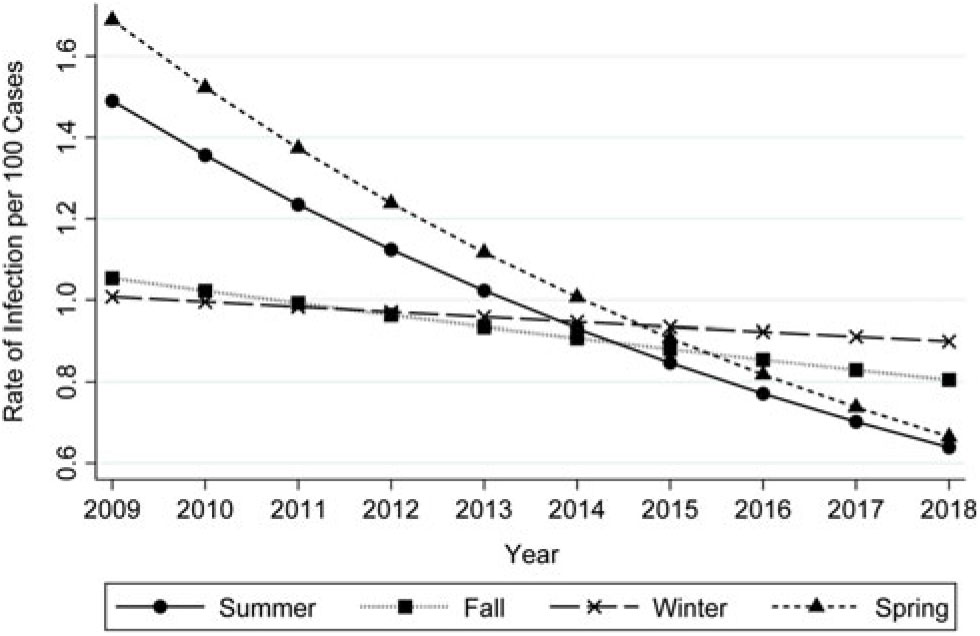
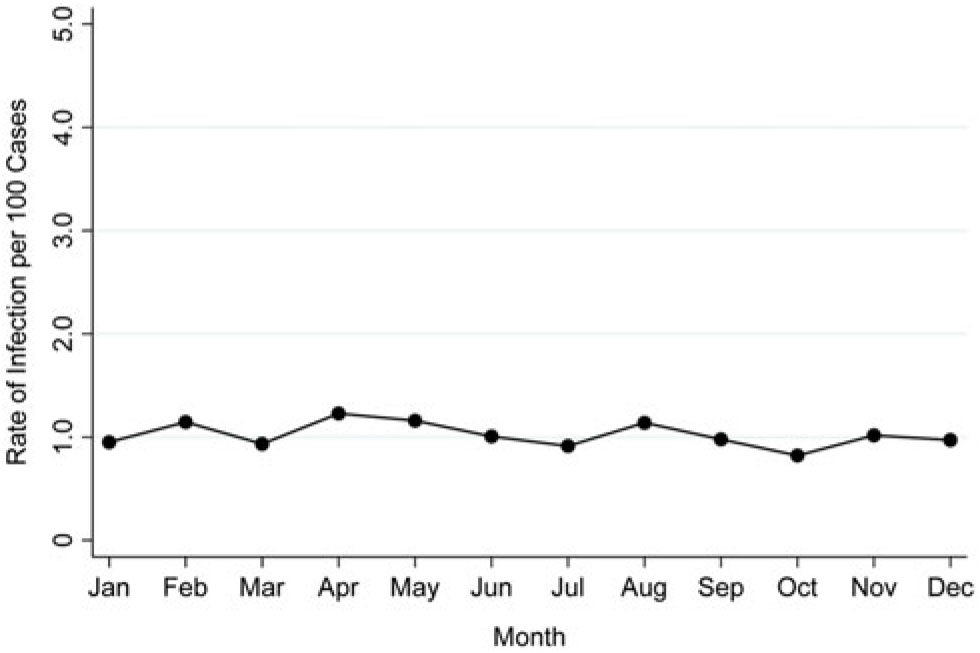
The average dSSI rate over the study period across all procedures was 1.03 per 100 patients (standard deviation, 0.51). The overall yearly rate of SSI decreased significantly over the study period (r = 0.91; 95% confidence interval [CI], 0.87–0.95) (Fig. 1 and Supplemental Table 1 online). With summer as the reference season, winter had a significantly lower rate of SSI (r = 0.62; 95% CI 0.41–0.95). The overall average decline in SSI over time is significantly muted in the winter as compared to the Summer (r = 1.08; 95% CI, 1.02–1.16) (Fig. 1 and Supplemental Table 1 online). When the data were analyzed by month with July as a reference, there was no statistically significant variability in overall SSI rate (Fig. 2 and Supplemental Table 2 online).
Association of season and rate of deep surgical site infection over time.
Association of month and rate of deep surgical site infection.
Discussion
Surgical site infections
Deep surgical site infections are a significant cause of morbidity and mortality for patients undergoing operative procedures.Reference Astagneau, Rioux, Golliot and Brücker 1 – Reference Dohmen 3 In this study, we examined the temporal variability of the dSSI rate for a variety of common surgical procedures at an academic medical center. The average dSSI rate in this study population was 1.03%. This value was less than that reported by Mu et al in their 2011 study of the National Healthcare Safety Network (NHSN), which was 1.90% across 39 operative procedure categories.Reference Mu, Edwards, Horan, Berrios-Torres and Fridkin 5
Year
We rejected the null hypothesis with respect to change in dSSI rate over time. The dSSI rate at our institution decreased significantly across the study period. Possible explanations include modernization of the HVAC system and standardization of pre- and intraoperative antibiotic protocols. Reports in the literature have conflicted with respect to change in SSI rate over time. Kurtz et alReference Kurtz, Lau, Watson, Schmier and Parvizi 6 queried the Nationwide Inpatient Sample (NIS) between 2001 and 2009 and found a statistically significant increase in SSI following both hip and knee arthroplasty. Conversely, between 2015 and 2017, the New York State Department of Health (NYS DOH) reported a 21% decrease in SSI following colon surgery and a 5% decrease in SSI following hip replacement or revision surgery. 7
Season
We also rejected the null hypothesis with respect to seasonal variability, noting a significantly higher dSSI rate in the summer compared to winter across the study period. This finding is mostly consistent across the literature, with multiple studies reporting increased rates of SSI in the summer overall and during the summer months.Reference Hardaway, Raslan and Burchiel 8 Possible explanations include increased humidity, average temperature, and temporal incidence of infectious organisms.
Interestingly, the overall average decline in dSSI over the study period was muted in the winter compared to the summer. One possible explanation is regression to the mean: given the greater rate of SSI in the summer as compared to the winter, interventions likely have a greater effect in the summer.
Month
In contrast to seasonal variability, we did not reject the null hypothesis for monthly variability. Our lack of variability in SSI rate with July as the reference month conflicts with some previous reports in the literature. One explanation often offered for an increased rate of postoperative complications in the summer months, most commonly in July, is the “July effect.” The “July effect” describes the time of the academic year when residents transition to their next year of training and new interns enter the hospital. The significance of this effect has not been well characterized. Tobert et alReference Tobert, Menendez, Ring and Chen 9 reported results similar to those of the present study when they utilized National Inpatient Sample (NIS) data from 2002 to 2011 on 178,000 total shoulder arthroplasty cases and failed to demonstrate an increased risk of SSI in July. In contrast, Gruskay et alReference Gruskay, Smith and Kepler 10 demonstrated a significant increase in infection rate as months transitioned from June to July, coinciding with the influx of new residents.
Our study had several limitations. Although the sample size was large, we only collected information about infection rate, depth of infection, and timing; thus, it was impossible to analyze the data with respect to predisposing risk factors for SSI. Secondly, these data were obtained from a single large academic center. A large, multicenter study should be conducted to examine whether these dSSI trends are consistent across different hospital systems and regions. Lastly, this study did not correlate dSSI rate with environmental factors, such as ambient temperature or humidity.
In conclusion, this study demonstrated a statistically significant decrease in dSSI rate between January 2009 and August 2018. During this time period, the SSI rate was significantly greater in the summer than in the winter. Finally, this study supports previous investigations showing that the “July effect” is not a significant contributing factor to SSI rate. Other causes of variability, such as humidity, temperature, and prevalence of infectious organisms, should be examined more closely.
Supplementary material
To view supplementary material for this article, please visit https://doi.org/10.1017/ice.2019.301
Acknowledgments
None.
Financial support
No financial support was provided relevant to this article.
Conflicts of interest
All authors report no conflicts of interest relevant to this article.