


1. Introduction
A turbulent boundary layer (TBL) plays a significant role in many engineering applications and atmospheric science. For example, a flow passing through a vehicle can affect the efficiency of the vehicle; the atmospheric TBL is very important for weather prediction. Many recent works show that there exists a thin layer with a finite thickness that separates the turbulent and non-turbulent flows in many turbulent flows, e.g. jet, mixing layer and boundary layer (da Silva et al. Reference da Silva, Hunt, Eames and Westerweel2014). This thin layer is called the turbulent/non-turbulent interface (TNTI), whose existence was pointed out by Prandtl (Reference Prandtl1928) and examined by Corrsin & Kistler (Reference Corrsin and Kistler1955).
With the improvement of experimental technologies and computational resources in recent years, the TNTI layer has been investigated in free shear flows (da Silva & Pereira Reference da Silva and Pereira2008; Westerweel et al. Reference Westerweel, Fukushima, Pedersen and Hunt2009; Watanabe et al. Reference Watanabe, Sakai, Nagata, Ito and Hayase2015) and TBLs (de Silva et al. Reference de Silva, Philip, Chauhan, Meneveau and Marusic2013, Reference de Silva, Philip, Hutchins and Marusic2017; Chauhan et al. Reference Chauhan, Philip, de Silva, Hutchins and Marusic2014b; Philip et al. Reference Philip, Meneveau, de Silva and Marusic2014; Ishihara, Ogasawara & Hunt Reference Ishihara, Ogasawara and Hunt2015; Borrell & Jiménez Reference Borrell and Jiménez2016; Lee, Sung & Zaki Reference Lee, Sung and Zaki2017; Zhang, Watanabe & Nagata Reference Zhang, Watanabe and Nagata2018; Jahanbakhshi Reference Jahanbakhshi2021). The TNTI layer consists of two sublayers: the outer part bounded to the irrotational flow is called the viscous superlayer (VSL), where viscous effects dominate the increase of vorticity magnitude; the turbulent sublayer (TSL), where the inviscid effects become important, exists as a buffer layer between the VSL and the turbulent core region (da Silva et al. Reference da Silva, Hunt, Eames and Westerweel2014). Since the TNTI layer separates the turbulent and non-turbulent flow regions, the flow properties in these two regions are highly different. This layer is significant for the exchanges of substance, energy and heat between turbulent and non-turbulent flow, and is related to the development of turbulence (Holzner & Lüthi Reference Holzner and Lüthi2011). The Reynolds number dependence is one of the most important issues in the study of the TNTI layer; it represents the essential properties of the TNTI layer, and contributes to the understanding of flow behaviour near here, and is related to the scaling of the entrainment, which causes the development of the turbulent region (van Reeuwijk, Vassilicos & Craske Reference van Reeuwijk, Vassilicos and Craske2021). That can also consequently provide useful information for the modelling and flow control of turbulence as the entrainment is considered caused by the vorticity structures within the TNTI layer (Watanabe et al. Reference Watanabe, Jaulino, Taveira, da Silva, Nagata and Sakai2017a; Neamtu-Halic et al. Reference Neamtu-Halic, Krug, Mollicone, Van Reeuwijk, Haller and Holzner2020).
In previous literature, the scaling of the mean thickness of the TNTI layer  $\delta _{TNTI}$ has been argued about extensively. This mean thickness was first measured by Bisset, Hunt & Rogers (Reference Bisset, Hunt and Rogers2002) in turbulent wakes and shown to be approximately one order of the Taylor microscale
 $\lambda$. Other studies also suggested that
 $\delta _{TNTI}$ is of the same order as the Taylor microscale
 $\lambda$ in the mixing layer (Attili, Cristancho & Bisetti Reference Attili, Cristancho and Bisetti2014), jet (Westerweel et al. Reference Westerweel, Fukushima, Pedersen and Hunt2009) and boundary layer (Chauhan, Philip & Marusic Reference Chauhan, Philip and Marusic2014a; Borrell & Jiménez Reference Borrell and Jiménez2016). In contrast, other studies showed that
 $\delta _{TNTI}$ is scaled by the Kolmogorov scale
 $\eta =\nu ^{3/4}\langle \varepsilon \rangle ^{-1/4}$ in the jet (Nagata, Watanabe & Nagata Reference Nagata, Watanabe and Nagata2018; Silva, Zecchetto & da Silva Reference Silva, Zecchetto and da Silva2018), shear-free turbulence (Holzner et al. Reference Holzner, Liberzon, Nikitin, Kinzelbach and Tsinober2007; Silva et al. Reference Silva, Zecchetto and da Silva2018) and mixing layer (Watanabe et al. Reference Watanabe, Sakai, Nagata, Ito and Hayase2015), where
 $\langle \varepsilon \rangle$ is the turbulent kinetic energy dissipation rate, and
 $\nu$ is the kinematic viscosity. Also, Jahanbakhshi (Reference Jahanbakhshi2021) suggested that the VSL is scaled by
 $\eta$ in the TBL. Silva et al. (Reference Silva, Zecchetto and da Silva2018) summarized most of the recent studies and investigated systematically the scaling of
 $\delta _{TNTI}$ in the planar jet and shear-free turbulence. They showed that
 $\delta _{TNTI}/\lambda$ decreases as the Reynolds number increases, while
 $\delta _{TNTI}/\eta$ is independent of the Reynolds number except for very low Reynolds numbers. However, the scaling of
 $\delta _{TNTI}$ is still an open question, especially in the TBL, where the TNTI layer is less studied compared with free shear flows.
Other turbulent statistics near and within the TNTI layer in the TBL also need to be investigated, e.g. turbulent kinetic energy, vorticity and strain distribution, and shear effects. How these statistics vary with the Reynolds number is also an important issue. In particular, the mean shear effect is an important issue for scaling the mean thickness of the TNTI layer. Hunt et al. (Reference Hunt, Eames, Westerweel, Davidson, Voropayev, Fernando and Braza2010) used the Burgers vortex model to explain the scaling of  $\delta _{TNTI}$, which is expected to be
 $\delta _{TNTI} \sim \lambda$ under the strong influence of mean shear, and
 $\delta _{TNTI} \sim \eta$ without shear. Even though Watanabe et al. (Reference Watanabe, da Silva, Nagata and Sakai2017c) showed that the mean thickness of the TNTI layer is the same in turbulent planar jets and shear-free turbulence, the mean shear effect still needs to be investigated more carefully in TBLs because the degree of mean shear effects can be flow-dependent.
The geometry of the TNTI is also important because it is related the entrainment rate, which depends on the surface area of the TNTI (Holzner & Lüthi Reference Holzner and Lüthi2011). The geometry of the TNTI is dependent on the turbulent structures under the TNTI, which can be flow-dependent and may affect the universality of the geometry of the TNTI layer. The TNTI has a complex shape and exhibits fractal-like properties, as shown in the previous studies (da Silva et al. Reference da Silva, Hunt, Eames and Westerweel2014). But it is still unclear if the interface geometry has universal statistical properties that do not depend on flows and Reynolds numbers (da Silva et al. Reference da Silva, Hunt, Eames and Westerweel2014). The entrainment is understood as a process by which an irrotational fluid becomes a part of the turbulent flow while it passes across the TNTI layer. The irrotational fluid becomes turbulent near the TNTI layer by the viscous diffusion of vorticity (Holzner & Lüthi Reference Holzner and Lüthi2011; Mistry et al. Reference Mistry, Philip, Dawson and Marusic2016), which is called local entrainment. Therefore, the viscous effects are important for the local entrainment rate, which represents the volume of entrained fluid per unit interface area and per time. In recent studies (da Silva et al. Reference da Silva, Hunt, Eames and Westerweel2014), the nibbling process (local entrainment) is also shown to be the main contributor to the entrainment process in the TBL, and the intense vortex structures (worms) close to the TNTI are dominant in the nearby entrainment velocity. In addition, the total entrainment rate can be evaluated as an integral of the local entrainment velocity over the interface. The total entrainment rate depends strongly on the surface area of the interface, which is also influenced by large-scale motions of the flow. Even some existing studies (Watanabe et al. Reference Watanabe, Sakai, Nagata, Ito and Hayase2015; Nagata et al. Reference Nagata, Watanabe and Nagata2018) show that the entrainment velocity  $v_n$ is the order of the Kolmogorov velocity scale
 $v_{\eta }$ in shear-free flows. However, the entrainment is a multiscale process, which means that the large-scale motions are also involved (Mistry et al. Reference Mistry, Philip, Dawson and Marusic2016). Some recent studies showed that the large-scale motions do modulate the entrainment velocity in the TBL (Long, Wang & Pan Reference Long, Wang and Pan2022) and jet (Cimarelli & Boga Reference Cimarelli and Boga2021). Furthermore, the large-scale motions are shown to dominate the mass and energy transport in the outer region (Adrian, Meinhart & Tomkins Reference Adrian, Meinhart and Tomkins2000) in TBL.
There are several previous studies on the Reynolds number dependence of the TNTI layer in the TBL: Chauhan et al. (Reference Chauhan, Philip and Marusic2014a) used the experimental data ( $Re_{\tau } = u_{\tau }\delta _{\nu }/\nu = 1230$–
 $14\,500$) to study the Reynolds number dependence of the TNTI layer in the TBL. However, the TNTI layer in this study is detected with velocity, where the TNTI layer is treated as a shear layer. Since the seminal work on the TNTI by Corrsin & Kistler (Reference Corrsin and Kistler1955), it has been known that the TNTI is not well-defined in the profiles of velocity or kinetic energy. As Corrsin & Kistler (Reference Corrsin and Kistler1955) pointed out, rotational motion is the essential feature of the turbulent flow region, and the TNTI is well-defined only with the quantities related to vorticity. Therefore, Corrsin & Kistler (Reference Corrsin and Kistler1955) had to apply a complicated post-process on velocity signals obtained with hot-wire anemometry to detect turbulent regions because the velocity or kinetic energy could not distinguish the turbulent and non-turbulent regions well. They define the detector function of the TNTI with a time derivative of velocity, which is related to a velocity gradient. Therefore, their detection method of the TNTI is closer to the vorticity criterion than the kinetic energy criterion. The interfaces defined with enstrophy and kinetic energy were compared in temporally evolving TBLs in Watanabe, Zhang & Nagata (Reference Watanabe, Zhang and Nagata2018b). It was found that the interfaces detected with these quantities are very different in terms of both geometry and location. Small-scale structures are missing on some parts of the interface detected with kinetic energy (Watanabe et al. Reference Watanabe, Zhang and Nagata2018b). The conditional statistics calculated for the interfaces of enstrophy and kinetic energy were also different, except for low-order statistics of velocity, such as mean velocity and velocity variance. This may be because the pressure diffusion at large scales transfers the kinetic energy from the turbulent to the non-turbulent region, while the pressure term does not appear in the enstrophy transport equation. Borrell & Jiménez (Reference Borrell and Jiménez2016) have studied the TNTI detected with vorticity using the direct numerical simulations (DNS) database of the TBL. However, the Reynolds number range is still limited for
 $Re_{\theta } = U_{W}\theta /\nu = 2800$–
 $6800$ (
 $Re_{\tau }=1000$–
 $2000$) based on the momentum thickness
 $\theta =\int _0^{\infty } \langle u\rangle (U_{W}-\langle u\rangle )/U_{W}^{2}\, {{\rm d}y}$. These values of
 $Re_\theta$ are in the transitional range of low to moderate Reynolds number, and the scale range of turbulent motions is still small, so some typical phenomena in TBL are not obvious yet. The higher Reynolds number is necessary for examining the Reynolds number dependence.
The Reynolds number dependence of the TNTI layer is a significant topic in TNTI studies. However, this investigation still lacks information, especially for the TBL. If DNS are used for studying the TNTI layer in the TBL, then the resolution near the TNTI layer needs to be considered carefully because the smallest length scale of turbulence is different between the outer and near-wall regions, where the resolution determined based on the near-wall region can be insufficient for studying the TNTI layer (Watanabe et al. Reference Watanabe, Zhang and Nagata2018b; Zhang et al. Reference Zhang, Watanabe and Nagata2018). In addition, the wall can have a strong influence on the TNTI layer in the TBL (Lee et al. Reference Lee, Sung and Zaki2017), but this influence has not been studied well in previous papers.
In this study, we conduct DNS of temporally developing incompressible TBLs for a wide range of Reynolds numbers  $Re_{\theta }=2000$–
 $13\,000$ (
 $Re_{\tau }=700$–
 $4000$). The spatial resolution of the DNS is determined carefully such that the smallest scale of turbulent motions is well resolved near the TNTI layer. The detail of the DNS database is presented in § 2. Section 3 discusses the Reynolds number dependence of the TNTI layer as well as the mean shear effects on the TNTI layer, the geometrical properties of the TNTI layer, and the entrainment process. Finally, § 4 presents the conclusion of this study.
2. The DNS of temporally developing turbulent boundary layers
2.1. Temporally developing turbulent boundary layers
A DNS database of incompressible temporally developing TBLs (Watanabe, Zhang & Nagata Reference Watanabe, Zhang and Nagata2019b) is used in this study. A temporally evolving TBL is proposed by assuming that the boundary layer grows so slowly in the streamwise direction that the turbulence can be treated as approximately homogeneous in this direction (Spalart Reference Spalart1988). This idea has been adapted to various canonical turbulent shear flows, e.g. TBLs (Martín Reference Martín2007; Guarini et al. Reference Guarini, Moser, Shariff and Wray2000; Kozul, Chung & Monty Reference Kozul, Chung and Monty2016), mixing layers (Vreman, Sandham & Luo Reference Vreman, Sandham and Luo1996; Watanabe et al. Reference Watanabe, Sakai, Nagata, Ito and Hayase2015) and jets (Hawkes et al. Reference Hawkes, Sankaran, Sutherland and Chen2007; Nagata et al. Reference Nagata, Watanabe and Nagata2018; Silva et al. Reference Silva, Zecchetto and da Silva2018). These studies have proved that the transverse profile of most statistics is consistent between spatially and temporally evolving flows. The temporally evolving TBL may be called a turbulent Rayleigh shear flow, which is equivalent to a spatially evolving TBL at infinite Reynolds number (Crow Reference Crow1968). Although the temporal and spatial TBLs are different in a strict sense at a finite Reynolds number, the vertical profiles of most statistics become asymptotically equivalent in these flows at a sufficiently large Reynolds number ( $Re_{\theta } \gtrapprox 2000$) when the Reynolds number based on the diameter of a trip wire
 $D$, applied in the initial condition, is
 $Re_D=2000$ (Kozul et al. Reference Kozul, Chung and Monty2016; Zhang et al. Reference Zhang, Watanabe and Nagata2018). These studies also suggest that the mean shear effect caused by the transverse inhomogeneity is well captured by numerical simulations of temporally evolving TBLs.
The purpose of this study is to investigate the TNTI in wall-bounded shear flows for a wide range of Reynolds numbers, which is discussed by comparison with previous studies on the TNTI in turbulent free shear flows. The computational cost is much lower for temporally evolving flows than spatially evolving ones for the same Reynolds number. Therefore, the temporal TBL is an appropriate choice because a higher Reynolds number can be achieved by temporal simulations for a given computational resource. The governing equations are the three-dimensional incompressible Navier–Stokes equations, which can be expressed as
 \begin{gather} \frac{\partial u_{j}}{\partial x_{j}} =0, \end{gather}
 \begin{gather}\frac{\partial u_{i}}{\partial t}+\frac{\partial u_{i}u_{j}}{\partial x_{j}} ={-}\frac{1}{\rho}\, \frac{\partial p}{\partial x_{i}} +\nu\,\frac{\partial^{2} u_{i}}{\partial x_{j}\,\partial x_{j}}. \end{gather}
Here,  $u_i$ is the instantaneous velocity in the i direction; the subscripts
 $i,j=1, 2, 3$ indicate the
 $x$,
 $y$ and
 $z$ directions, respectively;
 $\rho$ is the constant fluid density; and
 $p$ is the instantaneous pressure. The velocity components in the
 $x$,
 $y$ and
 $z$ directions are denoted by
 $u$,
 $v$ and
 $w$, respectively. We consider the TBL developing on a wall moving at a constant speed
 $U_W$, where the subscript
 $W$ refers to a value on the wall. The temporal simulation uses periodic boundary conditions in the streamwise (
 $x$) and spanwise (
 $z$) directions, and the statistics do not vary in the streamwise direction. The wall-normal direction is denoted by
 $y$. A no-slip condition is used on the wall (
 $y=0$), and a slip condition is applied at the top of the computational domain. Spatial averages denoted by
 $\langle \cdot \rangle$ taken on an
 $x$–
 $z$ plane are obtained as functions of
 $y$ and time. Hereafter, the fluctuation from this average is denoted as
 $f'=f-\langle f \rangle$.
The initial mean streamwise velocity profile approximates the velocity induced by a trip wire with diameter  $D$ installed on the wall (Kozul et al. Reference Kozul, Chung and Monty2016):
 \begin{equation} \langle u \rangle=\frac{U_W}{2}+\frac{U_W}{2} \tanh \left[\frac{D}{2\theta_{sl}} \left( 1-\frac{y}{D} \right ) \right], \end{equation}
with the initial shear layer thickness  $\theta _{sl}=0.03D$, while the mean velocity in other directions is 0. Velocity fluctuations with root mean square (r.m.s.) value
 $0.05U_W$ are also added in the near-wall region of
 $y \leq D$. In this study, the flow is characterized by the Reynolds number based on the trip wire diameter
 $Re_{D}=U_{W}D/\nu =2000$, which is large enough for turbulent transition to occur (Kozul et al. Reference Kozul, Chung and Monty2016).
2.2. Computational parameters
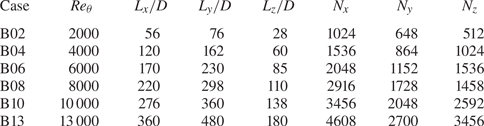
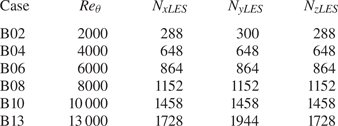
The DNS are performed with six different Reynolds numbers, as summarized in table 1, which also shows the size of the computational domain  $(L_x, L_y, L_z)$ and the number of grid points (
 $N_x, N_y, N_z$). In each simulation, time is advanced until
 $Re_{\theta }$ reaches the value shown in the table. Table 2 summarizes the Reynolds numbers
 $Re_{\delta }=U_W\delta /\nu$ and
 $Re_{\tau }=u_{\tau }\delta _{\nu }/\nu$, the computational domain size divided by
 $\delta$, and the grid size normalized by the viscous length scale
 $\delta _{\nu }$ or the Kolmogorov scale
 $\eta$ at the end of the DNS. Here,
 $u_{\tau } = \sqrt {\tau _{W}/\rho }$ is the friction velocity,
 $\tau _{W}=-\rho \nu (\partial \langle u\rangle /\partial y)_W$ is the wall shear stress, and the viscous length scale is defined as
 $\delta _{\nu }=\nu /u_{\tau }$. The superscript
 $+$ denotes a quantity normalized by the wall unit. The Kolmogorov scale
 $\eta$ and
 $\varDelta _y$ are taken at
 $y/\delta =0.35$ (where
 $\delta$ is 99 % boundary layer thickness based on the mean velocity profile). The computational domain
 $(L_x, L_y, L_z)$ in table 1 is determined such that the conditions
 $L_{x}\geq 2{\rm \pi} \delta$,
 $L_{y} > \delta$ and
 $L_{z}\geq {\rm \pi}\delta$ are satisfied as in previous studies (Schlatter & Örlü Reference Schlatter and Örlü2010; Lozano-Durán & Jiménez Reference Lozano-Durán and Jiménez2014; Kozul et al. Reference Kozul, Chung and Monty2016). The number of the grid points is determined based on the grid size
 $\varDelta _i$ compared with the length scale both near the wall
 $\delta _\nu$ and in turbulence
 $\eta$ (
 $y/\delta =0.5$). The uniform grid spacing is applied in the
 $x$ and
 $z$ directions, while the vertical location of the grid points is determined by the mapping function as employed in Zhang et al. (Reference Zhang, Watanabe and Nagata2018) and Watanabe et al. (Reference Watanabe, Zhang and Nagata2018b), where the grid size becomes smaller near the wall. The present DNS satisfy
 $\varDelta _{i}\leq 1.5\eta$ at
 $y/\delta =0.5$ because the present study investigates the TNTI layer that appears in the outer region. So
 $\varDelta _i^{+}$ is smaller than the grid size widely used in DNS of wall turbulence (
 $\varDelta _{x}^{+}<9.7$,
 $\varDelta _{y}^{+}<0.2$ and
 $\varDelta _{z}^{+}<4.8$; Moser, Kim & Mansour Reference Moser, Kim and Mansour1999), especially for the
 $x$ direction. The grid size in the present DNS is small enough to study the TNTI layer in the TBL, and further discussion on the effects of spatial resolution on the TNTI in the TBL can be found in our previous studies (Watanabe et al. Reference Watanabe, Zhang and Nagata2018b; Zhang et al. Reference Zhang, Watanabe and Nagata2018).
Computational parameters of the DNS of a temporally developing TBL.

Reynolds numbers, computational domain size divided by  $\delta$, and grid size normalized by the viscous length scale
 $\delta _\nu$ or Kolmogorov scale
 $\eta$ at the end of the DNS. Here,
 $\varDelta _y^+$ and
 $\varDelta _i/\eta$ are taken on the wall and at
 $y/\delta =0.5$, respectively.

The present DNS are initialized with an implicit large eddy simulation (ILES); the computational parameters of ILES used for initialization and the numerical methods are shown in Appendix A. Furthermore, Appendix B examines the effects of the computational domain size, and shows that the main results presented in this paper are not influenced by the finite domain size used in the present study.
2.3. Comparisons of statistics with experiment and spatial DNS studies
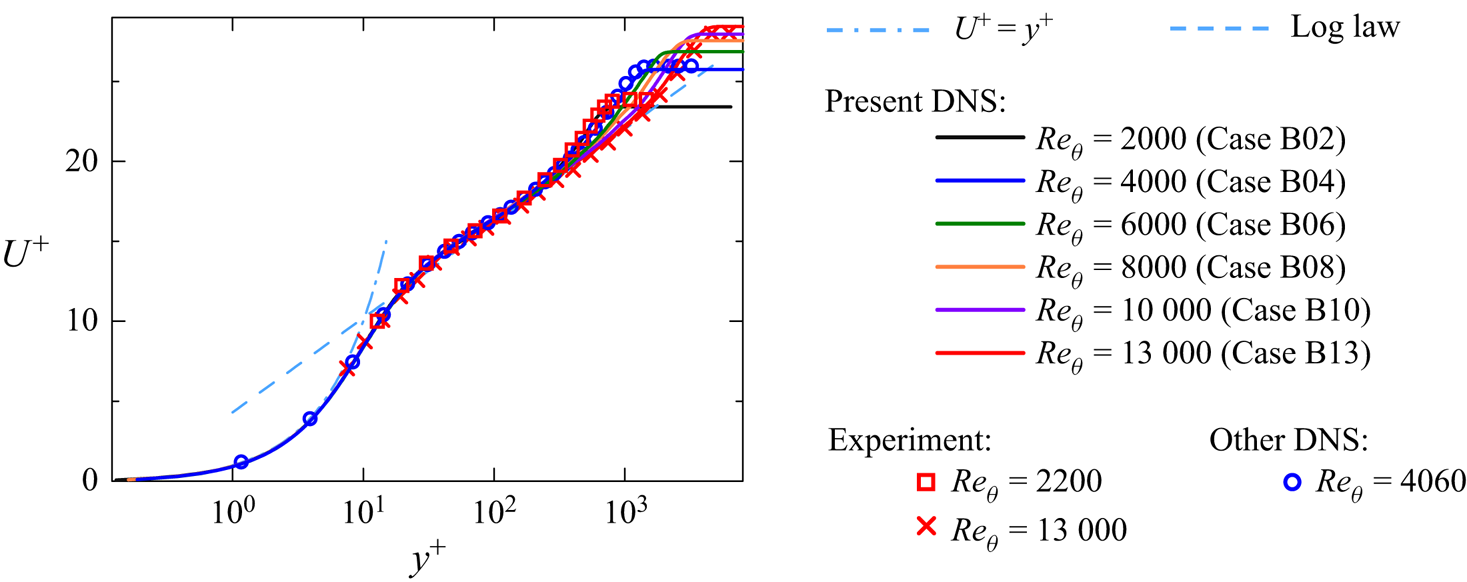
The present DNS results are validated by comparing the statistics with experiments at similar  $Re_\theta$ and theoretical laws. Figure 1 shows the mean streamwise velocity
 $U^+=\langle u \rangle / u_{\tau }$, which is compared with the experimental data for
 $Re_{\theta } = 2200$ (Erm & Joubert Reference Erm and Joubert1991),
 $Re_{\theta } = 13\,000$ (De Graaff & Eaton Reference De Graaff and Eaton2000), and previous spatial DNS data for
 $Re_\theta = 4060$ (Schlatter & Örlü Reference Schlatter and Örlü2012). Here, all quantities in the plots are normalized with the viscous scales. Present DNS results follow
 $U^+ = y^+$ for small
 $y^+$ (
 $y^+ \lesssim 5$), and the results start to follow the log law for larger
 $y^+$. We can also see that
 $U^+$ in the experiments is similar to the present DNS data at
 $Re_{\theta } = 2000$ and
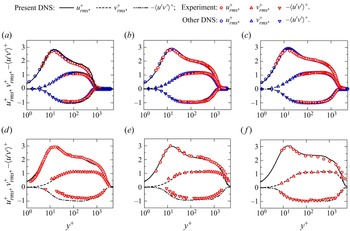
 $Re_{\theta } = 13\,000$. Figure 2 shows the r.m.s. of streamwise and vertical velocity fluctuations (
 $u_{rms}=\sqrt {\langle u'^2\rangle }$ and
 $v_{rms}=\sqrt {\langle v'^2\rangle }$) and Reynolds stress
 $\langle u'v'\rangle$ at the end of the DNS in comparison with experimental studies (Osaka et al. Reference Osaka, Kameda and Mochizuki1998; De Graaff & Eaton Reference De Graaff and Eaton2000; Carlier & Stanislas Reference Carlier and Stanislas2005) and previous spatial DNS studies (Schlatter & Örlü Reference Schlatter and Örlü2012; Sillero et al. Reference Sillero, Jiménez and Moser2013). It should be noticed that only
 $Re_{\theta }=2000$–
 $6000$ are compared with the previous DNS due to the lack of DNS data for the higher Reynolds number range. For all Reynolds numbers, the DNS results agree well with experimental data and spatial DNS data with a comparable value of
 $Re_\theta$, and the present DNS well capture the Reynolds number dependence of the TBL. Reynolds number dependence of other quantities, e.g. skin friction, spectral shape, and skewness and flatness of velocity derivative, was further compared with experiments and DNS in Watanabe et al. (Reference Watanabe, Zhang and Nagata2019b), where the present DNS results were shown to agree well with previous studies of the TBL.
The mean profiles of streamwise velocity  $U^+$ compared with experimental results with
 $Re_\theta = 2200$ (
 $Re_\tau = 810$; Erm & Joubert Reference Erm and Joubert1991) and
 $Re_\theta = 13\,000$ (
 $Re_\tau = 4336$; De Graaff & Eaton Reference De Graaff and Eaton2000), and previous spatial DNS results
 $Re_\theta = 4060$ (
 $Re_\tau = 1271$; Schlatter & Örlü Reference Schlatter and Örlü2012). The dashed line represents the log law
 $U^+=(1/k) \ln y^++A$ (Pope Reference Pope2000) with the constants
 $k=0.39$ and
 $A=4.3$ (Marusic et al. Reference Marusic, Monty, Hultmark and Smits2013).

Vertical profiles of r.m.s. values of streamwise and vertical velocity fluctuations and Reynolds stress in cases (a) B02 ( $Re_\theta = 2000$), (b) B04 (
 $Re_\theta = 4000$), (c) B06 (
 $Re_\theta = 6000$), (d) B08 (
 $Re_\theta = 8000$), (e) B10 (
 $Re_\theta = 10\,000$), and (f) B13 (
 $Re_\theta = 13\,000$). The DNS results are compared with: experimental results (a)
 $Re_\theta = 2100$ (Osaka, Kameda & Mochizuki Reference Osaka, Kameda and Mochizuki1998), (b)
 $Re_\theta = 4400$ (Osaka et al. Reference Osaka, Kameda and Mochizuki1998), (c)
 $Re_\theta = 6040$ (Osaka et al. Reference Osaka, Kameda and Mochizuki1998), (d)
 $Re_\theta = 8100$ (
 $Re_\tau = 2500$; Carlier & Stanislas Reference Carlier and Stanislas2005), (e)
 $Re_\theta = 11\,500$ (
 $Re_\tau = 4000$; Carlier & Stanislas Reference Carlier and Stanislas2005), (f)
 $Re_\theta = 13\,000$ (
 $Re_\tau = 4336$; De Graaff & Eaton Reference De Graaff and Eaton2000); and previous spatial DNS results (a)
 $Re_\theta = 1986$ (
 $Re_\tau = 671$; Schlatter & Örlü Reference Schlatter and Örlü2012), (b)
 $Re_\theta = 2000$ (
 $Re_\tau = 1271$; Schlatter & Örlü Reference Schlatter and Örlü2012), (c)
 $Re_\theta = 4000$ (
 $Re_\tau = 1848$; Sillero, Jiménez & Moser Reference Sillero, Jiménez and Moser2013), at similar Reynolds numbers.

3. Results and discussions
3.1. Detection of the TNTI layer
Following previous studies (da Silva et al. Reference da Silva, Hunt, Eames and Westerweel2014), an isosurface of vorticity magnitude  $\omega =\omega _{th}$ is used to detect the outer edge of the TNTI layer, which is called the irrotational boundary (Watanabe et al. Reference Watanabe, Sakai, Nagata, Ito and Hayase2015). Obviously, the location of the isosurface changes with the threshold value
 $\omega _{th}$. In this method, a fluid point with
 $\omega >\omega _{th}$ is denoted as a turbulent fluid point, while a non-turbulent fluid point has
 $\omega <\omega _{th}$. For determining an appropriate value of
 $\omega _{th}$ for studying the TNTI layer, the volume of the turbulent region
 $V_T$ is computed as a function of
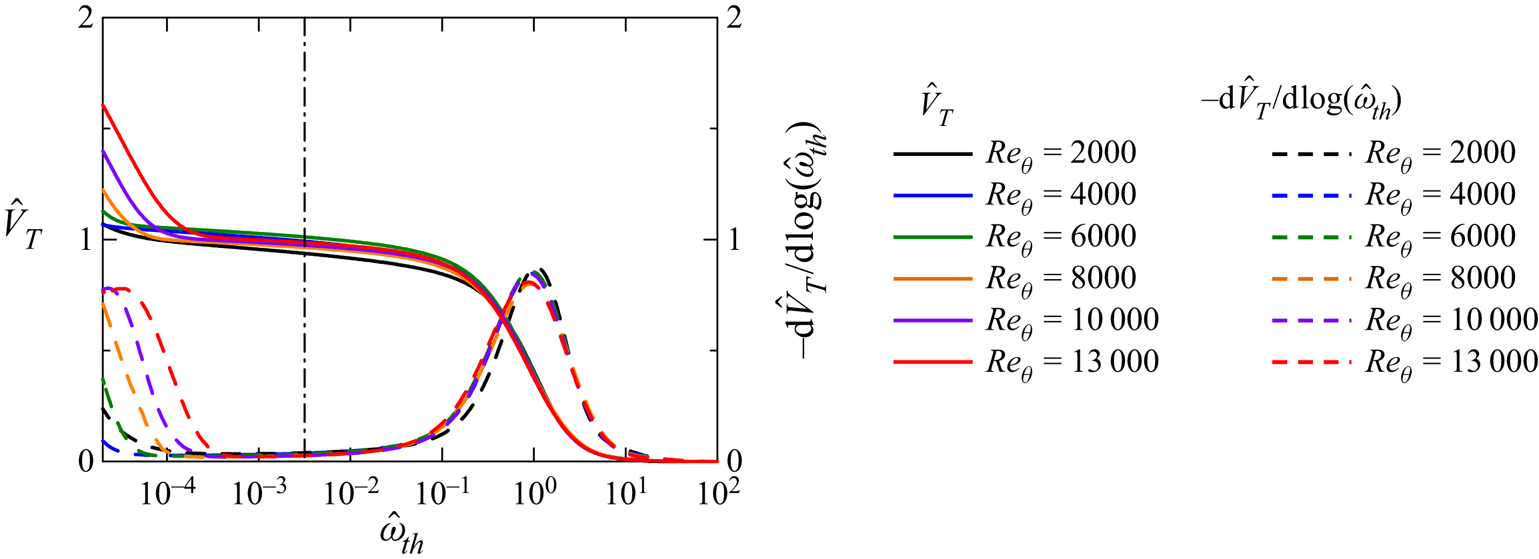
 $\omega _{th}$, as shown in figure 3. The threshold
 $\omega _{th}$ shown in the figure is normalized as
 $\hat {\omega }_{th}=\omega _{th}/\langle \omega \rangle _c$, where the subscript
 $c$ denotes the value taken at
 $y=0.5\delta$, which is located in the turbulent core region. The volume of the turbulent region is also normalized, as
 $\hat {V}_T=V_T/(L_xL_z\delta )$. Figure 3 also shows the derivative of
 $\hat {V}_T$,
 ${\rm d}\hat {V}_T/{\rm d}\log (\hat {\omega }_{th})$. The profile of
 $\hat {V}_T$ is similar to profiles obtained in previous studies (da Silva et al. Reference da Silva, Hunt, Eames and Westerweel2014; Jahanbakhshi, Vaghefi & Madnia Reference Jahanbakhshi, Vaghefi and Madnia2015; Watanabe et al. Reference Watanabe, Sakai, Nagata, Ito and Hayase2015). The turbulent volume largely increases for
 $\hat {\omega }_{th}<10^{-4}$ as
 $\hat {\omega }_{th}$ decreases, because the non-turbulent region has very small vorticity magnitude, which is often associated with the numerical error. On the other hand,
 $\hat {V}_T$ hardly changes within the range
 $10^{-3} < \hat {\omega }_{th} < 10^{-2}$, which indicates that the location of the isosurface
 $\omega =\omega _{th}$ hardly changes with
 $\omega _{th}$ within this range. In the present study,
 $\hat {\omega }_{th}=10^{-2.5}$ shown as a vertical dot-dash line in figure 3 is used to detect the irrotational boundary.
The normalized turbulent volume  $\hat {V}_T$ plotted against the normalized threshold
 $\hat {\omega }_{th}$ used for detecting turbulent fluids. Here,
 ${\rm d}\hat {V}_T/{\rm d}\log (\hat {\omega }_{th})$ is also plotted, with dashed lines. A vertical dot-dash line indicates the threshold value used in this study to detect the irrotational boundary.

This method based on the threshold dependence of the turbulent volume has been used widely for choosing the isosurface value for studying the TNTI layer (Taveira et al. Reference Taveira, Diogo, Lopes and da Silva2013; Jahanbakhshi et al. Reference Jahanbakhshi, Vaghefi and Madnia2015). Statistics near the TNTI layer are often computed as functions of the distance from the isosurface  $\omega =\omega _{th}$ (Bisset et al. Reference Bisset, Hunt and Rogers2002). Previous studies have shown that the statistics near the TNTI layer hardly change with a small change of
 $\omega _{th}$ if
 $\omega _{th}$ is chosen based on the
 $\omega _{th}$ dependence of the turbulent volume (Taveira et al. Reference Taveira, Diogo, Lopes and da Silva2013; Watanabe et al. Reference Watanabe, Zhang and Nagata2018b; Watanabe, da Silva & Nagata Reference Watanabe, da Silva and Nagata2019a). We have also tested different values of
 $\omega _{th}$ within the range
 $10^{-3}<\hat {\omega }_{th}<10^{-2}$ with the present DNS database, and have found that the detected isosurface location and the statistics near the TNTI layer are insensitive to the threshold.
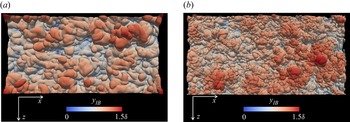
Figure 4 visualizes the irrotational boundary coloured by the height of the irrotational boundary from the wall,  $y_{IB}$, for
 $Re_{\theta }=2000$ and
 $13\,000$. The irrotational boundary in the present DNS looks very smooth and similar to those detected in free shear flows (Watanabe, Riley & Nagata Reference Watanabe, Riley and Nagata2017b; Nagata et al. Reference Nagata, Watanabe and Nagata2018), while some previous DNS of the TBL with coarser grids (
 $\varDelta _x^{+}\approx 9$) showed spiky patterns of the irrotational boundary, as discussed in Zhang et al. (Reference Zhang, Watanabe and Nagata2018) and Watanabe et al. (Reference Watanabe, Zhang and Nagata2018b). A folded shape of the irrotational boundary can be characterized by a wide range of length scales of turbulent motions that appear under the TNTI layer. Therefore, the small-scale structures appear in
 $Re_{\theta }=13\,000$ rather than in
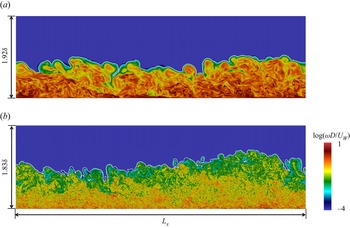
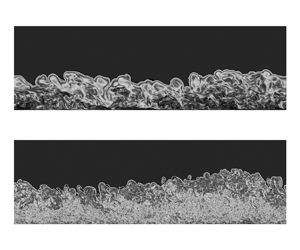
 $Re_{\theta }=2000$. Figure 5 shows a colour contour of enstrophy
 $\omega ^{2}/2$ and the irrotational boundary on an
 $x$–
 $y$ plane. The geometries of the irrotational boundary are different for
 $Re_{\theta }=2000$ and 13 000, where the irrotational boundary is more folded for higher
 $Re_{\theta }$, but flatter for lower
 $Re_{\theta }$. The mean height of the irrotational boundary is approximately
 $0.9\delta$ for all the Reynolds numbers, and the irrotational boundary appears for
 $0.4\delta \leq y \leq 1.4\delta$, which is consistent with an intermittency factor profile in spatially developing TBLs (Borrell & Jiménez Reference Borrell and Jiménez2016).
Visualization of an irrotational boundary forming at the outer edge of the TNTI layer for (a) case B02 ( $Re_\theta = 2000$), and (b) case B13 (
 $Re_\theta = 13\,000$). Colour represents the height of irrotational boundary
 $y_{IB}$.

Two-dimensional snapshots of temporally developing boundary layers on the  $x$–
 $y$ plane. The colour represents vorticity magnitude
 $\log (\omega D/U_W)$, and the irrotational boundary is visualized with the white line. The wall is moving in the
 $x$ direction (from left to right): (a) case B02 (
 $Re_\theta = 2000$), (b) case B13 (
 $Re_\theta = 13\,000$).

The TNTI layer can be studied with statistics conditioned on the distance from the irrotational boundary. The local coordinate  $y_I$ is defined so that the irrotational boundary is located at
 $y_I = 0$, and the direction of
 $y_I$ is normal to the irrotational boundary, pointing into the non-turbulent region. Here, the normal direction of the irrotational boundary can be obtained as
 $\boldsymbol {n} = -\boldsymbol {\nabla }\omega ^2/|\boldsymbol {\nabla }\omega ^2|$, and the non-turbulent and turbulent regions are represented by
 $y_I>0$ and
 $y_I<0$, respectively. The conditional statistics are obtained as functions of
 $y_I$, where samples of the statistics for
 $y_I>0$ and
 $y_I<0$ are taken only from non-turbulent and turbulent flow points, respectively, even though the local coordinate
 $y_{I}$ intersects more than one irrotational boundary point. Further details of the computation of the conditional statistics can be found in our previous papers (Nagata et al. Reference Nagata, Watanabe and Nagata2018; Watanabe et al. Reference Watanabe, Zhang and Nagata2018b, Reference Watanabe, da Silva and Nagata2019a; Zhang et al. Reference Zhang, Watanabe and Nagata2018). The average taken on the local coordinate is denoted by
 $\langle \cdot \rangle _{I}$.
3.2. Mean thickness of the TNTI layer and sublayers
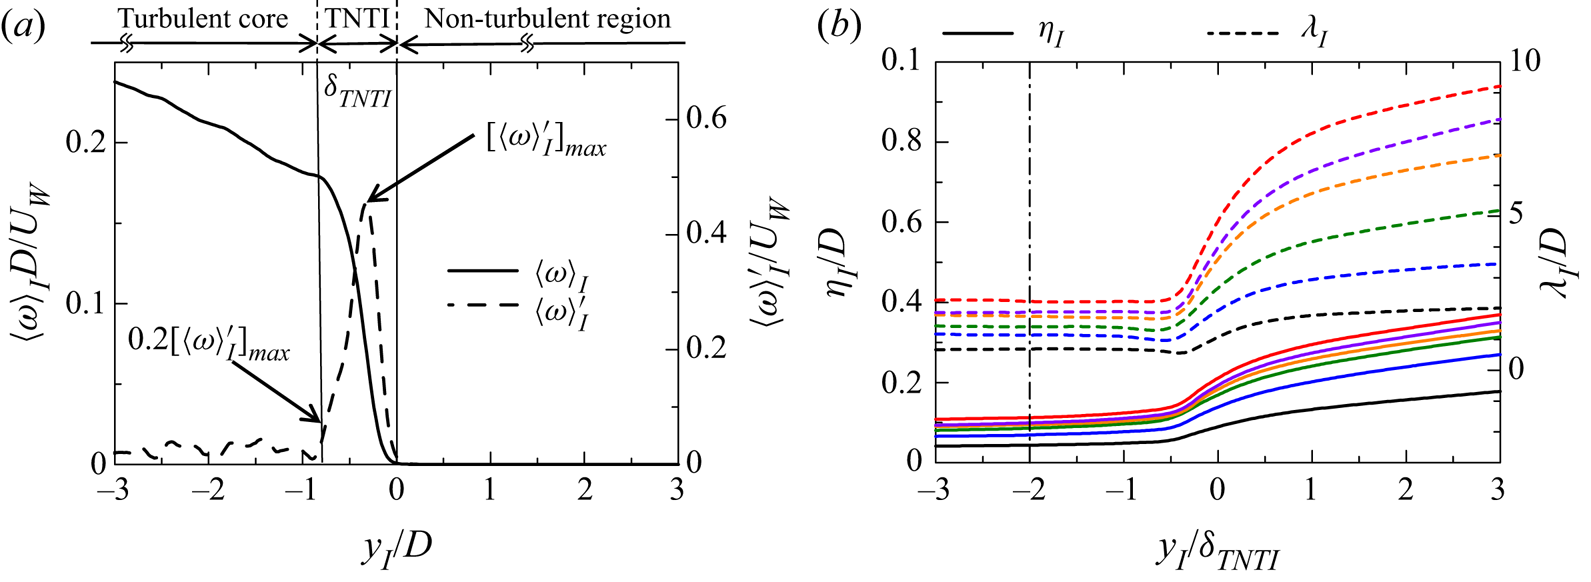
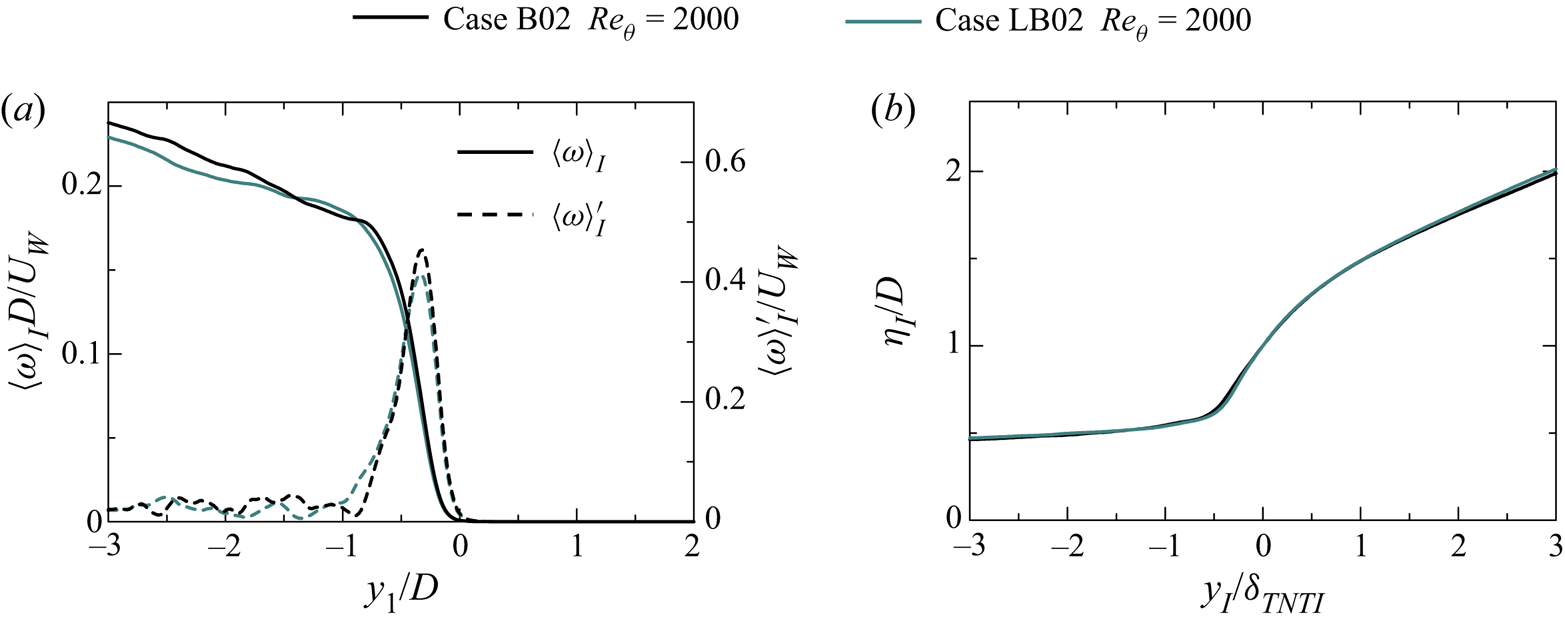
The TNTI layer can be defined as a region where the vorticity magnitude is adjusted between the turbulent and non-turbulent regions (da Silva et al. Reference da Silva, Hunt, Eames and Westerweel2014). Therefore, the TNTI layer can be characterized by a large gradient of vorticity magnitude in the TNTI normal direction. The mean thickness of the TNTI layer is quantified based on the mean vorticity magnitude  $\langle \omega \rangle _I$, as shown in figure 6(a) following our previous studies (Watanabe et al. Reference Watanabe, Riley, Nagata, Onishi and Matsuda2018a; Zhang et al. Reference Zhang, Watanabe and Nagata2018). Figure 6(a) also shows the derivative of
 $\langle \omega \rangle _I$,
 $\langle \omega \rangle '_I = -{\rm d}\langle \omega \rangle _I /{\rm d}y_I$, where the mean thickness of the TNTI layer,
 $\delta _{TNTI}$, is defined as the distance from
 $y_{I}=0$ to the location where
 $\langle \omega \rangle '_I$ reaches 20 % of its maximum value. The mean thickness of the TNTI layer was also quantified by fitting an error function to the conditional statistics in the previous study, and both methods result in a similar value of the mean thickness of the TNTI layer (Watanabe et al. Reference Watanabe, Riley, Nagata, Onishi and Matsuda2018a).
(a) Conditional mean vorticity and its derivative with respect to  $y_I$ for case B02. (b) Conditional profiles of Kolmogorov length scale
 $\eta _I$ and Taylor microscale
 $\lambda _I$ defined with conditional averages. The line colours represent the Reynolds numbers as shown in figure 3. The vertical dot-dash line shows
 $y_I/\delta _{TNTI}=-2$, where the reference scales are taken for studying the TNTI layer.

Figure 6(b) shows the conditional profiles of Kolmogorov scale defined as  $\eta _I =\nu ^{3/4} \langle \varepsilon \rangle _{I}^{-1/4}$ and Taylor microscale defined as
 $\lambda _I=\sqrt {10k_{I}/(\langle \varepsilon \rangle _{I} \nu )}$, where
 $k_{I}$ is the turbulent kinetic energy defined as
 $k_{I} = (\langle u_i^2 \rangle _{I} - \langle u_i \rangle _{I}^2)/2$. The distance from the irrotational boundary,
 $y_I$, is normalized by
 $\delta _{TNTI}$. These two scales are quite large in the non-turbulent region, then decrease rapidly from the non-turbulent region to the turbulent region, and tend to be constant in the turbulent core region. The turbulent statistics at
 $y_I/\delta _{TNTI}=-2$ shown by the vertical dot-dash line are used as reference quantities for investigating the TNTI layer. The choice
 $y_I/\delta _{TNTI}=-2$ ensures the ‘same’ distance from the TNTI layer for different Reynolds numbers. Hereafter, the subscript ‘
 $TI$’ indicates the statistics taken at this location. The corresponding turbulent Reynolds number
 $Re_{\lambda.TI}=\lambda _{TI} \sqrt {(2/3)k_{TI}}/\nu$ near the TNTI layer at
 $y_I/\delta _{TNTI}=-2$ is also calculated, and shown in table 3.
Turbulent Reynolds number  $Re_{\lambda.TI}$ of the turbulent flow near the TNTI layer at
 $y_I/\delta _{TNTI}=-2$.

The TNTI layer contains two sublayers, the viscous superlayer (VSL) and the turbulent sublayer (TSL). These inner structures of the TNTI layer can be distinguished by vorticity dynamics (van Reeuwijk & Holzner Reference van Reeuwijk and Holzner2014; Taveira & da Silva Reference Taveira and da Silva2014). The conditional averages of the production term  $\langle P_\omega \rangle _{I}$ and the viscous diffusion term
 $\langle D_\omega \rangle _{I}$ in the enstrophy transport equation can be used for identifying the VSL and TSL (Taveira & da Silva Reference Taveira and da Silva2014; Zhang et al. Reference Zhang, Watanabe and Nagata2018). The enstrophy transport equation is
 \begin{equation} \frac{{\rm D}(\omega^2/2) }{{\rm D}t} = \omega_i {\mathsf{S}}_{ij} \omega_j + \nu\, \nabla^2 (\omega^2/2) + \nu\,\boldsymbol{\nabla} \omega_i \boldsymbol{\cdot} \boldsymbol{\nabla} \omega_i. \end{equation}
The three terms on the right-hand side are the production  $\langle P_\omega \rangle _{I}$, viscous diffusion
 $\langle D_\omega \rangle _{I}$ and viscous dissipation
 $\langle \varepsilon _\omega \rangle _{I}$, respectively. The production term
 $\langle P_\omega \rangle _{I}$ and the viscous diffusion term
 $\langle D_\omega \rangle _{I}$ are almost 0 at the irrotational boundary (
 $y_I=0$), then they increase from the irrotational boundary towards the turbulent region. The mean viscous diffusion term is larger than the production term near the irrotational boundary, where the mean thickness of the VSL,
 $\delta _{VSL}$, can be identified as the region where
 $\langle D_\omega \rangle _{I} > \langle P_\omega \rangle _{I}$ near the irrotational boundary (Taveira & da Silva Reference Taveira and da Silva2014; Jahanbakhshi et al. Reference Jahanbakhshi, Vaghefi and Madnia2015; Watanabe et al. Reference Watanabe, Sakai, Nagata, Ito and Hayase2015; Zhang et al. Reference Zhang, Watanabe and Nagata2018). Then it is easy to measure the mean thickness of the TSL,
 $\delta _{TSL}$, which is considered as the buffer region between the VSL and the turbulent core region. Within the TSL, the inviscid process (production term) has a larger contribution to the increase of the enstrophy (da Silva et al. Reference da Silva, Hunt, Eames and Westerweel2014). The mean thicknesses of the TNTI layer (
 $\delta _{TNTI}$), VSL (
 $\delta _{VSL}$) and TSL (
 $\delta _{TSL}$) normalized by Kolmogorov scale
 $\eta _{TI}$ and Taylor microscale
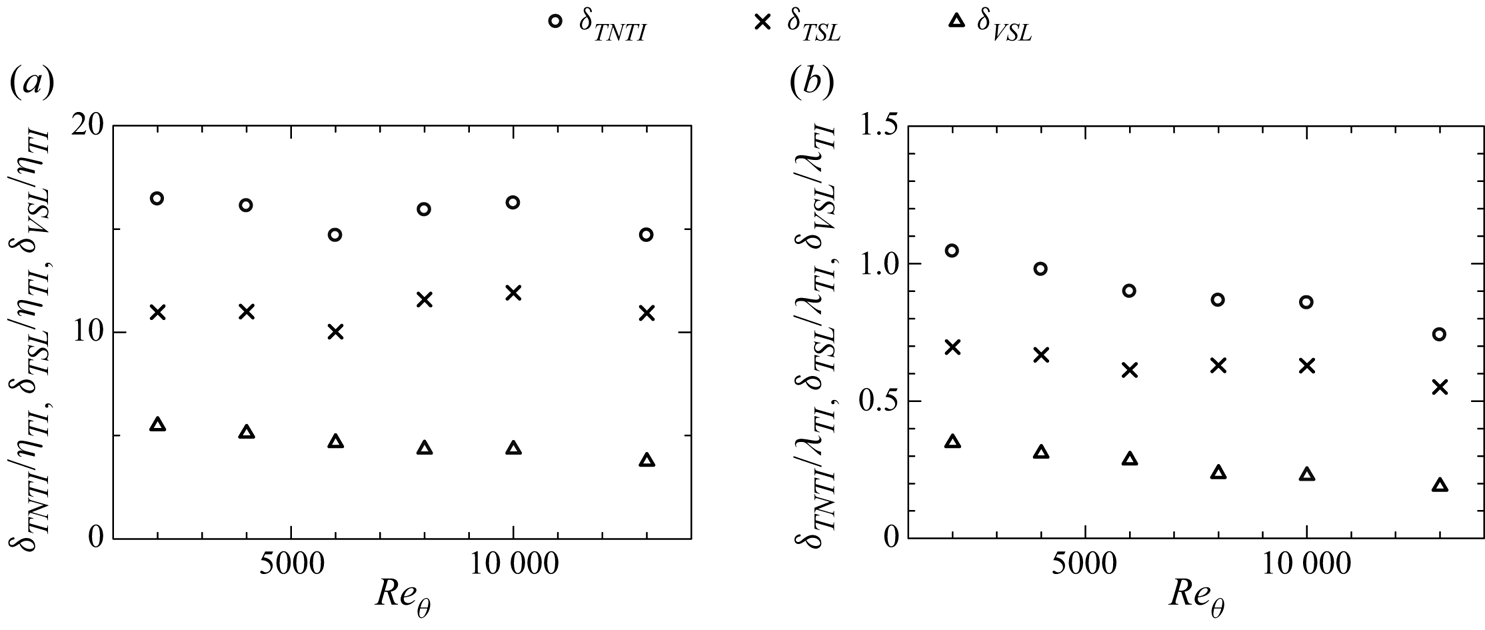
 $\lambda _{TI}$ near the TNTI layer are plotted in figures 7(a) and 7(b), respectively. From figure 7(a), we can see that the average thickness of
 $\delta _{TNTI}$ is approximately 15.7
 $\eta _{TI}$,
 $\delta _{VSL}$ is approximately 4.6
 $\eta _{TI}$, and
 $\delta _{TSL}$ is approximately 11.1
 $\eta _{TI}$ for all the Reynolds numbers. However,
 $\delta _{TNTI}/\lambda _{TI}$,
 $\delta _{TSL}/\lambda _{TI}$ and
 $\delta _{VSL}/\lambda _{TI}$ all decrease with the increase of the Reynolds number, as shown in figure 7(b). These results are consistent with a previous study (Silva et al. Reference Silva, Zecchetto and da Silva2018), in which the thickness of the TNTI layer and sublayers normalized by the Kolmogorov scale is almost constant for the different Reynolds numbers, while the thickness normalized by
 $\lambda$ decreases with
 $Re_\lambda ^{-1/2}$ in jets and shear-free turbulence. Hereafter, we assume that the mean thicknesses of the TNTI layer and VSL are approximately
 $15\eta _{TI}$ and
 $5\eta _{TI}$, for convenience. Our result is also consistent with the results from Jahanbakhshi (Reference Jahanbakhshi2021), where
 $\delta _{VSL}$ is approximately
 $5\eta$, and
 $\delta _{TNTI}$ is of the order of
 $O(10\eta )$ at
 $Re_\tau \approx 600$ in the spatial TBL.
The mean thickness of the TNTI layer, the viscous superlayer (VSL), and the turbulent sublayer (TSL) normalized by (a) Kolmogorov scale  $\eta _{TI}$, and (b) Taylor microscale
 $\lambda _{TI}$, at
 $y_I/\delta _{TNTI}=-2$.

3.3. The turbulent statistics near and within the TNTI layer
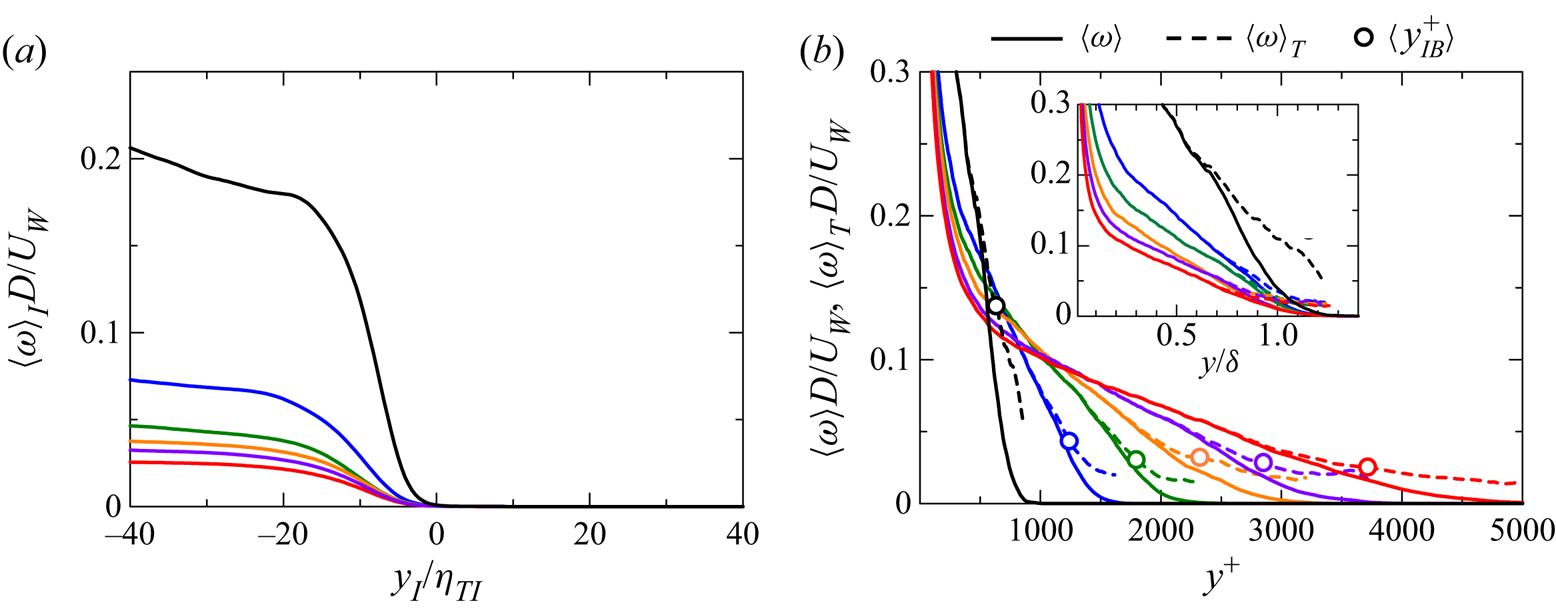
Figure 8(a) shows the conditional mean vorticity magnitude  $\langle \omega \rangle _I$ normalized by wall velocity
 $U_W$ and trip wire diameter
 $D$ with
 $y_I$ normalized by
 $\eta _{TI}$. The mean vorticity magnitude in figure 8(a) decreases with the increase of Reynolds number. In the meantime, the vertical profiles of the average of
 $\omega$ taken only from the turbulent region,
 $\langle \omega \rangle _T$, in comparison with the conventional average
 $\langle \omega \rangle$, are shown in figure 8(b). Because turbulent fluids have
 $\omega \geq \omega _{th}$,
 $\langle \omega \rangle _T$ does not decrease to 0 for large
 $y$, unlike
 $\langle \omega \rangle$, which decreases to 0 for large
 $y$. In the figure, the location of the mean irrotational boundary height is marked by circles. In the intermittent region, where
 $\langle \omega \rangle$ differs from
 $\langle \omega \rangle _T$,
 $\langle \omega \rangle _T$ tends to be independent of large
 $y^+$ at high Reynolds numbers. On the other hand,
 $\langle \omega \rangle _T$ in the intermittent region still rapidly decreases with
 $y^+$ for low Reynolds numbers. This strong dependence of
 $\langle \omega \rangle _T$ on
 $y^+$ can be seen near the wall for all Reynolds numbers. Since the ratio between
 $y$ and
 $\delta _\nu$ is small in the intermittent region at a low Reynolds number, the intermittent region can be influenced by the wall, and
 $\langle \omega \rangle _T$ in the intermittent region depends strongly on
 $y$. On the other hand, because
 $y/\delta _\nu$ in the intermittent region is large at high Reynolds numbers, the intermittent region in this case is less influenced by the strong mean shear near the wall. This results in the weak dependence of
 $\langle \omega \rangle _T$ on
 $y$ in the intermittent region.
(a) Conditional mean profile of vorticity magnitude normalized by wall velocity  $U_W$ and trip wire diameter
 $D$ plotted with respect to
 $y_I/\eta _{TI}$. (b) Vertical profiles of the mean vorticity magnitude computed only from turbulent fluids,
 $\langle \omega \rangle _T$, and the conventional average of
 $\omega$ based on the spatial average on
 $x$–
 $z$ planes,
 $\langle \omega \rangle$. The circle symbols represent the mean irrotational boundary height, and the inset shows
 $\langle \omega \rangle$,
 $\langle \omega \rangle _T$ normalized by the boundary layer thickness
 $\delta$. The line colours represent the Reynolds numbers as shown in figure 3.

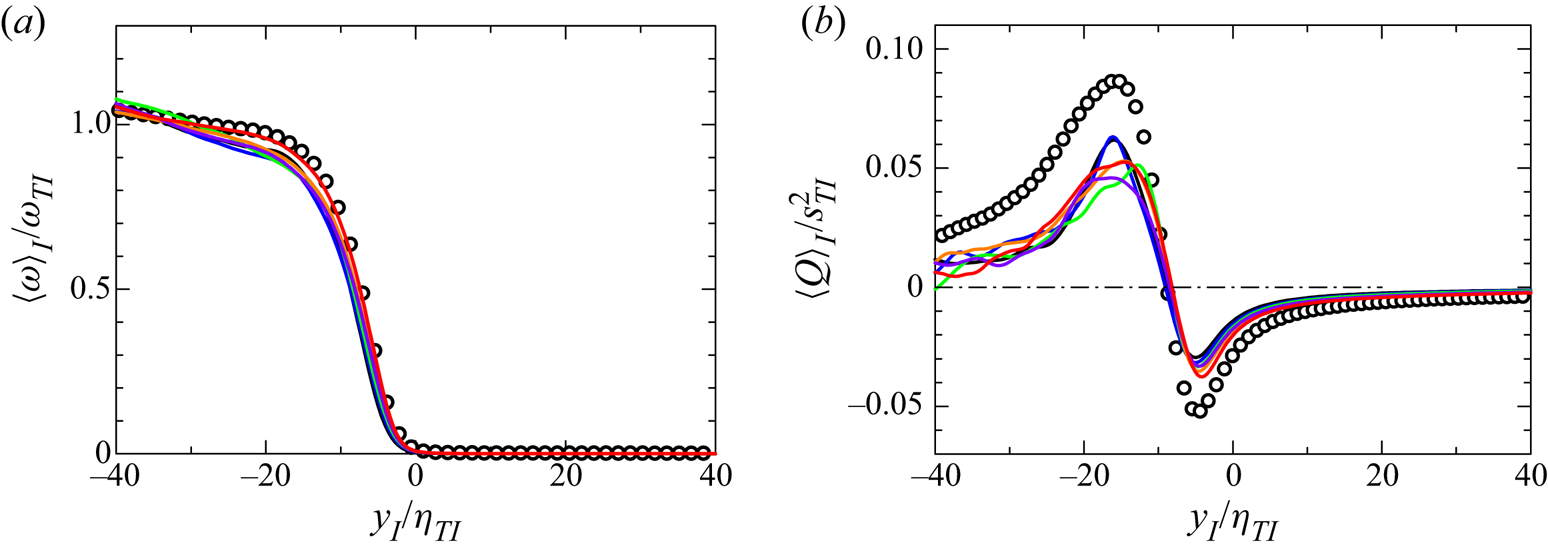
Figure 9(a) shows  $\langle \omega \rangle _I$ normalized by vorticity
 $\omega _{TI}$ at
 $y_I=-2\delta _{TNTI}$. The mean vorticity jump at different Reynolds numbers collapses well within the TNTI layer (
 $y_I$ from 0 to approximately 15
 $\eta _{TI}$) in figure 9(a). The conditional averages of second invariant of velocity gradient tensor
 $\langle Q \rangle _I$ are plotted in figure 9(b). Here,
 $Q$ is defined as
 $Q=(\boldsymbol{\mathsf{\omega _{ij}}} \boldsymbol{\mathsf{\omega _{ij}}}-{\mathsf{S}}_{ij}{\mathsf{S}}_{ij})/2$, with
 $\boldsymbol{\mathsf{\omega _{ij}}} =({\partial u_i }/{\partial x_j}-{\partial u_j }/{\partial x_i})/2$ and
 ${\mathsf{S}}_{ij}=({\partial u_j }/{\partial x_i}+{\partial u_i }/{\partial x_j})/2$. We also normalize
 $\langle Q\rangle _I$ by the mean strain product taken at
 $y_I=-2\delta _{TNTI}$, which is denoted as
 $s^2_{TI}$. In this figure, the profiles for different Reynolds numbers also collapse together. In these profiles, we can see that the vorticity is weaker than strain (
 $Q<0$) within the VSL, and stronger than strain (
 $Q>0$) within the TSL, as also found in other free shear flows. Here, figures 9(a) and 9(b) both indicate that the turbulent characteristics taken at
 $y_I=-2\delta _{TNTI}$ well characterize the statistics near the TNTI layer. The DNS results for a temporally developing planar jet with jet Reynolds number 10 000 (Watanabe et al. Reference Watanabe, Zhang and Nagata2019b) are also compared in figure 9. The shape and magnitude of the conditional mean vorticity and the second invariant of velocity gradient tensor are similar between the jet and TBL when they are normalized by
 $\eta _{TI}$.
The normalized conditional mean profiles of (a) mean vorticity magnitude  $\langle \omega \rangle _I / \omega _{TI}$, and (b) the second invariant of velocity gradient tensor
 $\langle Q \rangle _I / s^2_{TI}$, where
 $\omega _{TI}$ and
 $s^2_{TI}$ represent
 $\langle \omega \rangle _I$ and
 $\langle {\mathsf{S}}_{ij}{\mathsf{S}}_{ij}\rangle _I$ calculated at
 $y_I/\delta _{TNTI}=-2$, respectively. The line colours represent the Reynolds numbers as shown in figure 3. The circle symbols represent the data of a turbulent planar jet with the jet Reynolds number
 $10\,000$ (Watanabe et al. Reference Watanabe, Zhang and Nagata2019b).

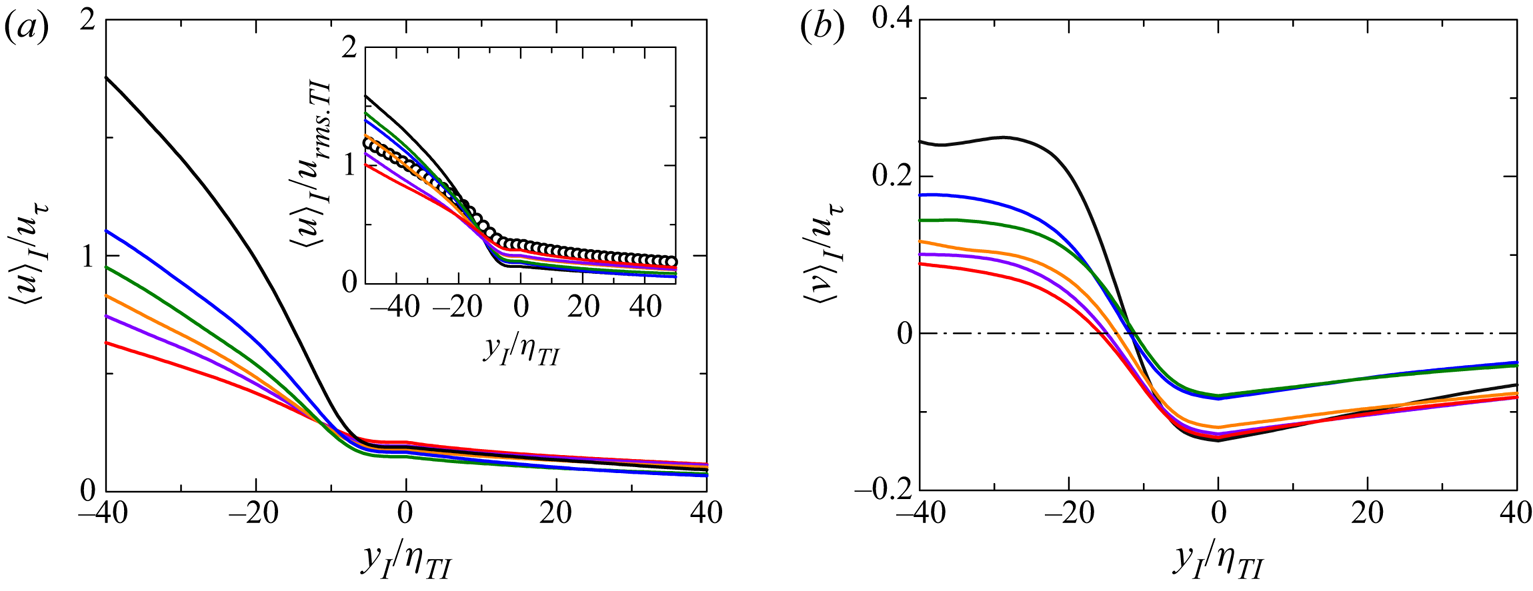
Figure 10(a) shows the conditional mean streamwise velocity  $\langle u \rangle _I$ normalized by the friction velocity
 $u_\tau$. The conditional mean velocity is very small and almost constant within the VSL, then it increases rapidly in the TSL, and the mean velocity is still increasing gradually in the turbulent core region. However, the mean streamwise velocity is flat within the VSL, which indicates that the mean shear is absent within the VSL. In this study,
 $\langle u \rangle _I$ is qualitatively different from the result by Eisma et al. (Reference Eisma, Westerweel, Ooms and Elsinga2015), which is well approximated by their Z-shape model. The Z-shape model is characterized by sudden changes of the mean velocity gradient at the boundaries among the turbulent core region, the TNTI layer and the non-turbulent region. The present results confirm that
 $\langle u \rangle _I$ increases from the TNTI layer to the turbulent core region without a significant change of the mean velocity gradient. It seems that this difference is due to different definitions of the local coordinate used for the conditional statistics. Eisma et al. (Reference Eisma, Westerweel, Ooms and Elsinga2015) considered the local coordinate taken in the wall-normal direction, while
 $y_I$ in this study is taken in the interface normal direction. It was also shown that the Z-shape model for
 $\langle u \rangle _I$ is valid in a turbulent planar jet if the local coordinate is taken in the transverse direction of the jet (Watanabe et al. Reference Watanabe, Sakai, Nagata, Ito and Hayase2014). These results indicate that the conditional mean velocity profile near the TNTI layer is sensitive to the definition of the local interface coordinate. The inset of figure 10(a) shows
 $\langle u \rangle _I$ normalized by
 $u_{rms.TI}$, which is the r.m.s. of streamwise velocity
 $u_{rmsI}$ at
 $y_I/\delta _{TNTI}=-2$. Here,
 $u_{rmsI}$ is defined as
 $\sqrt { \langle u^2 \rangle _I - \langle u \rangle _I^2 }$. The velocity jump of
 $\langle u \rangle _I$ across the TNTI layer is approximately one order of
 $u_{rms.TI}$. The temporally developing planar jet with jet Reynolds number 10 000 (Watanabe et al. Reference Watanabe, Zhang and Nagata2019b) is also compared in figure 10(a), where the profiles are similar for the jet and TBL when
 $y_I$ is normalized by
 $\eta _{TI}$. Even though it seems from figure 10(a) that the mean shear exists within and near the TNTI layer, how significantly the mean shear affects the TNTI layer is still not clear.
(a) Conditional mean streamwise velocity  $\langle u \rangle _I$ and (b) conditional mean vertical velocity
 $\langle v \rangle _I$, normalized by the friction velocity
 $u_\tau$. The inset in (a) shows
 $\langle u \rangle _I$ normalized by the r.m.s. streamwise velocity fluctuation
 $u_{rms.TI}$ calculated at
 $y_I/\delta _{TNTI}=-2$. The circle symbols represent the data of a turbulent planar jet with jet Reynolds number
 $10\,000$ (Watanabe et al. Reference Watanabe, Zhang and Nagata2019b).

Figure 10(b) shows the conditional mean of vertical velocity,  $\langle v \rangle _I / u_\tau$, which becomes positive in the turbulent core region and negative in the non-turbulent region. This profile is consistent with previous studies on a spatially developing TBL (Eisma et al. Reference Eisma, Westerweel, Ooms and Elsinga2015) and a turbulent planar jet (Watanabe et al. Reference Watanabe, Sakai, Nagata, Ito and Hayase2014). Negative
 $\langle v \rangle _I / u_\tau$ in the non-turbulent region is expected from large-scale motions, such as sweeps (Pope Reference Pope2000) in TBLs, which are expected to be related to the engulfment. The engulfment process can draw the non-turbulent fluids towards the turbulent region directly, where the valley structures appear on the TNTI with the negative
 $\langle v \rangle _I$ in the non-turbulent region. The profile of
 $\langle v \rangle _I$ is also consistent with experimental results obtained for the interface detected with kinetic energy (Chauhan et al. Reference Chauhan, Philip and Marusic2014a; de Silva et al. Reference de Silva, Philip, Hutchins and Marusic2017). The mean vertical velocity defined with an average taken on a horizontal plane,
 $\langle v\rangle$, is zero at any locations in the temporally developing TBLs, unlike in spatially developing TBLs. However, the conditional profile of
 $\langle v \rangle _I$ is consistent between temporal and spatial TBLs, and the non-turbulent fluid motions in the vicinity of the interface are similar in both temporal and spatial TBLs. These non-turbulent fluid motions are related to a part of the entrainment process, and the temporal simulation well captures the process by which the non-turbulent fluid is transferred towards the TNTI in the intermittent region of spatially developing TBLs. Also, the changes in the conditional mean streamwise and vertical velocities across the TNTI layer are of the same order as in previous studies (Chauhan et al. Reference Chauhan, Philip and Marusic2014a; Eisma et al. Reference Eisma, Westerweel, Ooms and Elsinga2015).
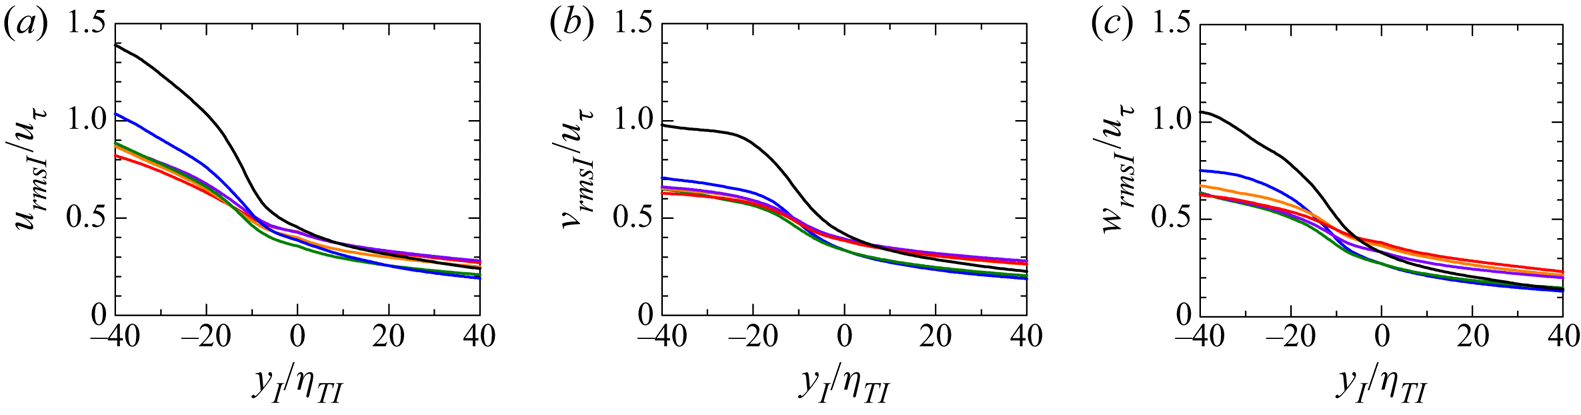
The conditional r.m.s. values of streamwise velocity  $u_{rmsI}$, wall-normal velocity
 $v_{rmsI}$ and spanwise velocity
 $w_{rmsI}$ are shown in figure 11. It should be noticed again that the conditional r.m.s. of streamwise velocity
 $u_{rmsI}$ is defined as
 $\sqrt { \langle u^2 \rangle _I - \langle u \rangle _I^2 }$;
 $v_{rmsI}$ and
 $w_{rmsI}$ are calculated in the same way as
 $u_{rmsI}$. The low Reynolds number case has a larger r.m.s. value for all velocity components in the turbulent region, but the r.m.s. velocity fluctuations tend to be independent of the Reynolds number for high Reynolds numbers. This might be because the production term of the turbulent kinetic energy budget is almost 0 for large
 $y^+$ (Smits, McKeon & Marusic Reference Smits, McKeon and Marusic2011). As we mentioned before, the height
 $y_{IB}$ of the irrotational boundary is approximately
 $0.9\delta$, namely
 $y_{IB}^+ \approx 0.9 Re_{\tau }$, which is why the r.m.s. fluctuations of the three velocity components are similar to each other for high Reynolds numbers. The jumps of r.m.s. velocity fluctuations near the TNTI layer in the present DNS are of the same order in their experimental results (Chauhan et al. Reference Chauhan, Philip and Marusic2014a), where the TBLs are investigated experimentally between
 $Re_{\tau }=1230$ and
 $Re_{\tau }=14\,500$.
Conditional r.m.s. velocity fluctuations: (a) streamwise velocity, (b) wall-normal velocity, and (c) spanwise velocity. The line colours represent the Reynolds numbers as shown in figure 3.

3.4. The shear effects near and within the TNTI layer
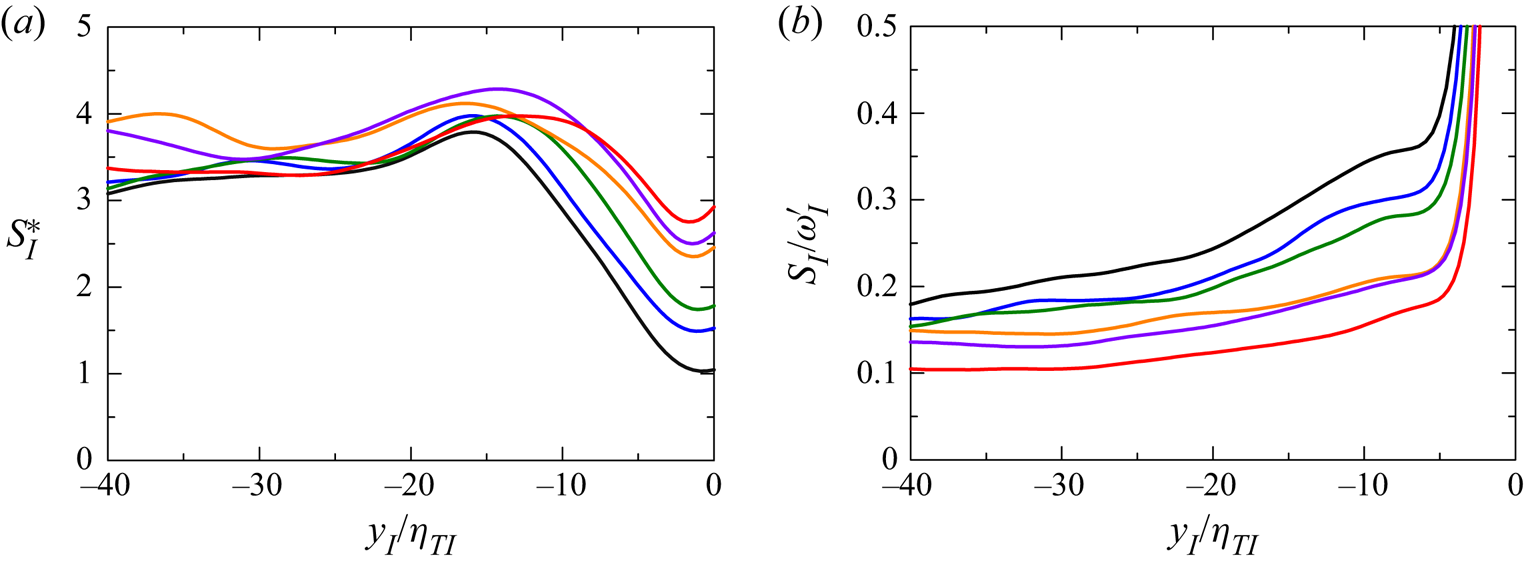
As shown in figure 10, the mean shear exists within and near the TNTI layer, where we investigate how significantly the mean shear affects the TNTI layer. Therefore, the conditional shear parameter defined as  $S^*_I = \langle \partial u / \partial y \rangle _I \langle k \rangle _I / \langle \varepsilon \rangle _I$ based on the conditional mean streamwise velocity derivative is calculated for evaluating the shear effects on the energy-containing eddies near the TNTI. The shear parameter is defined as the ratio between the decay time of energy-containing eddies and the shear deformation time (Corrsin Reference Corrsin1958). Figure 12(a) shows that the conditional shear parameter is approximately 4 in the turbulent core region for all the Reynolds numbers, and the value of
 $S^*_I$ is within the typical range (from 3 to 6) in turbulent shear flows (Pope Reference Pope2000). The conditional shear parameter decreases from the TSL towards the irrotational boundary (
 $y_I$ from 15 to 0). The value of the shear parameter indicates that the shear effects do exist near and within the TNTI layer, but are not very significant on the large-scale eddies. Furthermore, the value of the shear parameter within the TNTI layer is in the typical range of shear flows (Pope Reference Pope2000).
(a) Conditional shear parameter defined as  $S^*_I = \langle \partial u / \partial y \rangle _I \langle k \rangle _I / \langle \varepsilon \rangle _I$ near the TNTI layer. (b) Conditional shear-to-vorticity ratio
 $S_I/\omega '_I$ near the TNTI layer. The line colours represent the Reynolds numbers as shown in figure 3.

The conditional shear-to-vorticity ratio  $S_I/\omega _I'$ is shown in figure 12(b), where the conditional mean shear
 $S_I$ is defined as
 $S_I = \langle \partial u / \partial y \rangle _I$, and the conditional fluctuation
 $\omega _I'$ is defined as
 $\omega _I'= \sqrt {\langle \omega _I^2 \rangle - \langle \omega _I \rangle ^2}$. This ratio indicates the relative shear effects on the small-scale motions near the TNTI. If
 $S_I/\omega _I'$ is much smaller than 1, then the small-scale vortices are decoupled from the mean shear and become roughly isotropic (Jiménez Reference Jiménez2013). As shown in figure 12(b),
 $S_I/\omega _I'$ under the TNTI layer is approximately
 $0.1$–
 $0.2$. These values are so small that the mean shear effects on small-scale motions are weak. The Reynolds number dependence can still be found in this figure: the results with a higher Reynolds number have a lower value of
 $S_I/\omega _I'$, which means that the vortices tend to be more isotropic with the increase of Reynolds number. This observation is similar to that found by computing conventional average
 $S/\omega '$ in the outer layer (
 $y=0.6\delta$) (Jiménez Reference Jiménez2013). Finally, because the irrotational boundary (
 $y_I=0$) is detected by a vorticity magnitude isosurface, the vorticity fluctuation is close to zero near the irrotational boundary, which causes the large value of
 $S_I/\omega _I'$ near the irrotational boundary.
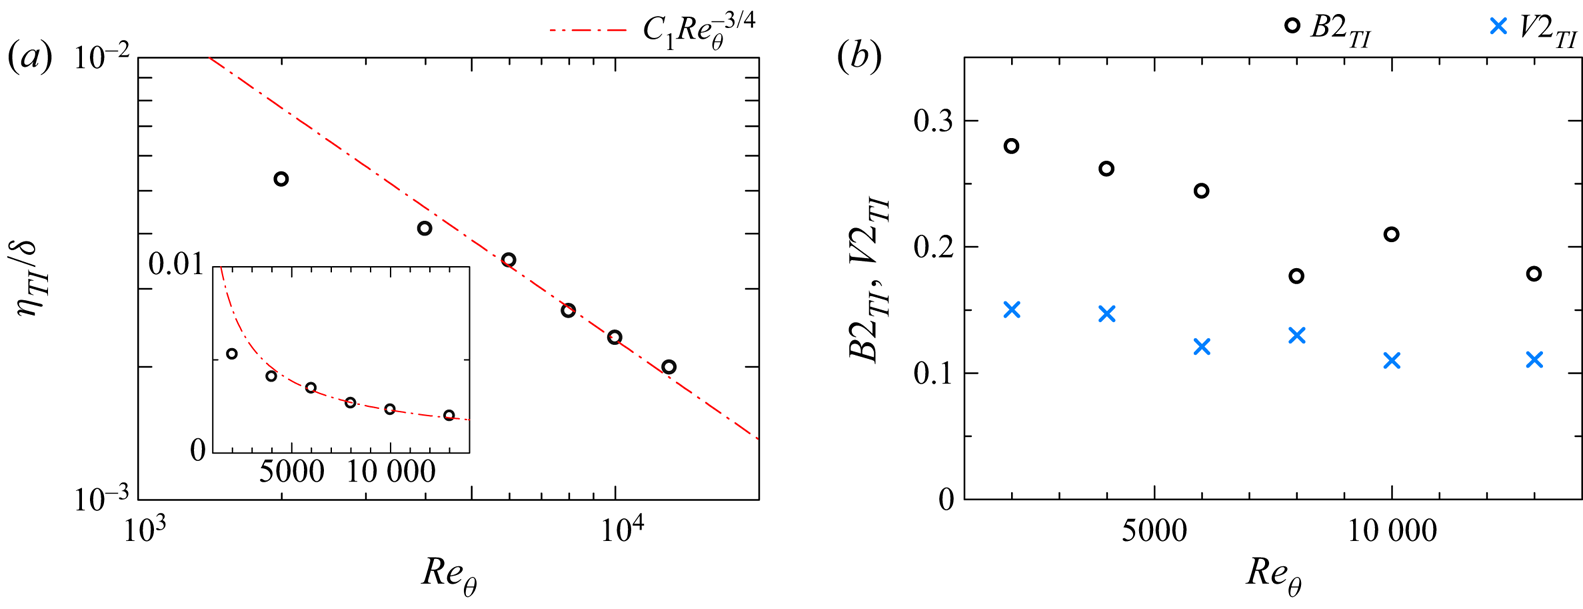
In general, the boundary layer thickness  $\delta$ represents the characteristic length scale of large-scale motions (Pope Reference Pope2000), and
 $\eta _{TI}$ indicates the smallest scale of the turbulence near the TNTI layer. Figure 13(a) shows the ratio between
 $\eta _{TI}$ and
 $\delta$ against the Reynolds number
 $Re_{\theta }$. The red dot-dash line represents
 $C_1\,Re_\theta ^{-3/4}$, where
 $C_1=2.3$ is a constant obtained from the present DNS data with
 $Re_{\theta }\geq 4000$. It is a scaling law for homogeneous isotropic turbulence (HIT),
 $\eta /l_0 \sim Re^{-3/4}$, where
 $l_0$ is the integral length scale that represents the length scale of large-scale motions for homogeneous isotropic turbulence (Pope Reference Pope2000). It can be seen clearly that the results at relatively high Reynolds numbers (
 $Re_{\theta }=6000$–
 $13\,000$) agree well with the red dot-dash line. However, the results for
 $Re_{\theta }=2000$ and
 $4000$ are lower than this line, especially for
 $Re_{\theta }=2000$. It is expected that the wall has more significant influences on the TNTI layer at lower Reynolds numbers, which might explain the departure from
 $\eta /\delta \sim Re_\theta ^{-3/4}$.
(a) The  $Re_{\theta }$ dependence of the length scale ratio between the Kolmogorov scale
 $\eta _{TI}$ and boundary layer thickness
 $\delta$ at
 $y_I/\delta _{TNTI}=-2$. The inset shows the corresponding plot with a linear scale. (b) The second invariants of the anisotropy tensor of Reynolds stress and vorticity for turbulence near the TNTI, which are denoted
 $B2_{TI}$ and
 $V2_{TI}$, respectively.

Figure 13(b) shows the second invariants of the anisotropy tensors of the Reynolds stress and vorticity in the turbulent region near the TNTI,  $B2_{TI}$ and
 $V2_{TI}$. These invariants are defined as
 $B2_{TI}=(3 \langle {\mathsf{b}}_{ij}\rangle _{TI} \langle {\mathsf{b}}_{ij} \rangle _{TI} /2)^{1/2}$ and
 $V2_{TI}=(3 \langle {\mathsf{v}}_{ij}\rangle _{TI} \langle {\mathsf{v}}_{ij} \rangle _{TI}/2)^{1/2}$, respectively, with the anisotropy tensors of the Reynolds stress and vorticity:
 \begin{gather} \langle {\mathsf{b}}_{ij} \rangle_{TI} =\frac{ \langle u_{i}u_{j} \rangle_{TI} - \langle u_{i}\rangle_{TI} \langle u_{j}\rangle_{TI} } {\langle u_{k} u_{k} \rangle_{TI} - \langle u_{k}\rangle_{TI} \langle u_{k}\rangle_{TI} }-\frac{1}{3}\,\boldsymbol{\mathsf{\delta_{ij}}}, \end{gather}
 \begin{gather}\langle {\mathsf{v}}_{ij} \rangle_{TI} =\frac{\langle \omega_{i}\omega_{j} \rangle_{TI}}{\langle \omega_{k}\omega_{k} \rangle_{TI}}-\frac{1}{3}\,\boldsymbol{\mathsf{\delta_{ij}}}. \end{gather}
Here,  $\delta _{ij}$ is Kronecker's delta. The values of
 $B2_{TI}$ and
 $V2_{TI}$ indicate the anisotropy related to the large- and small-scale turbulent motions under the TNTI, respectively. The invariants are equal to 1 and 0 for complete anisotropy and isotropy, respectively. In the figure,
 $B2_{TI}$ is larger than
 $V2_{TI}$, indicating that large-scale motions are more anisotropic compared with small-scale ones. Higher isotropy for smaller scales is related to the weak mean shear effects for small-scale motions as examined with
 $S_I/\omega _I'$ in figure 12(b). As expected from the above discussion, both invariants decrease with the Reynolds number, and the flow under the TNTI becomes close to isotropic turbulence. This behaviour is related to the departure from the scaling law for HIT at the low Reynolds numbers as shown in figure 13(a). A similar observation was made by Jiménez (Reference Jiménez2013), where the turbulence motions in the outer layer become more isotropic with the increase of Reynolds number in channel flow.
3.5. The geometry of the irrotational boundary
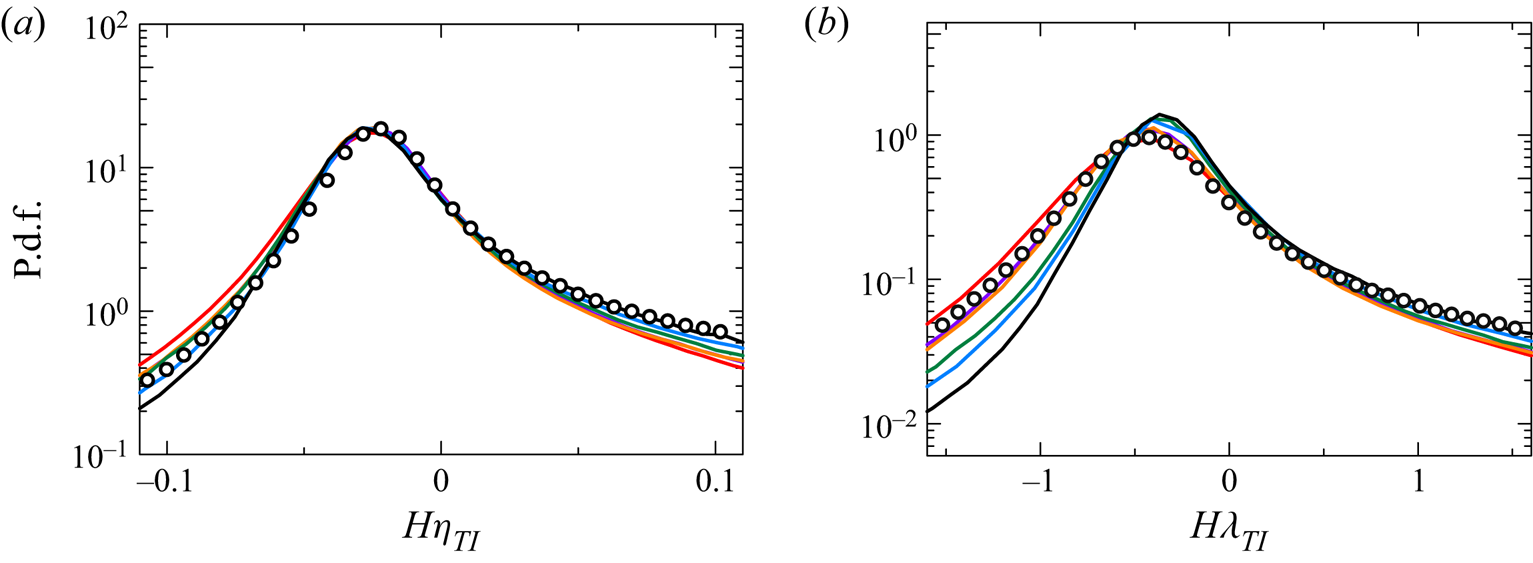
The probability density function (p.d.f.) of the mean curvature  $H = (1/2) \boldsymbol {\nabla }\boldsymbol {\cdot }\boldsymbol {n}$ of the irrotational boundary is shown in figure 14, where the p.d.f. is normalized by the Kolmogorov length scale
 $\eta _{TI}$ in figure 14(a), and by the Taylor microscale
 $\lambda _{TI}$ in figure 14(b). The positive/negative value of
 $H$ indicates the concave/convex region in the top view of the TBL shown in figure 4. The profiles of p.d.f.s normalized by
 $\eta _{TI}$ are similar with different Reynolds numbers (
 $Re_{\theta }=2000$–
 $13\,000$); in particular, the locations and values of peaks in the p.d.f.s collapse together for all the Reynolds numbers. The p.d.f. normalized by
 $\lambda _{TI}$ depends strongly on the Reynolds number, as confirmed by the variation of the peak value and location of the p.d.f. with the Reynolds number. Therefore, the mean curvature of the irrotational boundary is well characterized by the Kolmogorov scale
 $\eta _{TI}$. The DNS results for a temporally developing planar jet with jet Reynolds number 10 000, (
 $Re_\lambda =97$) (Watanabe et al. Reference Watanabe, Zhang and Nagata2019b) are also compared in figure 14(a). The p.d.f. of the mean curvature hardly differs for the jet and TBL when they are normalized by
 $\eta _{TI}$. The p.d.f. has a peak at
 $H \eta _{TI}\approx -0.025$, which indicates that a large part of the irrotational boundary has curvature radius approximately
 $40\eta _{TI}$. The length
 $40\eta _{TI}$ is the typical length scale of velocity gradients in the outer logarithmic layer or outer layer (Jiménez Reference Jiménez2013). On the other hand, the mean curvature p.d.f. normalized by
 $\lambda _{TI}$ for the jet (
 $Re_\lambda =97$) collapses with
 $Re_\theta =10\,000$ (
 $Re_{\lambda.TI}=90$) for the TBL but differs for lower Reynolds numbers, which also indicates that the p.d.f. normalized by
 $\lambda _{TI}$ depends on the Reynolds number. With flow visualization, previous studies observed small-scale vortex tubes within the TNTI layer, and the interface forms around them (da Silva, Dos Reis & Pereira Reference da Silva, Dos Reis and Pereira2011). The curvature of the TNTI is expected to be related to the diameter of the vortices or the curvature radius of the vortex axis since both the curvature radius of the TNTI and the length scale of vortex tubes scale with the Kolmogorov scale. This is geometrical information about the irrotational boundary, which is expected to be related to the turbulent structure with a similar length scale beneath the irrotational boundary.
The p.d.f.s of the mean curvature of the irrotational boundary normalized by (a) Kolmogorov length scale  $\eta _{TI}$, and (b) Taylor microscale
 $\lambda _{TI}$. The line colours represent the Reynolds numbers as shown in figure 3. The circle symbols represent the data of a turbulent planar jet with jet Reynolds number
 $10\,000$ (Watanabe et al. Reference Watanabe, Zhang and Nagata2019b).

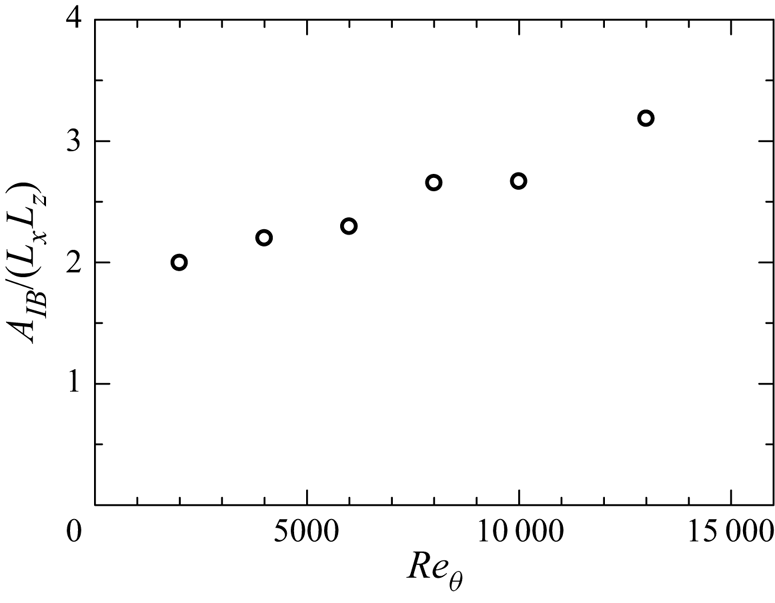
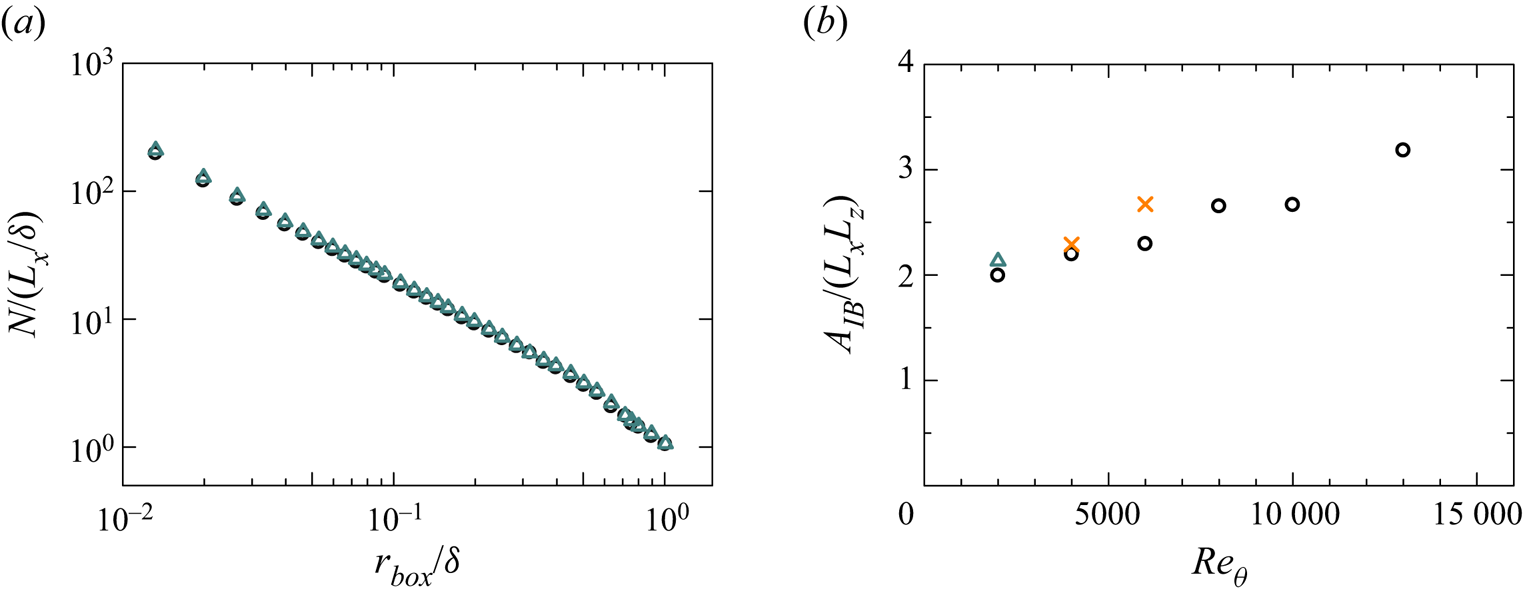
Figure 15 shows the surface area of irrotational boundary  $A_{IB}$ normalized by
 $L_{x}L_{z}$. Here,
 $A_{IB}/(L_{x}L_{z})$ is around 2–4 and increases with the Reynolds number because of the complex shape of the irrotational boundary at high
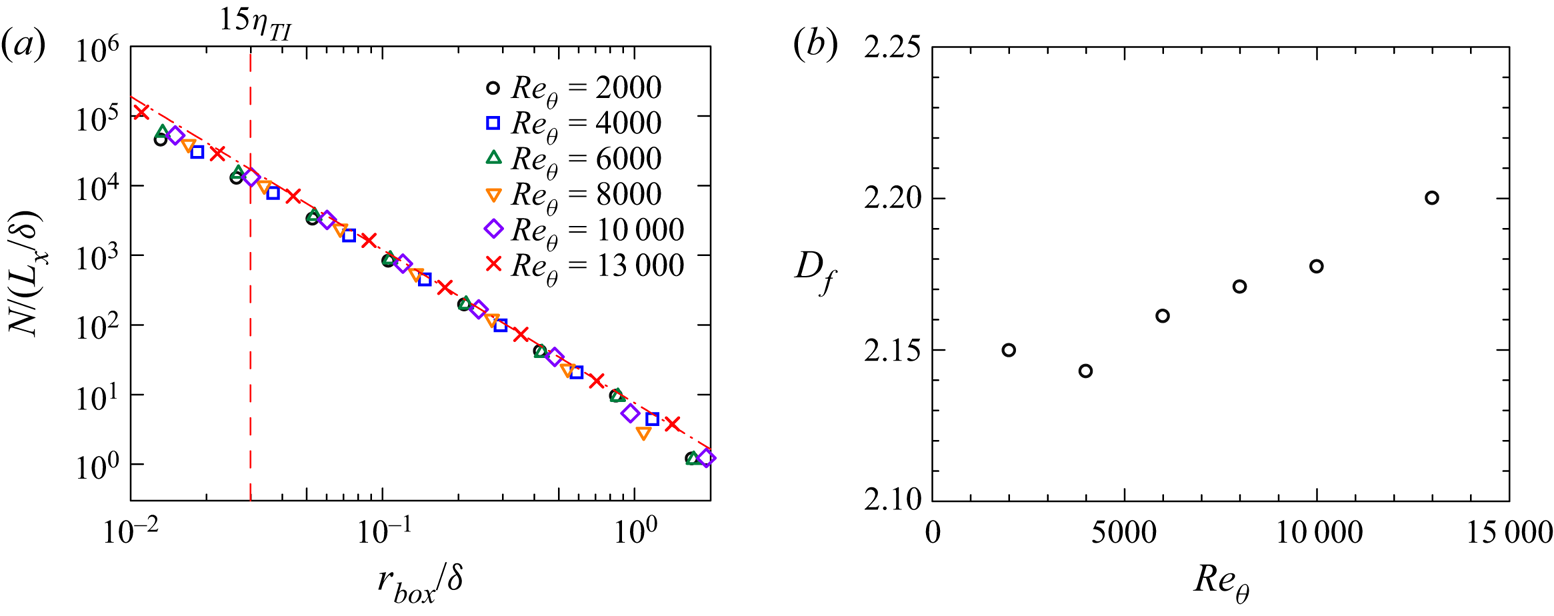
 $Re_{\theta }$, as shown in figure 4. The previous study (Meneveau & Sreenivasan Reference Meneveau and Sreenivasan1990) suggested that the surface area is related to the fractal dimension of the irrotational boundary because the complex shape is caused by the multiscale turbulent motions under the TNTI. Here, the box-counting analysis is conducted to investigate the fractal characteristics of the TNTI (Prasad & Sreenivasan Reference Prasad and Sreenivasan1996). The three-dimensional box-counting algorithm is applied to the irrotational boundary. First, we divide the three-dimensional space into cubic boxes with size
 $r_{box}$, and then we count the minimum number of boxes
 $N(r_{box})$ needed to contain the whole irrotational boundary. The fractal dimension can be estimated with a power law
 $N\sim r_{box}^{-D_f}$, where
 $D_f$ is the three-dimensional fractal dimension. Figure 16(a) plots
 $N/(L_x/\delta )$ against
 $r_{box}/\delta$. The power law
 $N\sim r_{box}^{-D_f}$ is observed for a wide range of scales, suggesting that the irrotational boundary is characterized by a fractal shape. Even though the results are similar for all
 $Re_{\theta }$, there are small variations with the increase of
 $Re_{\theta }$. The fractal dimension
 $D_f$ estimated from
 $N(r_{box})$ with range
 $15\eta _{TI} < r_{box} <0.5\delta$ is plotted in figure 16(b). As the Reynolds number increases,
 $D_f$ also increases. These values of the fractal dimension are slightly smaller than
 $D_f\approx 7/3$ found in previous studies (de Silva et al. Reference de Silva, Philip, Chauhan, Meneveau and Marusic2013; Zhuang et al. Reference Zhuang, Tan, Huang, Liu and Zhang2018) for Reynolds numbers higher than in the present DNS, namely
 $Re_\theta \gg 13\,000$. However, Wu et al. (Reference Wu, Wang, Cui and Pan2020) have reported
 $D_f \approx 2.2$ at a low Reynolds number (
 $Re_\tau =483$), and Borrell & Jiménez (Reference Borrell and Jiménez2016) also showed that the fractal dimension is approximately
 $2.1$–
 $2.2$ for
 $Re_\tau =1000$–
 $2000$. Although
 $D_f$ tends to increase with
 $Re_\theta$,
 $D_f$ is not expected to increase monotonically up to an infinite value with the Reynolds number. The increasing trend of
 $D_f$ is possibly limited for small to moderately large Reynolds numbers.
The  $Re_{\theta }$ dependence of surface area of the irrotational boundary
 $A_{IB}$.

(a) Plots of  $N/(L_x/\delta )$ against
 $r_{box}/\delta$, where
 $r_{box}$ is a box size, and
 $N$ is the minimum number of boxes with size
 $r_{box}$ for covering the whole irrotational boundary. The red dashed line denotes
 $15\eta _{TI}$ for
 $Re_{\theta }=13\,000$. (b) The Reynolds number dependence of the values of three-dimensional box-counting fractal dimension
 $D_f$.

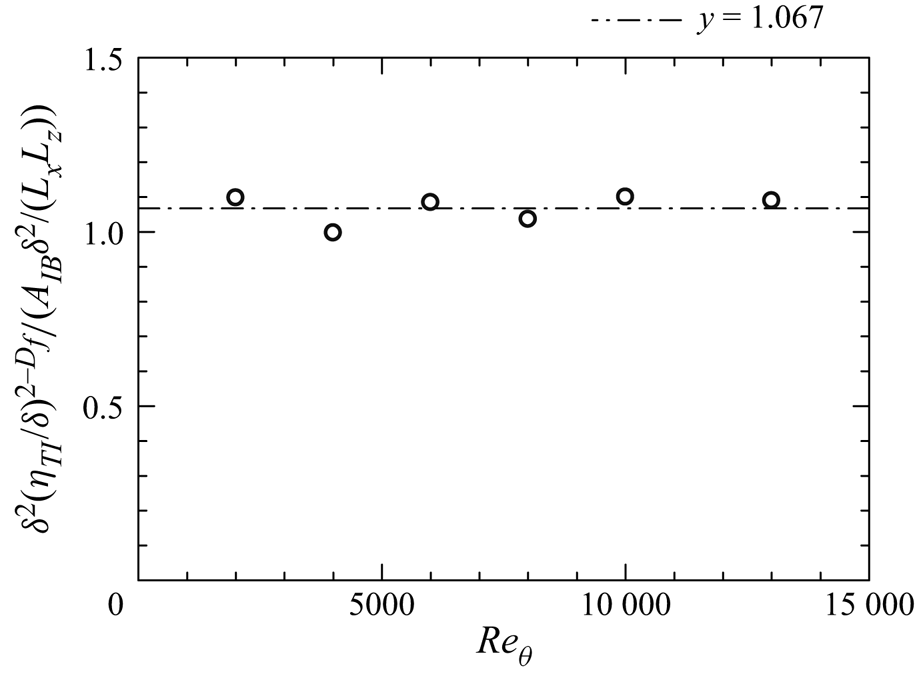
The previous study (Meneveau & Sreenivasan Reference Meneveau and Sreenivasan1990) suggested that the surface area can be estimated based on the fractal dimension assumption  $A \sim L^2(\eta /L)^{2-D_f}$. This can be applied in the area of the irrotational boundary in TBLs as
 $A_{IB} \sim \delta ^2(\eta _{TI}/\delta )^{2-D_f}$. Here,
 $L$ can be replaced by
 $\delta$, which represents the large-scale length in TBLs. The scaling law
 $A_{IB} \sim \delta ^2(\eta _{TI}/ \delta )^{2-D_f}$ is also examined by plotting
 $\delta ^2(\eta _{TI}/ \delta )^{2-D_f}/(A_{IB}\delta ^2/(L_xL_z))$ against
 $Re_{\theta }$ in figure 17. The three-dimensional fractal dimension
 $D_f$ used here is obtained from the three-dimensional box-counting method shown above, and
 $A_{IB}\delta ^2/(L_xL_z)$ represents the surface area of the irrotational boundary per
 $\delta ^2$. From the figure,
 $\delta ^2(\eta _{TI}/ \delta )^{2-D_f}/(A_{IB}\delta ^2/(L_xL_z))$ is approximately 1 and independent of the Reynolds number; the surface area of the irrotational boundary also follows the fractal argument of the interface. This result also indicates that the
 $D_f$ value obtained from figure 16(a) expresses accurately the fractal dimension of the irrotational boundary even though it is smaller than the
 $7/3$ suggested in Sreenivasan, Ramshankar & Meneveau (Reference Sreenivasan, Ramshankar and Meneveau1989) for turbulent flows (TBL, jet, mixing layer, etc.). These results also indicate that the boundary layer thickness and the Kolmogorov scale taken near the TNTI layer (
 $y_I/\delta _{TNTI}=-2$) are the largest and smallest length scales relevant to the geometry of the irrotational boundary.
The scaling of the surface area of the irrotational boundary  $A_{IB}$:
 $\delta ^2(\eta _{TI}/ \delta )^{2-D_f}/(A_{IB}\delta ^2/(L_xL_z))$.

3.6. The entrainment process
The entrainment is often explained by the combination of the local transition from non-turbulent to turbulent fluid near the TNTI and the non-turbulent fluid motions drawn directly towards the turbulent region, which are often called nibbling and engulfment, respectively (da Silva et al. Reference da Silva, Hunt, Eames and Westerweel2014). Nibbling is also called local entrainment, which is represented as the propagation of irrotational boundary. Engulfment is caused by the large-scale motions in the flow, which draws directly the non-turbulent fluids towards the turbulent region without gain of vorticity. Previous studies (da Silva et al. Reference da Silva, Hunt, Eames and Westerweel2014) also show that the growth of turbulence is caused mainly by the local entrainment in most types of flow. In the present study, we analyse the entrainment with a focus on nibbling.
The velocity of the irrotational boundary (enstrophy isosurface) movement  $\boldsymbol {u}^{I}$ can be written as a sum of fluid velocity
 $\boldsymbol {u}$ and the propagation velocity
 $\boldsymbol {v}^{P}$, i.e.
 $\boldsymbol {u}^{I}=\boldsymbol {u}+\boldsymbol {v}^{P}$, where
 $\boldsymbol {v}^{P}=v_n \boldsymbol {n}$ is expressed with the local entrainment velocity
 $v_n$ and the interface normal direction
 $\boldsymbol {n}$. By the propagation of the irrotational boundary to the non-turbulent region, non-turbulent fluids pass through the irrotational boundary to the turbulent region, and this local entrainment velocity can be derived with the enstrophy transport equation (Holzner & Lüthi Reference Holzner and Lüthi2011)
 \begin{equation} v_n =\frac{{\rm D}(\omega^2/2) / {\rm D}t }{|\boldsymbol{\nabla} (\omega^2/2)|}. \end{equation}
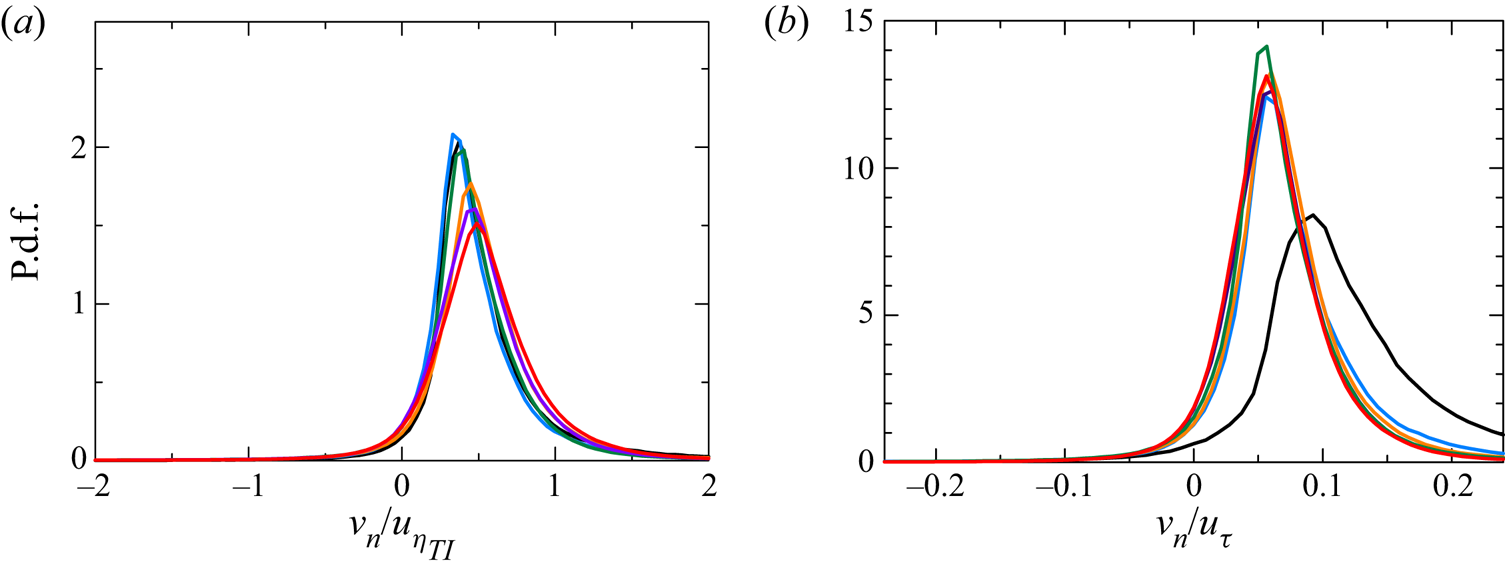
The p.d.f.s of the local entrainment velocity  $v_n$ normalized by the Kolmogorov velocity
 $u_{\eta _{TI}}=(\langle \varepsilon \rangle _{I} \nu )^{1/4}$ and friction velocity
 $u_\tau$ are shown in figures 18(a) and 18(b), respectively. Here, the positive value of
 $v_n$ indicates that the irrotational boundary propagates into the non-turbulent region, and vice versa. Large probability appears for
 $v_n>0$, indicating that the irrotational boundary frequently propagates towards the non-turbulent region, which is similar to that found in Jahanbakhshi (Reference Jahanbakhshi2021) in the spatial TBL (
 $Re_{\tau } \approx 500$). For the p.d.f.s of
 $v_n$ normalized by
 $u_{\eta _{TI}}$, their shapes and peaks differ depending on the Reynolds number. However, when
 $v_n$ is normalized by the friction velocity
 $u_\tau$, the p.d.f.s for
 $Re_{\theta } \geq 4000$ have a very similar shape although the profile is different for
 $Re_{\theta }=2000$. The local entrainment process is often considered to be caused by the intense vorticity structures (worms) near the TNTI (da Silva et al. Reference da Silva, Hunt, Eames and Westerweel2014). The intense vorticity structures are found to have radius approximately
 $4\eta$ and length approximately
 $3l$ (where
 $l$ is the integral length scale) in HIT with Reynolds number range
 $Re_\lambda = 35$–
 $170$ (Jiménez et al. Reference Jiménez, Wray, Saffman and Rogallo1993). For the present DNS,
 $3l_{TI}$ satisfies
 $3l_{TI} \lesssim \delta$ according to the
 $Re_{\lambda.TI}$ in table 3 and
 $\eta _{TI}/\delta$ in figure 13(a). Furthermore, Marusic, Mathis & Hutchins (Reference Marusic, Mathis and Hutchins2010) showed that the small-scale component of
 $u^2$ with streamwise length
 $l_x < \delta$ in the outer layer is also Reynolds-number-independent for moderate and high Reynolds numbers if it is normalized by the wall unit. In summary, the friction velocity is a reasonable velocity scale that characterizes the local entrainment velocity as long as the Reynolds number is not too small. Although the thickness of the TNTI layer scales with the Kolmogorov length scale, the local entrainment velocity is not well characterized by the Kolmogorov velocity scales. Previous studies on vortical structures within the TNTI layer have found that the characteristics of the TNTI layer are explained reasonably by the flow around small-scale vortex tubes (Watanabe et al. Reference Watanabe, Jaulino, Taveira, da Silva, Nagata and Sakai2017a). As also observed for the TNTI layers in this study, the length and velocity of vortex tubes have different scalings: the vortex diameter scales with the Kolmogorov length scale while the velocity around vortices does not scale with the Kolmogorov velocity (Kang, Tanahashi & Miyauchi Reference Kang, Tanahashi and Miyauchi2007; Mouri, Hori & Kawashima Reference Mouri, Hori and Kawashima2007; da Silva et al. Reference da Silva, Dos Reis and Pereira2011). These scalings of the vortices may appear as different scalings of the length and velocity scales of the TNTI layer.
The p.d.f.s of the local entrainment velocity  $v_n$ normalized by (a) Kolmogorov velocity length scale
 $u_{\eta _{TI}}$, and (b) friction velocity
 $u_\tau$. The line colours represent the Reynolds numbers as shown in figure 3.

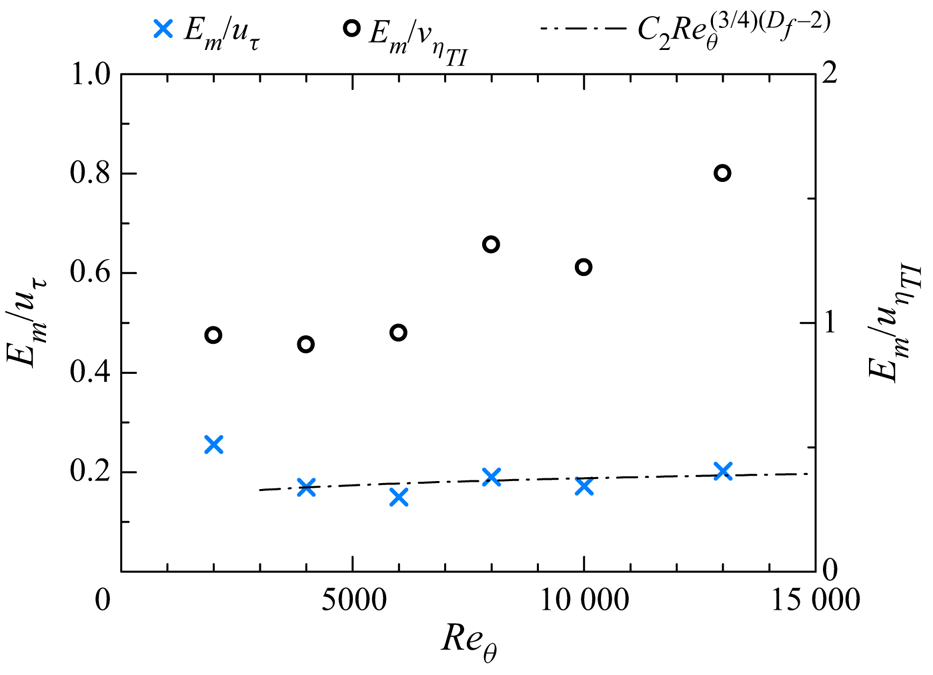
The mean mass entrainment rate  $E_{m}$ per unit horizontal area is calculated as
 $E_{m} \approx \langle {v_n}\rangle A_{IB}/L_xL_y$, where the density is a constant due to the incompressibility. Figure 19 shows
 $E_{m}/u_{\eta _{TI}}$ and
 $E_{m}/u_\tau$ as functions of
 $Re_\theta$. The fractal analysis has suggested that
 $\delta ^2(\eta _{TI}/\delta )^{2-D_f}/(A_{IB}\delta ^2/(L_xL_y)) \approx 1$, which yields
 $A_{IB}/(L_xL_y) \approx (\eta _{TI}/\delta )^{2-D_f}$. In addition, the scaling law for isotropic turbulence
 $\eta _{TI}/\delta \sim Re_{\theta }^{-3/4}$ can be used to obtain
 $A_{IB}/L_xL_y \approx Re^{(3/4)(D_f-2)}$. Also, the p.d.f. of
 $v_n$ has suggested that
 $\langle v_n \rangle$ scales with
 $u_\tau$. These relations yield the scaling law for the mean entrainment rate as
 $E_m/u_\tau \sim Re^{(3/4)(D_f-2)}$, which is also compared with the DNS results in figure 19 as the dot-dash line. Here,
 $D_f=2.15$, which is an average of all Reynolds numbers, is used. In the present DNS, the mean entrainment rate
 $E_{m}$ normalized by
 $u_\tau$ tends to follow this scaling law for
 $Re_{\theta } \geq 4000$. The departure from the scaling law for
 $Re_\theta =2000$ is explained by two points: the turbulence under the TNTI becomes far from an isotropic state at low
 $Re_\theta$, as in the results for
 $\eta _{T I}/\delta$ in figure 13(a); the entrainment velocity
 $\langle v_n \rangle /u_\tau$ at
 $Re_\theta =2000$ has a different profile from higher Reynolds numbers, as shown in figure 18(b). These can be explained in the following physical view:
 $y/\delta _\nu$ or
 $y+$ corresponding to the intermittent region is very small for a low Reynolds number. Therefore, the small-scale turbulent motions in the intermittent region are affected strongly by the viscous effects from the wall, which result in a large viscous dissipation ratio for turbulent kinetic energy
 $\varepsilon _{TI}$, namely, a small Kolmogorov length scale
 $\eta _{TI}$. Similarly, the enhanced viscous effects near the TNTI result in a large local entrainment velocity, which is dominated by the viscous effects on vorticity. However, the direct wall effects on the small-scale motions in the intermittent region become weaker with the increase of the Reynolds number. On the other hand, the large-scale motions in the intermittent region also become prominent with the increase of the Reynolds number. Consequently, a larger proportion of small-scale motions is generated from the large-scale motions by the scale-by-scale interaction in the intermittent region at a higher Reynolds number. Therefore, the flow tends to be closer to isotropic turbulence at a higher Reynolds number.
Normalized mean mass entrainment rate per unit horizontal area.

4. Conclusion
We performed DNS of the temporally developing TBL with a wide range of Reynolds numbers  $Re_{\theta }$ from 2000 to 13 000 to investigate the Reynolds number dependence of the TNTI layer. The grid spacing is determined so that the small-scale turbulent motions near the TNTI layer are well resolved. The outer edge of the TNTI layer (the irrotational boundary) detected as an isosurface of vorticity magnitude is smooth and looks similar to those in free shear flows. The mean thicknesses of the TNTI layer (
 $\delta _{TNTI}$), TSL (
 $\delta _{TSL}$) and VSL (
 $\delta _{VSL}$) defined with the gradient of the conditional mean vorticity magnitude and vorticity dynamics are approximately 15, 10 and 5 times Kolmogorov scale
 $\eta _{TI}$, where
 $\eta _{TI}$ is taken from the turbulent region near the TNTI layer. On the other hand,
 $\delta _{TNTI}$,
 $\delta _{TSL}$ and
 $\delta _{VSL}$ normalized by the Taylor microscale decrease with the Reynolds number. The profiles of the conditional mean vorticity and the second invariant of the velocity gradient tensor at different
 $Re_\theta$ also collapse well when they are normalized by statistics taken near the TNTI layer and the distance from the irrotational boundary is normalized by
 $\eta _{TI}$.
The conditional mean streamwise velocity  $\langle u \rangle _I$ is almost constant within the VSL, while
 $\langle u\rangle _I$ increases rapidly towards the turbulent core region existing within the TSL. The mean velocity jump across the TSL is the order of the r.m.s. streamwise velocity fluctuation near the TNTI layer. The effects of the mean shear near the TNTI layer are evaluated with the conditional shear parameter
 $S^{*}_I$, defined as the time scale ratio of the large-scale turbulent motions to the mean shear, and the shear-to-vorticity ratio
 $S_I/\omega _I'$.
 $S^{*}_I$ is approximately 4 near the TNTI layer for all Reynolds numbers, indicating that the mean shear effects are not significant on large-scale eddies. Here,
 $S_I/\omega _I'$ is approximately
 $0.1$–
 $0.2$ and decreases with the Reynolds number, which implies that the shear effects on the small-scale turbulent motions are weak and tend to be isotropic with the increase of the Reynolds number. The ratio between the smallest and largest scales of turbulent motion near the TNTI layer exhibits the relation
 $\eta _{TI}/\delta \sim Re_{\theta }^{-3/4}$, except for the low Reynolds number case. Higher isotropy near the TNTI at a larger Reynolds number has also been confirmed with the second invariants of anisotropy tensors of Reynolds stress and vorticity.
The geometry of the irrotational boundary was also studied in terms of the mean curvature and the surface area. A peak in the p.d.f. of the mean curvature normalized by  $\eta _{TI}$ hardly changes with the Reynolds number, where most of the irrotational boundary has curvature radius approximately
 $40\eta _{TI}$, which is the typical length scale of velocity gradients in the outer logarithmic layer and outer layer (Jiménez Reference Jiménez2013). With flow visualization, previous studies observed small-scale vortex tubes within the TNTI layer, and the interface forms around them. The curvature of the TNTI is expected to be related to the diameter of the vortices or the curvature radius of the vortex axis since both the curvature radius of the TNTI and the length scale of vortex tubes scale with the Kolmogorov scale. The surface area of the irrotational boundary increases with the Reynolds number, where the Reynolds number dependence is consistent with the fractal analysis of the interface. The fractal dimension is measured as
 $2.14$–
 $2.20$ and increases slowly with the Reynolds number.
The entrainment process related to nibbling is investigated with the local entrainment velocity and the mean entrainment rate. The p.d.f. of local entrainment velocity  $v_n$ shows that the friction velocity
 $u_\tau$ is a reasonable velocity scale that characterizes the local entrainment velocity
 $v_n$. The mean entrainment rate per unit horizontal area
 $E_m$ normalized by
 $u_\tau$ follows the scaling law
 $E_m/u_\tau \sim Re^{3/4(D_f-2)}$ for
 $Re_{\theta } \geq 4000$.
Acknowledgements
The authors acknowledge Professor J. Jiménez and Professor C. Pan for providing valuable comments. The direct numerical simulations presented in this manuscript were carried out on the high-performance computing system in the Japan Agency for Marine-Earth Science and Technology.
Funding
This work was partially supported by Collaborative Research Project on Computer Science with High-Performance Computing in Nagoya University, JSPS KAKENHI grant nos 20H05754, 22K03903 and 22H01398, and National Natural Science Foundation of China grant no. 91852206.
Declaration of interests
The authors report no conflict of interest.
Appendix A. Numerical methods
The numerical code used in the present DNS is based on the fractional step method with staggered grids as used in Watanabe et al. (Reference Watanabe, Zhang and Nagata2018b). The fully conservative central difference schemes (Morinishi et al. Reference Morinishi, Lund, Vasilyev and Moin1998) are applied for spatial discretization, where the accuracy is fourth order in the  $x$ and
 $z$ directions, and second order in the
 $y$ direction. The third-order Runge–Kutta method is used for temporal advancement, while the biconjugate gradient stabilized (Bi-CGSTAB) method (Van der Vorst Reference Van der Vorst1992) is used to solve the Poisson equation for pressure.
An early time period of the flow is simulated by using an implicit large eddy simulation (ILES) like the one conducted in our previous study (Tanaka, Watanabe & Nagata Reference Tanaka, Watanabe and Nagata2019), where the effects of subgrid scales are modelled implicitly by a tenth-order low-pass filter presented in Kennedy & Carpenter (Reference Kennedy and Carpenter1994), while other numerical schemes are the same as in the DNS. After the TBL fully develops in the ILES, the ILES results are used to initialize the DNS. Here, the ILES is assumed to resolve most length scales of the flow (at least scales greater than  $20$ times Kolmogorov scale) to fully recover the small-scale velocity fluctuations in the DNS (Lalescu, Meneveau & Eyink Reference Lalescu, Meneveau and Eyink2013). The number of the grid points used in the ILES (
 $N_{xLES}, N_{yLES}, N_{zLES}$) for different Reynolds numbers is summarized in table 4, which gives the grid sizes
 $\varDelta _x \leq 12\eta$,
 $\varDelta _y\leq 3\eta$ and
 $\varDelta _y\leq 6\eta$ during the simulation. Therefore, most length scales of turbulence in the TBL are resolved in the ILES. After the DNS are switched from the ILES, time is advanced longer than the integral time scale. It was confirmed that the present DNS at the end of the simulations reproduces well-known small-scale characteristics of turbulence, and the details can be found in our previous study (Watanabe et al. Reference Watanabe, Zhang and Nagata2019b).
The number of grid points for LES used to initialize the DNS of the temporally developing TBL.

Appendix B. The effects of the computational domain size on the TNTI characteristics
This appendix examines the effects of the finite computational domain size on the characteristics of the TNTI layer because the large-scale structures in the streamwise direction develop in the TBL. We have conducted additional DNS with a large computational size in the streamwise direction  $L_x=13.4\delta$ at
 $Re_{\theta }=2000$ (case LB02). The initial conditions and numerical methods are the same as for the other simulations in the present study. The computational parameters are displayed in table 5, where
 $\delta$ is taken at the end of the simulation. Although the length of large-scale motions increases with the Reynolds number, their length normalized by
 $\delta$ hardly increases with the Reynolds number as investigated in previous studies (Lozano-Durán & Jiménez Reference Lozano-Durán and Jiménez2014; Sillero, Jiménez & Moser Reference Sillero, Jiménez and Moser2014; Lee et al. Reference Lee, Sung and Zaki2017). Therefore, the comparison between B02 and LB02 is still useful to assess the domain size effects on the TNTI for large-scale motions at higher Reynolds numbers.
Computational parameters and computational domain size at the end of the simulation for case LB02.

The statistics of the TNTI layer are compared between B02 and LB02. For both cases, the same threshold  $\hat {\omega }_{th}=10^{2.5}$ is used to detect the irrotational boundary. The conditional profiles of mean vorticity
 $\langle \omega \rangle _I$ and its derivative
 $\langle \omega \rangle '_I = -{\rm d}\langle \omega \rangle _I /{\rm d}y_I$ with
 $y_I$ are compared in figure 20(a), which is used to determine the mean thickness of the TNTI layer. The difference between the two cases is very small and is expected to be caused by a different level of statistical convergence because more samples are available in LB02. The conditional profiles of Kolmogorov length scale
 $\eta _I$ are shown in figure 20(b), where
 $y_I$ is normalized by the mean thickness of the TNTI layer,
 $\delta _{TNTI}$. The conditional profile of
 $\eta _I$ hardly differs between B02 and LB02. These results indicate that the conditional statistics of small-scale quantities hardly depend on the domain size larger than
 $2 {\rm \pi}\delta$, which is used in B02.
(a) Conditional mean vorticity and its derivative with respect to  $y_I$. (b) Conditional profiles of Kolmogorov length scale
 $\eta _I$. The different colours of the lines represent cases B02 and LB02.

The domain size effect should also be examined for large-scale characteristics of the TNTI layer. The large-scale properties of the TNTI layer assessed in the present work are fractal dimension  $D$ and surface area
 $A_{IB}$, which are examined by comparing B02 and LB02 in figure 21. Here, figure 21(a) shows the number of boxes needed to cover the irrotational boundary. The results for B02 and LB02 are almost identical, and the fractal dimension is evaluated accurately in B02. Figure 21(b) compares the surface area
 $A_{IB}$ between LB02 and other DNS. The figure also includes DNS results of spatially developing TBL by Borrell et al. (Reference Borrell, Sillero and Jiménez2013). The surface area is also hardly influenced by the domain size. The present DNS results also agree with the spatial TBLs, which are simulated with a large domain size in the streamwise direction. Therefore, the large-scale properties of the TNTI layer in the present study are well resolved within the DNS with
 $Lx\approx 2{\rm \pi} \delta$.
The domain size effects on the fractal analysis and the surface area of the irrotational boundary. (a) Plot of  $N/(L_x/\delta )$ against
 $r_{box}/\delta$, where
 $r_{box}$ is a box size and
 $N$ is the minimum number of boxes with size
 $r_{box}$ for covering the whole irrotational boundary. (b) The surface area of irrotational boundary
 $A_{IB}$ plotted against
 $Re_\theta$. The green triangles represent the results of LB02 (
 $L_x=13.4\delta$), while the orange crosses represent the DNS results of spatial TBLs in Borrell, Sillero & Jiménez (Reference Borrell, Sillero and Jiménez2013).

The influence of the domain size in the direction for which periodicity is assumed has also been discussed in previous studies for channel flow (Lozano-Durán & Jiménez Reference Lozano-Durán and Jiménez2014; Abe, Antonia & Toh Reference Abe, Antonia and Toh2018). Their results show that the computational domain with  $L_x=2{\rm \pi} h$ is large enough to reproduce the one-point statistics of DNS with
 $L_x=4{\rm \pi} h$ or
 $L_x=8{\rm \pi} h$, where
 $h$ is the half-width of the channel. Also, Lozano-Durán & Jiménez (Reference Lozano-Durán and Jiménez2014) observed that the one-dimensional energy spectra in the streamwise direction computed from the medium domain (
 $L_x=2{\rm \pi} h$) agree with those from the larger domain (
 $L_x=4{\rm \pi} h$) until they are truncated at the maximum wavelengths fitting in the domain. This has also been confirmed with the two-dimensional spectrum (Lozano-Durán & Jiménez Reference Lozano-Durán and Jiménez2014), which has been compared between
 $L_x=4{\rm \pi} h$ and
 $L_x=8{\rm \pi} h$. del Álamo et al. (Reference del Álamo, Jiménez, Zandonade and Moser2004) also observed that the resolved part of the velocity spectrum is not strongly affected by the size of the domain. Lozano-Durán & Jiménez (Reference Lozano-Durán and Jiménez2014) found that even the identified
 $uv$ structures with length close to the box size (
 $l_x > 3h$,
 $L_x=2{\rm \pi} h$) are strongly affected by the box size, which is caused by the accumulation of structures that are longer than the box size
 $L_x$, but the
 $uv$ structures with smaller length are not affected by the domain size. Based on these observations, Lozano-Durán & Jiménez (Reference Lozano-Durán and Jiménez2014) argued that even though the large structures with
 $l_x > L_x$ are essentially infinitely long in a small computational domain with
 $L_x \approx 2{\rm \pi} h$ with the periodic boundary conditions, their interaction with the well-resolved scales is represented correctly. This argument was also confirmed by a comparison of two-point correlations between different domain sizes in channel flow, which was also found to be Reynolds-number-independent (Sillero et al. Reference Sillero, Jiménez and Moser2014). These results are also related to the negligible influences of the domain size on the characteristics of the TNTI layer.
In conclusion, the small-scale motions and large-scale properties related to the TNTI in the present work are all well replicated in our present DNS with domain size  $L_x=2 {\rm \pi}\delta$.