In a recent Letter,[Reference Gaither, DelRio, Gates, Fuller and Cook1] a new geometry of test specimen was introduced that enables microscale tensile testing. The specimen, in the form of the Greek letter Θ, consists of a frame with a circular exterior, an interior profile based on two circular arches and a web across the center, and a hat structure at the top, all of which are attached to a macroscale strip at the base. A uniaxial tensile stress state is generated in the web region when the circular exterior is diametrally compressed, enabling tensile fracture strengths to be measured. The circular arches in the frame interior of the new specimen simplified the complex internal geometry of the original theta design[Reference Durelli, Morse and Parks2] and the top hat structure minimized loading misalignments and stress concentrations at the loading point.[Reference Fuller, Henann and Ma3] The arch theta specimen design was an extension of an earlier microscale Durelli theta tensile strength specimen,[Reference Quinn, Fuller, Xiang, Jillavenkatesa, Ma, Smith, Beall and Lara-Curzio4] and has subsequently been used in detailed studies of the effects of microfabrication method and surface finish on tensile strength distributions of single-crystal silicon.[Reference Gaither, DelRio, Gates and Cook5, Reference Gaither, Gates, Kirkpatrick, Cook and DelRio6]
In this Communication, a further variation of the theta specimen is introduced that enables microscale bending strength measurements—the “gap theta”. In the arch design the web section is continuous whereas in the gap design the web section is disjointed, resulting in a bending stress state along the frame periphery and no stress in the web under the same diametral loading scheme. Both arch and gap theta test specimens can be microfabricated simultaneously, enabling direct comparison of tensile and bending strengths of lithographically closely related specimens with the same surface finish, but with significantly different stressing modes and stressed areas. A major motivation for the development of the microscale theta specimen is to enable microelectromechanical systems (MEMS) developers and manufacturers to optimize MEMS component reliability[Reference Gaither, Gates, Kirkpatrick, Cook and DelRio6] using theta specimen measurements to guide design, fabrication, and operating constraints.
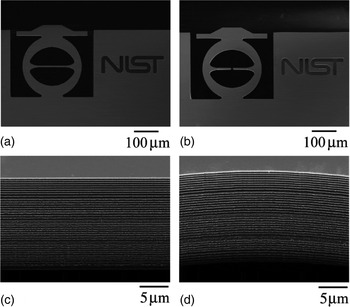
Details regarding the fabrication process and testing method for the arch and gap theta test samples can be found elsewhere.[Reference Gaither, Gates, Kirkpatrick, Cook and DelRio6] Briefly, both test structures were formed on two different 100-mm (001) silicon-on-insulator wafers; the resulting samples from each wafer are henceforth referred to as batches B and C. The 25-μm-thick Si device layers on both wafers were patterned with the same photolithographic mask, such that the web regions of the test specimens were oriented along the 〈110〉 direction. For batch B samples, a Bosch deep reactive-ion etching (DRIE) process was used to produce an anisotropic etch with characteristic etch steps called “scallops”.[Reference Senturia7] For batch C samples, a cryogenic DRIE process was used to create relatively smooth sidewalls.[Reference Tachi, Tsujimoto and Okudaira8] The Si handle layers were patterned and etched with the same Bosch DRIE process. After Si etching, the SiO2 layers were removed with a buffered-oxide etch to create freestanding samples. Field-emission scanning electron microscopy (FESEM) images of arch and gap theta test samples are presented in Figs. 1(a) and 1(b), respectively. Each test strip, consisting of 10 theta samples, was removed from the wafer with a diamond scribe at notched regions. As shown in Figs. 1(c) and 1(d), the etch surfaces in the web and inner theta region exhibit similar features, indicating that the surface finish is probably constant over the entire test structure. Each test specimen was diametrally compressed via instrumented indentation using a 250 µm radius spherical sapphire indenter tip. The specimens were initially cycled twice under load control to 250 mN peak load and then loaded to failure under a target imposed displacement rate of 20 nm/s; a “break-detection” method removed the indenter tip from the specimen on sensing the increased compliance associated with specimen failure. Load P and displacement h were recorded throughout with a data acquisition rate of 100 Hz.
FESEM images of completed arch and gap theta test samples. The (a) arch and (b) gap theta test samples are identical in design, with the exception of a 4-μm gap in the center of the web region. In both etch processes, the sidewall etch surfaces (c) in the web region and (d) at the top and bottom of the inner theta region exhibit similar surface finishes.

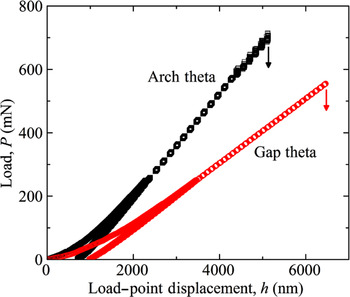
Figure 2 shows characteristic P–h curves for arch and gap theta test specimens loaded to failure. The experimental compliances λ for both the arch and gap theta specimens were determined via best-fit straight lines to the P–h data. For the arch geometry, λ was found to be 6.0 ± 0.2 and 6.4 ± 0.2 nm/mN for batch B and C samples, respectively. The same surface finishes on the gap theta resulted in λ values of 9.7 ± 0.4 and 10.1 ± 0.5 nm/mN, respectively (unless stated otherwise, all quoted experimental uncertainties are one standard deviation of the mean of the sample population). The increased compliance of the gap samples relative to the arch samples, as illustrated by the values above and the decrease in slope in Fig. 2, highlights the load-bearing significance of the web.
Typical P–h data for arch and gap theta test samples loaded to failure. The failure loads and displacements of each sample are indicated by downward arrows.

Three-dimensional finite element analysis (FEA) simulations of loading were performed for each geometry. Simulations were performed with quadratic tetrahedral elements and an iterative mesh refinement using a von Mises stress error indicator to ensure convergence. Both arch and gap theta geometries were simulated and the arch theta results were in agreement with previous results using linear hexahedral elements;[Reference Gaither, DelRio, Gates and Cook5, Reference Gaither, Gates, Kirkpatrick, Cook and DelRio6] quadratic tetrahedral elements were used here because they more readily captured the bending behavior of the gap theta.[Reference Logan9] The orthotropic elastic properties of silicon were used[Reference McSkimin and Andreatch10] with the theta web axis aligned along the 〈110〉 direction. A simulated load of 2.0 N was applied over a 5 µm radius circular region at the center of the top hat (uniform pressure).
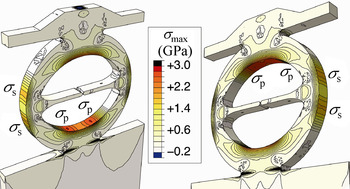
The maximum principle stress σ max in the arch theta specimen was found to be the greatest in the web region; in this region, the stress was essentially invariant and uniaxial along the web axis.[Reference Gaither, DelRio, Gates, Fuller and Cook1, Reference Gaither, DelRio, Gates and Cook5, Reference Gaither, Gates, Kirkpatrick, Cook and DelRio6] Secondary stresses σ s at the top and bottom of the inside arch regions were significantly less than the primary stress σ p in the web (σ s/σ p = 0.62), which points to a clear propensity for initial fracture to occur in the web. In contrast, σ max reached a maximum value along the frame interior in the gap theta specimen, as revealed by the FEA simulations in Fig. 3. The absence of a connected web region changed the test mode from tensile to bending, resulting in four σ p areas in the inner arch region, as well as four σ s areas along the outer wall surrounding the web region. As with the arch theta, the secondary stresses were significantly less than the primary stresses for the gap theta (σ s/σ p = 0.66), indicating that the specimen should fail in one of the four σ p areas.
FEA images of stress distributions for gap theta test samples. The absence of a connected web region changes the test mode from tensile to bending, resulting in four primary σ p areas at the top and bottom of the inner theta region, as well as four secondary σ s areas on the outer wall. P = 0.94 N.

The FEA simulations were also used to relate load P and displacement h to primary stress σ p and strain ɛ p. In the simulations, σ p and ɛ p were linearly related and also linearly related to P and h, respectively, through the theta diameter D, specimen thickness t, and in some cases, web width w. Also, specimen compliance λ was determined at the simulated load. σ p, ɛ p, and λ for the arch and gap theta specimens maintained the following forms:
 $$\sigma _{\rm p}=- K_\sigma P/Dt\comma \;$$
 $$\varepsilon _{\rm p}=-K_\varepsilon h/D\comma \;$$
 $$\lambda=K_\lambda \lambda _{\rm I}\comma \;$$
where K σ, K ɛ, and K λ are geometry-dependent coefficients for the stress, strain, and compliance expressions, respectively, and λ I is the ideal, w = 8 µm, compliance for a given specimen geometry. For the arch theta, σ p and ɛ p were averaged over the entire web region. The resulting values for K σ, K ɛ, and K λ were found to be well-described by K σ = 86.001/w + 3.751, K ɛ = 1.670/w + 0.439, and K λ = 2.309/w + 0.725, where K σ, K ɛ, and K λ are dimensionless and w is in μm.[Reference Gaither, DelRio, Gates and Cook5, Reference Gaither, Gates, Kirkpatrick, Cook and DelRio6]λ I was found to be 5.27 nm/mN. For the gap theta geometry, σ p and ɛ p were found by averaging the 40 largest surface nodal σ max values, 10 from each of the four σ p regions. In this case, K σ, K ɛ, and K λ were not dependent on w and were well-described by the constants K σ = 18.56, K ɛ = 0.554, and K λ = 1. λ I was found to be 8.62 nm/mN, almost a factor of two larger than that for the arch theta. In both cases, the λ values from experimental P–h data such as Fig. 2 were slightly greater than λ values from Eq. (3) due to shear deformation of the test strip relative to the mounting fixture.[Reference Gaither, Gates, Kirkpatrick, Cook and DelRio6]
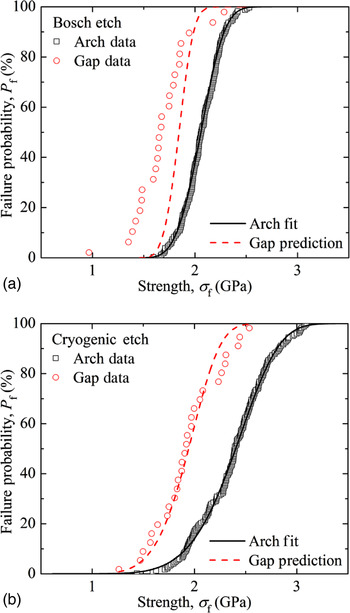
The strength σ f of each sample was determined using the peak load prior to failure with Eq. (1). As fracture strength is limited by flaw size, a distribution of critical flaws from the fabrication sequence results in a σ f distribution for each specimen type and surface finish. For the arch theta, σ f varied from 1.6 to 2.5 GPa for the Bosch etch and from 1.4 to 3.1 GPa for the cryogenic etch. The distribution for the latter was on average slightly greater, but broader, probably due to the heterogeneous surface finish.[Reference Gaither, Gates, Kirkpatrick, Cook and DelRio6] In comparison, the gap theta specimens showed smaller strengths; σ f varied from 1.0 to 2.3 GPa for the Bosch etch and from 1.3 to 2.5 GPa for the cryogenic etch, as shown in Fig. 4. The change in σ f is probably due to a disparity in the stressed area; the stressed area of the arch theta is the surface area of the two web sidewalls, whereas the stressed area of the gap theta is the surface area of the inner and outer of the theta periphery. In addition, there is a change in the stress state; the arch theta puts the web in tension, while the gap theta places the frame periphery in bending. [Fractographic observations of fragments retrieved from failed gap theta samples showed evidence (mirror patterns, hackle lines, compression curl, and fragment shape) of surface-initiated bending failure in the primary and secondary (see Fig. 3) stress regions of the sample. However, although strongly suggestive, due to the more extensive damage and greater diversity of failure sites of the gap specimens compared with the arch specimens, it was not possible to determine unambiguously that the identified failure sites were the initial locations of failure, rather than the location of subsequent postfailure fragmentation events.] Hence, to examine both sets of strength data, it is necessary to use a statistical model that accounts for changes to both the stressed area and stress state while maintaining ties to the same size-invariant materials properties. The Weibull model[Reference Weibull11] is used here, first to extract the size- and geometry-invariant materials properties from the arch theta data, then to deduce the effective stressed area from the gap theta data.
Strength distributions and corresponding three-parameter Weibull failure probability plots for arch and gap theta test specimens with the (a) Bosch and (b) cryogenic DRIE etching processes. Number of arch theta strength tests: (a) 198 and (b) 209.

For arch theta specimens, the web region is in uniaxial tension and failure initiates at surface flaws.[Reference Gaither, DelRio, Gates and Cook5, Reference Gaither, Gates, Kirkpatrick, Cook and DelRio6] Consequently, the cumulative failure probability P f is described by the three-parameter Weibull distribution function given by[Reference Todinov12]
 $$P_{\rm f}=1 - \exp \left\{{ - \mu \left[{L_{\rm t} t\left({\displaystyle{{\sigma _{\rm f} - \sigma _{{\rm th}} } \over {\sigma _{\rm o} }}} \right)^m } \right]} \right\}\comma \;$$
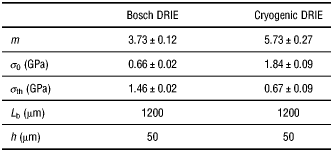
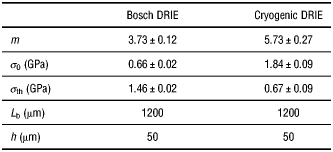
where μ is the number density of strength-limiting flaws per area, L t is the effective tensile length, m is the Weibull modulus, σ 0 is the scaling strength, and σ th is the threshold strength. P f is assigned to each σ f value by P f = (i − 0.5)/N, where i is the rank of the strength in an ascending-order ranked strength distribution and N is the number of samples. In addition, L t and t are inferred from the web dimensions and the propensity of the strength-limiting flaws to be located on the sidewall surfaces; L t is 330 µm, or twice the length of the web, and t is 25 µm, or the thickness of the Si device layer. However, in homogeneous tension L t and t are not needed in Eq. (4), as μ = 1/L tt, resulting in P f = 1 − exp{ − [(σ f − σ th)/σ 0]m}. As a result, m, σ 0, and σ th are the lone fitting parameters, found via least-squares fitting; the solid black lines in Fig. 4 and the data in Table I represent the best-fit plots and values, respectively.
Three-parameter Weibull distribution fit parametersa for arch (m, σ 0, σ th) and gap (L b, h) theta specimens.
aUncertainty values denote a 68% confidence level in the fit.
For the gap theta specimens, the stress state exhibits considerable variability along the frame periphery, and, although failure still initiates at surface flaws, the cumulative failure distribution of Eq. (4) cannot be used. In principle, knowledge of the stress field over the entire specimen, such as that obtained from FEA, enables the failure distribution to be calculated by numerical integration of the failure probability for each element of the specimen (e.g. as in the CARES program[Reference Nemeth, Manderscheid and Gyekenyesi13]). Such an integration is beyond the scope of this Communication, but an estimate of the predicted failure distribution can be made by assuming an approximate, simple form for the stress distribution. An assumption of pure bending of a flat beam gives the modified three-parameter Weibull function as[Reference Weil and Daniel14]
 $$P_{\rm f}=1 - \exp \left\{{ - \mu \left[{L_{\rm b} \left({\displaystyle{h \over {m+1}}\left({1 - \displaystyle{{\sigma _{{\rm th}} } \over {\sigma _{\rm f} }}} \right)+t} \right)\left({\displaystyle{{\sigma _{\rm f} -\sigma _{{\rm th}} } \over {\sigma _{\rm o} }}} \right)^m } \right]} \right\}\comma \;$$
where L b and h are the effective bending length and height, respectively. The dashed red lines in Fig. 4 are predictions for the gap strength distributions using Eq. (5), m, σ 0, σ th, and μ from the arch theta specimens, and L b = 1200 µm and h = 50 µm, the latter two obtained from an approximate fit to the cryogenic etch gap theta data. These latter values compare with ≈1100 µm for the length along the frame surface of material under tension, both inside (primary stress region, Fig. 3) and outside (secondary stress) of the frame, and ≈45 µm for the height of the arch, not including the hat. The cryogenic etch gap specimen strength distribution is well described by the parameters given in Table I and Eq. (5), but this is not the case for the Bosch etch gap data. In fact, several strength values for the Bosch etch gap samples are less than the threshold strength for the Bosch arch data, suggesting that an additional, weaker, flaw population may have been introduced in the Bosch etch samples. The assumed loading geometry includes two countervailing approximations: Pure bending leads to an underestimate of the stressed area and an initially flat beam leads to an overestimate of the stressed area. Notwithstanding the approximations of geometry and invariant flaw populations, the agreement between the inferred and actual specimen dimensions suggests that the gap theta specimens were most likely weaker as greater area was stressed.
In summary, a new gap theta specimen was introduced that enables microscale bending strength measurements. The new specimen implements a simple lithographic modification to the previously developed arch theta specimen, leading to significant structural changes in which imposed loads are supported by bending rather than tensile stress. The new specimen extends the earlier demonstration of instrumented indentation to measure MEMS-scale bending strengths[Reference Weihs, Hong, Bravman and Nix15] to enable direct comparison of bending and tensile strengths of identically fabricated samples. The gap specimen was demonstrated here on single-crystal Si samples microfabricated using two different DRIE processes. For both DRIE processes, the gap theta specimens exhibited strength distributions approximately 0.5 GPa weaker than the corresponding arch theta specimens. As an example, the gap theta strengths were described by three-parameter Weibull distributions derived from parameters approximated using the arch theta strengths. The gap theta specimen thus provides an additional test method for assessing and enhancing MEMS reliability and establishing processing–structure–-properties relations at the micro- and nanoscales. To quantitatively validate the method, larger numbers of gap theta strength test samples (to enable statistically meaningful comparison of gap and arch strength distributions) and FEA-based Weibull scaling methods (to account for the full inhomogeneity of the stress field in the gap specimen) are required, and will be the subject of future work.
Acknowledgments
The authors thank George D. Quinn at the National Institute of Standards and Technology (NIST) for guidance with Weibull statistics. Research was performed in part at the NIST Center for Nanoscale Science and Technology. Certain commercial equipment, instruments, or materials are identified in this report to specify the experimental procedure adequately. Such identification is not intended to imply recommendation or endorsement by NIST, nor is it intended to imply that the materials or equipment identified are necessarily the best available for the purpose.