INTRODUCTION
Tephra beds are useful tools in the earth and environmental sciences, provided they can be readily identified and their ages determined (Lowe, Reference Lowe2011). They typically form prominent spatial and temporal marker beds that facilitate correlation of sedimentary deposits, sometimes on a continental scale (Preece et al., Reference Preece, Pearce, Westgate, Froese, Jensen and Perkins2011), and provide insights into the nature and magnitude of volcanic eruptions, dispersal mechanisms, hazard mitigation, horizons of significance for archaeological characterization (WoldeGabriel et al., Reference WoldeGabriel, Haile-Selassie, Renne, Hart, Ambrose, Asfaw, Heiken and White2001), and more. Distal occurrences preserved in sedimentary basins are also excellent recorders of the tempo of volcanism and associated compositional changes—evidence that is commonly lost due to erosion or burial in the source areas.
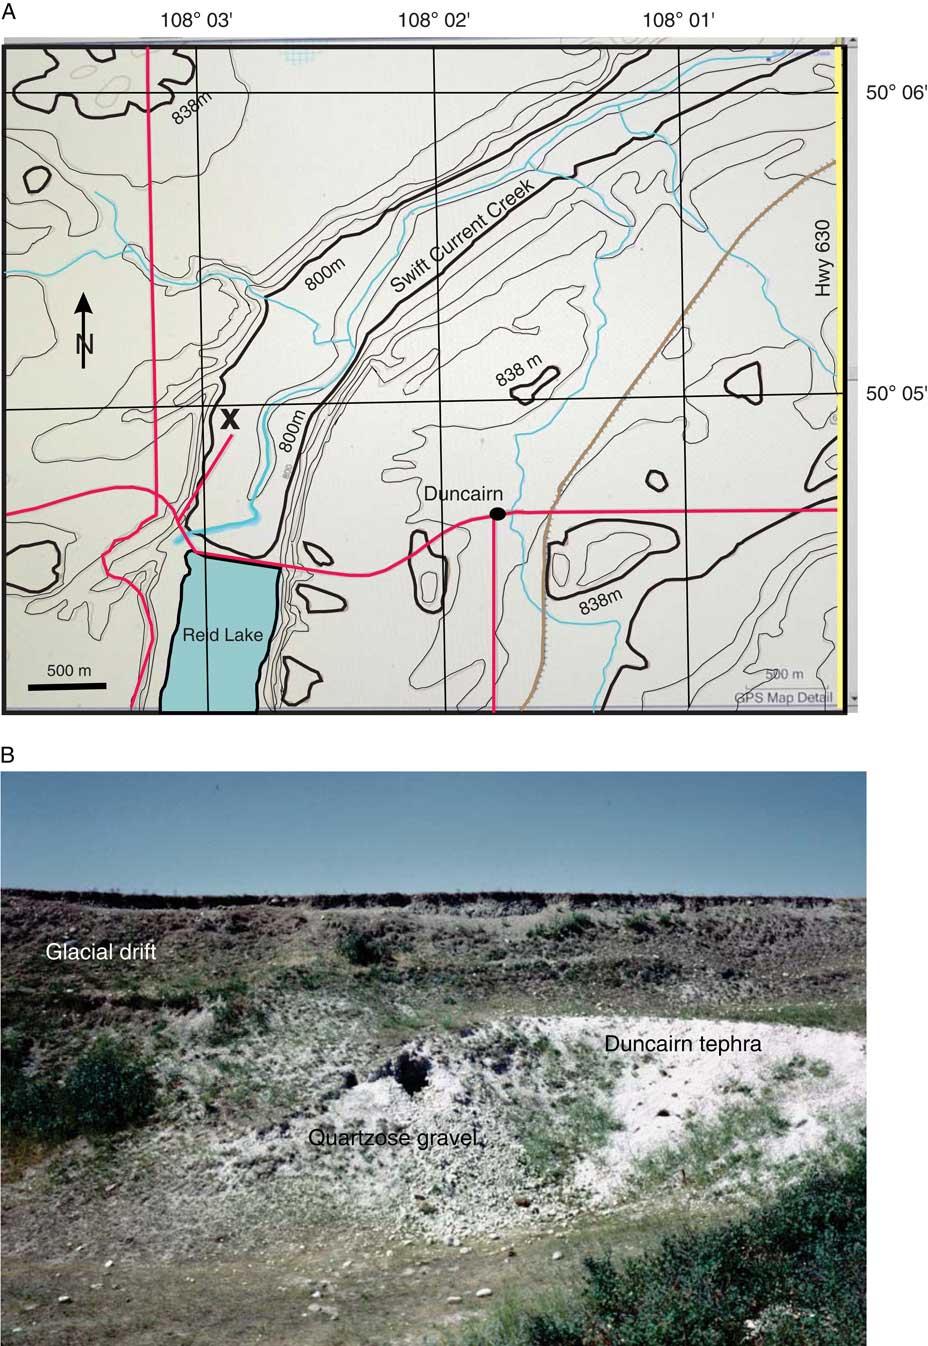
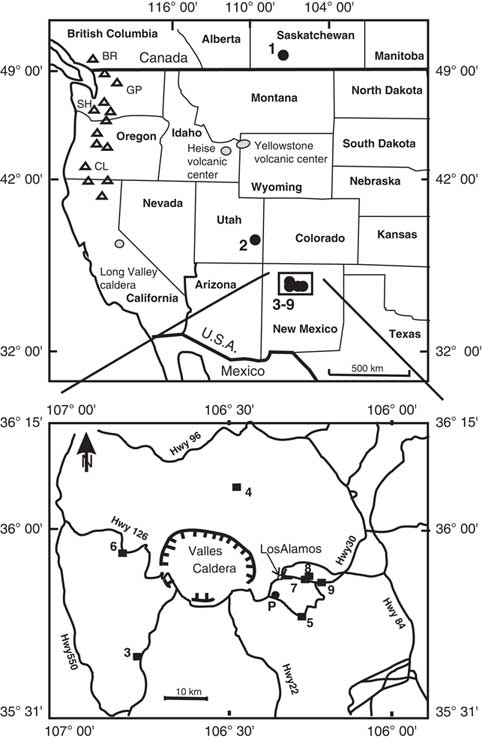
Several tephra sites in southwestern Saskatchewan are described by Fraser et al. (Reference Fraser, McLearn, Russell, Warren and Wickenden1935), and one of these sites, a gravel pit near Duncairn, was visited by JAW in 1971 with the aim of collecting Late Cretaceous tephra beds for K-Ar dating. The stratigraphy at this gravel pit, approximately 100 km north of the U.S. border, suggested a younger age for the tephra bed, named Duncairn tephra (Dt), so the stratigraphic sequence was only briefly described and photographed (Fig. 1), including collection of a large sample (~10 kg) of Dt (UA389), which is up to 3 m thick. A source in the Yellowstone hot spot track seemed likely, given the proximity of the Duncairn site relative to other major volcanic centers in the western United States (Fig. 2) and that tephra beds from this source are several meters thick in adjacent northern Montana (Westgate et al., Reference Westgate, Pearce, Perkins, Shane and Preece2011).
Geomorphic and stratigraphic setting of Duncairn tephra, Saskatchewan, Canada. (A) Location of tephra site is marked by an “X” at the western bank of Swift Current Creek, just north of Reid Lake. (B) Exposure in gravel pit near Duncairn as it appeared in 1971. The tephra bed has a maximum thickness of 3 m, is covered by 2.5 m of glacial drift, and underlain by more than 1.5 m of brown quartzose gravel. Sample UA389 comes from the middle of the tephra bed. See Fig. 2 for a broader-scale setting of this site.

Map of sample locations (filled circles in upper figure and filled squares in lower figure). Triangles represent major tephra-producing Pleistocene volcanoes of the Cascade arc. BR is Bridge River, GP is Glacier Peak, SH is Mount St. Helens, and CL is Crater Lake, the source of Mazama tephra (see Fig. 2). Map numbers with location details are given in Table 3.

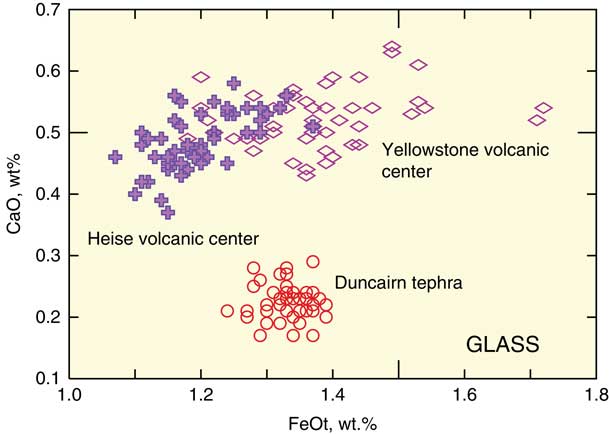
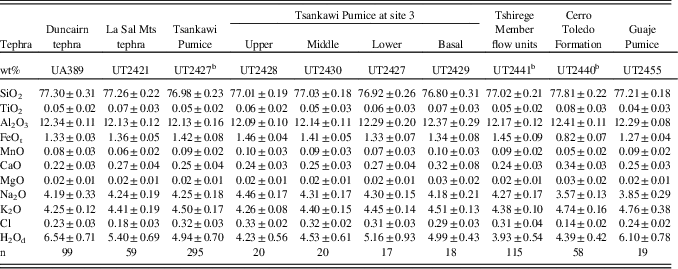
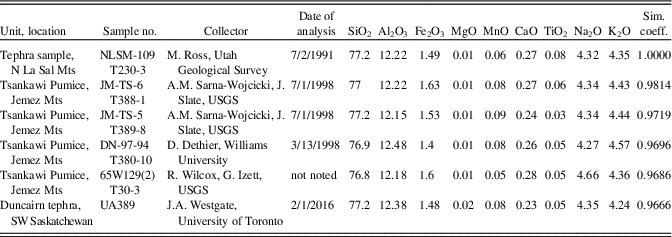
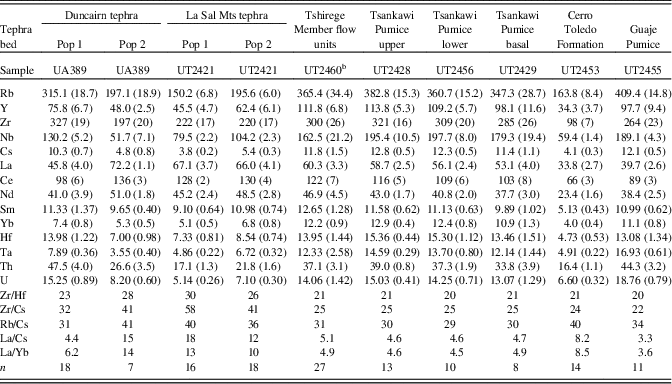
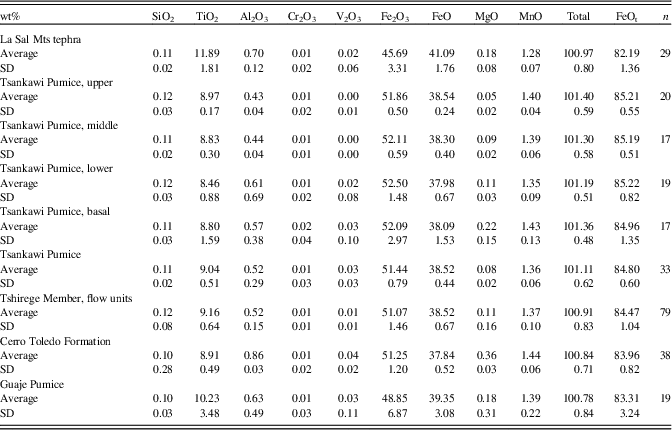
Field studies in Wyoming and Idaho at the younger end of the Yellowstone hot spot track were conducted in 2012 with the objective of finding a correlative of Dt. The major-element composition of glass shards in these samples shows none to be equivalent to Dt; their CaO and K2O contents are higher (Fig. 3, Supplementary Table 1). Therefore, a source within the Yellowstone and Heise volcanic fields is highly unlikely (Fig. 2). Recent analysis of glass shards from a 50-cm-thick tephra bed (UT2421), collected by RWB in 2015 in the La Sal Mountains of Utah, revealed very low concentrations of CaO similar to Dt. The major-element compositions of glass shards from these two tephra beds are remarkably similar (Table 1) and suggest a more southerly source in the Jemez Mountain volcanic field of New Mexico. Earlier studies by ASW established the presence of tephra (Tsankawi Pumice) from this source in the La Sal Mountains (Table 2), and Slate et al. (Reference Slate, Sarna-Wojcicki, Koning, Wan, Wahl, Connell and Perkins2013) noted the Tsankawi Pumice in central Utah.
CaO–FeOt plot showing the distinction in composition of glass shards of Duncairn tephra to those of tephra beds from the two younger volcanic centers of the Yellowstone hot spot track.

Average composition of glass shards from Duncairn and La Sal Mountains tephra beds compared with tephra beds from Valles caldera, New Mexico, USA.Footnote a

a Operating conditions specified in “Methods.” Analyses recast to anhydrous values; H2Od is water by difference; one standard deviation is given; n is number of analyses. Accuracy is monitored by analyses of ATHO-G glass and analyses of individual glass shards are given in Supplementary Table 4.
b Tsankawi Pumice average values based on samples UT2427, UT2428, UT2429, UT2430, UT2432, UT2433, UT2434, UT2436, UT2437, UT2438, UT2443, UT2444, UT2446, UT2449, UT2456, and UT2457; pyroclastic flows of Tshirege Member on samples UT2441, UT2447, UT2458, UT2460, UT2431, UT2435 taken from the lower part of the unit (Qbt-1g); Cerro Toledo Formation on samples UT2440, UT2451, and UT2453 from upper part of unit; and Guaje Pumice sample is from the base. See Fig. 2 and Table 3 for location of samples. Tsankawi Pumice is 1 m thick at site 3.
Electron-microprobe analysis of glass shards of a tephra bed from the La Sal Mountains in Utah compared with samples of the Tsankawi Pumice of the Tshirege Member of the Bandelier Tuff, erupted from the Jemez Mountains, New Mexico, USA.Footnote a

a Tephra sample collected by M. Ross was submitted to the USGS, Tephrochronology Laboratory, Menlo Park, California, by Grant Willis, Utah Geological Survey. Analyses of USGS samples by Charles E. Meyer and James Walker performed on a JEOL8900 microprobe using methods described by Sarna-Wojcicki et al. (Reference Sarna-Wojcicki, Reheis, Pringle, Fleck, Burbank, Meyer and Slate2005). Oxide totals are recalculated to 100% to eliminate effects of variable amounts of water of hydration. Sim. Coeff. Is similarity coefficient. UA389 analyzed by J. Westgate using a JEOL JXA-8230 microprobe at the University of Toronto (see “Methods”). USGS analyses taken from Slate et al. (Reference Slate, Sarna-Wojcicki, Wan, Dethier, Wahl and Lavine2007, Reference Slate, Sarna-Wojcicki, Koning, Wan, Wahl, Connell and Perkins2013).
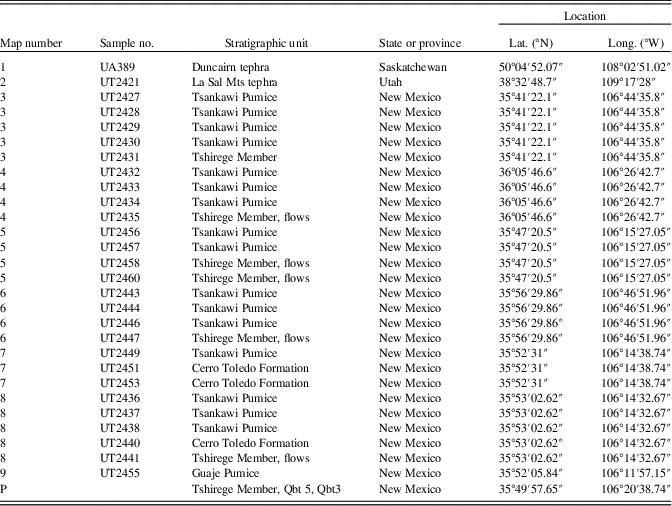
This postulated source for the Dt implies an unusual trajectory of northward tephra dispersal over a distance of approximately 1500 km (Fig. 2). Consequently, a multifaceted approach was initiated to establish with confidence the source and age of the Dt. Field studies in the Valles caldera region of New Mexico were conducted in 2016 to collect samples from all the major stratigraphic units of the Bandelier Tuff. The location of these samples is shown in Figure 2 and Table 3. Methods used to characterize these samples include grain-size analysis, mineral assemblage, glass and mineral composition, paleomagnetism, and fission-track age determinations in conjunction with the results of field studies by others (Self et al., Reference Self, Goff, Gardener, Wright and Kite1986, Reference Self, Heiken, Sykes, Wohletz, Fisher and Dethier1996). We show that the source of the Dt and the La Sal Mountains tephra (LSMt) is indeed located in the volcanic field of the Jemez Mountains in New Mexico.
Locations of sites at which samples were collected.Footnote a

a P is the road cut along which several samples were collected for paleomagnetic analysis. See Fig. 2 for map of sample locations and Supplementary Table 3 for location and stratigraphic details of the samples collected for paleomagnetic study. UA389 is located in sec. 19, tp. 13, range 15, W 3rd Meridian (Fraser et al., Reference Fraser, McLearn, Russell, Warren and Wickenden1935); the digital designation is approximate.
METHODS
The bulk tephra samples were sieved to obtain the 0.25–0.125 mm size fraction and then ultrasonically cleaned for 10 min, dried, and sieved again to concentrate the coarsest material. Minerals were separated from glass, and pumiceous glass from platy and bubble-wall glass shards using a Frantz isodynamic magnetic separator. The bubble-wall glass fraction was used for compositional analysis and age determination. Due to its very fine grain size, samples of Dt underwent different analytical preparation. The weakly indurated Dt was broken up into small blocks and immersed in water treated with a dispersant (sodium hexametaphosphate) and left for several months. The disaggregated tephra was dried, and unbiased splits were produced using a multichannel hopper. The grain-size distribution of these samples was then determined using a Mastersizer 3000 system with Frauhofer scattering. Another part of the dried sample was sieved to recover the coarsest material for reliable compositional analysis. Glass and mineral separates of all samples were then mounted in resin blocks and polished for major- and trace-element analyses.
Major-element concentrations in glass and minerals were determined using a JEOL JXA-8230 Electron Probe Micro-Analyzer with 5 wave-length-dispersive X-ray spectrometers and 1 energy-dispersive X-ray spectrometer at the University of Toronto. Operating conditions for glass and feldspars were 15 kV accelerating voltage, 6 nA current, and 10 µm beam diameter. The corresponding values for FeTi oxides are 15 kV, 20 nA, and 1 µm, and for chevkinites they are 15 kV, 30 nA and 1 µm. Reference materials used for calibration are given in Supplementary Table 2. The MPI-DING ATHO-G reference glass (Jochum et al., Reference Jochum, Stoll, Herwig, Willbold, Hofmann, Amini and Aarburg2006) was used to monitor accuracy of the glass (majors and traces) and feldspar analyses, and the L4-175 magnetite standard (Anderson, Reference Anderson1968) was used for the FeTi oxides.
Trace elements were analyzed using the laser ablation inductively-coupled mass spectrometry system at the Department of Earth Sciences, University of Toronto. This consisted of a New Wave UP-213 (solid-state frequency quintupled Nd-YAG laser) laser ablation microscope connected to a VG PQ-Excell quadrupole ICP-MS. Helium was used as the transfer gas at a rate of 1000 cc/min, and the plasma was tuned to achieve oxide production of less than 2% monitoring ThO+/Th+ (masses 248/232) and U+/Th+ (masses 238/232) as close as possible to unity. Samples were analyzed for 80 s, of which the first 20 s consisted of background. The sample cell was flushed for a minimum of 60 s between each analysis. Up to 20 glass shards from each sample were analyzed in batches, with NIST610 being analyzed at the beginning and end of each batch. ATHO-G was also analyzed in each batch as a reference standard. Laser conditions for NIST610 analysis were 10 Hz repetition rate with a 55 µm spot in lines approximately 300 μm long. Glass shards and ATHO-G were analyzed using 25 µm spots as lines 70–100 µm long with the same 10 Hz repetition rate and a scan speed of 20 µm/s. Fluence values ranged from 9.4 to 9.9 J/cm2 within each run. The resultant time-resolved data were reduced offline using the Glitter v. 5.3 software package (MacQuarie Research). Elements were quantified using NIST610 (Pearce et al., Reference Pearce, Perkins, Westgate, Gorton, Jackson, Neal and Chernery1997), and ablation yields were corrected using SiO2 (anhydrous) values obtained by electron microprobe analysis. This procedure gave a bulk composition for each glass shard, with fractionation effects being minimized, if present, by the shallow penetration of the laser. The smaller shards of Dt required deeper ablation, producing ~30-µm-diameter craters. Good agreement with ATHO-G glass was achieved, with the exception of Nb and Ta for some samples.
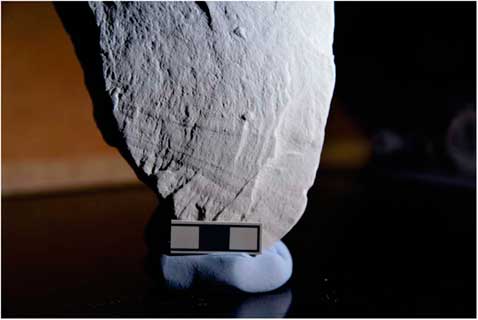
Seven oriented blocks of the Tshirege Member (Qbt 5 and Qbt 3; see Goff et al. [Reference Goff, Warren, Goff and Dunbar2014] for nomenclature and classification of the Tshirege Member of the Bandelier Tuff) were collected a few kilometers east of the Valles caldera (Fig. 2, Supplementary Table 3). Cores measuring 2.45 by 2.45 cm were drilled from the blocks, and paleomagnetic measurements, using a Schonstedt TD-1 AF demagnetizer and a modified DIGICO spinner magnetometer with sensitivity of ~1×E-3 A/m, were carried out at the University of Toronto Mississauga (UTM). Seven cores of Dt were drilled from unoriented blocks collected in 1971. A visit to the Duncairn site in 2008 by JAW to get oriented samples failed to locate the tephra due to post-1971 construction. Fortunately, some blocks contained graded bedding (Fig. 4) that indicated orientation and allowed at least the polarity of the magnetic inclination to be measured. The Dt cores were too weakly magnetic for the UTM spinner and were measured on a 2G Enterprises DC-SQUID magnetometer at the University of Windsor with a sensitivity of ~1×10⁻⁹ A/m. Both alternating-field (AF) and thermal demagnetization were performed, using a Sapphire Instruments SI-4 demagnetizer and a Magnetic Measurements MMTD-1 oven, respectively.
Graded bedding in an unoriented block of Duncairn tephra (UA389) demonstrating top of specimen (top of image) and allowing the remanent magnetic polarity to be determined. Scale is 3 cm long.

Samples for paleomagnetic analysis of the LSMt were collected in the field. Polycarbonate plastic cylinders were horizontally inserted into the cleaned vertical face of the tephra and then oriented by magnetic compass. Remanence measurements were carried out at the University of Lethbridge using a JR-6A spinner magnetometer. AF demagnetization was done on an ASC Scientific D-2000 AF demagnetizer with a three-axis manual tumbler. All obtained paleomagnetic data were processed by principal component analysis (Kirchvink, Reference Kirchvink1980) to find linear segments corresponding to components of magnetization.
The glass-fission-track method used to determine the age of LSMt is the zeta calibration method, which is based on analysis of age standards (Hurford and Green, Reference Hurford and Green1983; Wagner and Van den Haute, Reference Wagner and Van den Haute1992). The age standard used is the Moldavite tektite glass (Lhenice locality) with a 40Ar/39Ar plateau age of 14.68±0.11 (2σ) Ma (Di Vincenzo and Skala, Reference Di Vincenzo and Skala2009). The population-subtraction variant was used (Westgate, Reference Westgate2015), and correction for partial track fading was carried out using the diameter correction method (Sandhu and Westgate, Reference Sandhu and Westgate1995). Ages were calculated using λD=1.551×10⁻¹⁰/yr. Zeta value is 308±3 based on 7 irradiations at the McMaster Nuclear Reactor, Hamilton, Ontario, using the NIST SRM 612 glass dosimeter and the Moldavite glass. Area was estimated using the point-counting technique (Naeser et al.,Reference Naeser, Westgate, Hughes and Péwé1982). An internal age standard (Huckleberry Ridge tephra) was dated to monitor the accuracy of the neutron fluence estimate.
RESULTS
Description of distal tephra beds
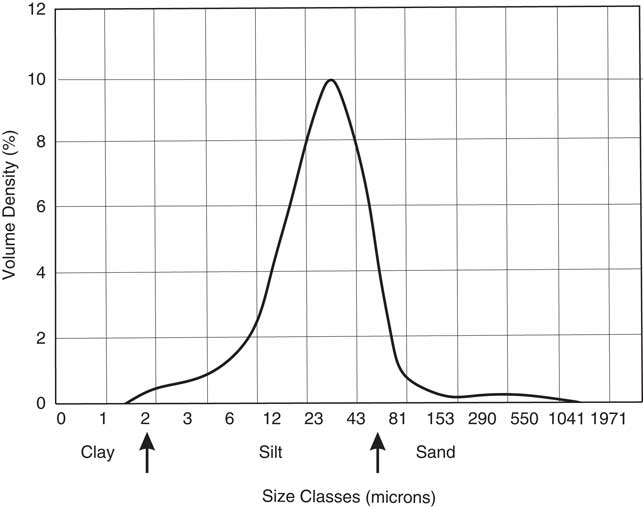
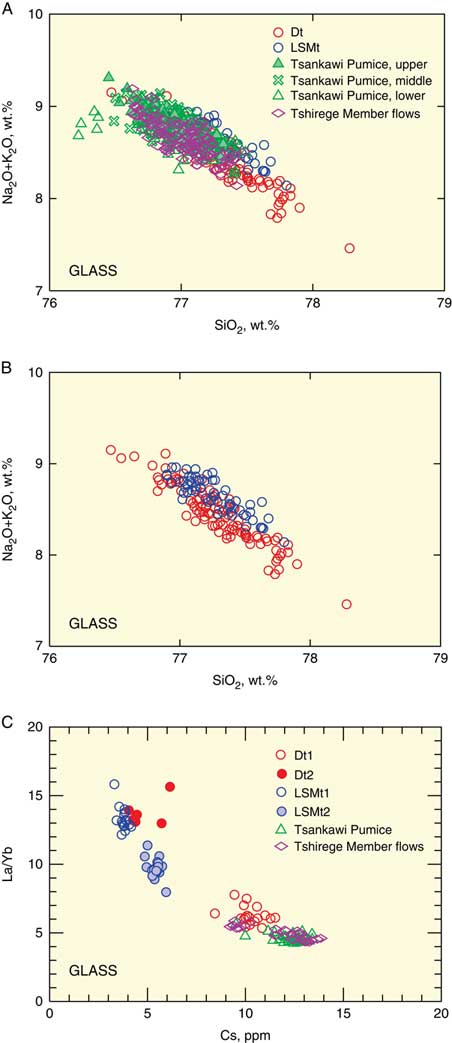
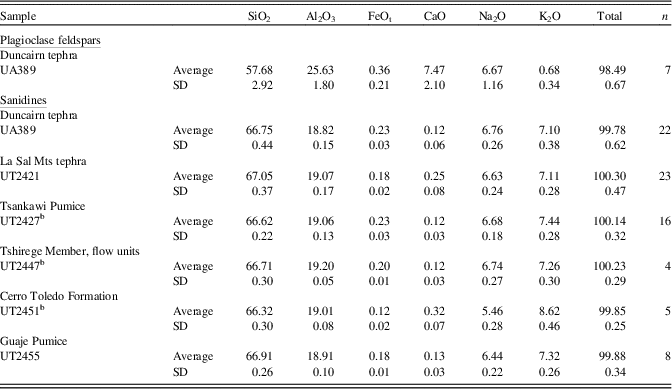
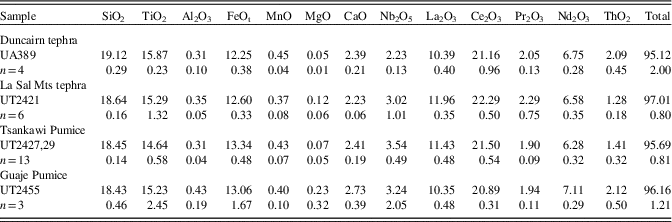
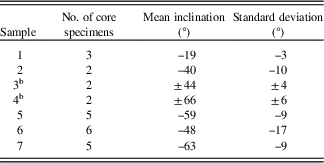
Dt is exposed on the western bank of Swift Current Creek, where it rests on brown, quartzose gravel and is overlain by glacial drift (Fig. 1). It is a very fine-grained ash with a unimodal size distribution and a modal grain size of 28 µm (Fig. 5). It has 10% very fine sand, 87% silt, and 3% clay-sized grains. Its 3 m thickness is not primary but the result of tephra being reworked into a pond—a waterlaid origin being indicated by the presence of well-defined bedding, laminations, graded bedding (Fig. 4), small-scale normal faulting, and flame structures. Dt is extremely pure despite having been reworked. Glass is the dominant phase; minerals are present but sparse. They include quartz, plagioclase feldspar, sanidine, and chevkinite based on electron microprobe analyses. Dt (UA389) is a high-silica rhyolite with a SiO2 content of ~77 wt% (anhydrous), an unusually low CaO content of ~0.2 wt%, an average alkali ratio (Na2O/K2O, wt/wt ratio) close to unity (Table 1, Supplementary Table 4), and a relatively large range in concentration of total alkalies (Fig. 6A and B). Trace-element concentrations in its glass shards show two compositional populations (Table 4, Supplementary Table 5). Population Dt1 has significantly higher U, Th, Zr, Cs, Y, and Rb but lower La and Ce than Dt2, and the two populations are widely separated in the La/Yb–Cs compositional space (Fig. 6C). Plagioclase feldspars are in the compositional range of andesine to labradorite (Table 5, Supplementary Table 6), and the alkali feldspars are classified as sanidines based on their end member composition of Or42 (Table 5, Supplementary Table 6). Only a single, very distinctive titanomagnetite grain with attached glass was found, so its significance remains uncertain (Supplementary Table 7). Several grains of chevkinite, a light rare-earth silicate, were also found, and their composition is shown in Table 6 and Supplementary Table 8. Paleomagnetic directional data were measured as another means of comparing the Dt to other tephra beds of this study. Despite being weakly magnetized, the Dt exhibited univectorial behavior using both AF and thermal demagnetization (Supplementary Fig. 1). All stably magnetized samples, whose way-up was defined by graded bedding, yielded negative inclinations averaging −48°±16° (Tables 7 and 8), indicating a reversed magnetic polarity. Numerical age definition by glass-fission-track methods was not possible because of the fine-grained nature of the tephra.
Frequency grain-size distribution of Duncairn tephra (UA389) using a Mastersizer 3000 system with Frauhofer scattering. Arrows indicate the boundaries of the clay/silt and silt/sand size fractions. Volcanologically, the entire deposit would be classified as “ash.”

(A) Total alkalies–SiO2 (TAS) plot showing that some Dt glass shards are the most evolved. The observed compositional trend is compatible with fractional crystallization of sanidine. (B) TAS plot showing just the Dt and LSMt, clarifying their compositional overlap with the Tsankawi Pumice and Tshirege Member flows. (C) La/Yb–Cs plot showing two groups, the one with Dt1 being the more evolved. Dt2 and LSMt make up the less evolved group.

Selected average trace-element concentrations (ppm) and ratios of glass shards of Duncairn and La Sal Mountains tephra beds compared with tephra beds from Valles caldera, New Mexico, USA.Footnote a

a Operating conditions specified in “Methods.” 1σ values are in parentheses. n is the number of analyses. Pop means population. Accuracy of analyses monitored by ATHO-G glass and details of the trace-element composition of glass shards are given in Supplementary Table 5. UT2453 is from the upper part of the Cerro Toledo Formation and UT2455 is from the base of the Guaje Pumice.
b Value for Tshirege Member flow units is average of UT2460 and UT2435.
Average major-element composition (wt%) of feldspars in Duncairn and La Sal Mountains tephra beds compared with tephra beds from Valles caldera, New Mexico, USA.Footnote a

a Operating conditions are the same as those used for glass analyses. Major-element analyses of all samples are shown in Supplementary Table 6, which also shows accuracy of analyses using the ATHO-G glass standard as well as CIPW norm values. TiO2 , MnO, and MgO values are <0.05 wt%; they are not given here but are shown in Supplementary Table 6. Plagioclase feldspars in Duncairn tephra are in the compositional range of andesine to labradorite. SD is standard deviation.
b Tsankawi Pumice average based on samples UT2427, UT2434, UT2433, UT2457, UT2449, UT2437, UT2436, UT2450, and UT2456; Tshirege Member flows on UT2447, UT2460, and UT2435; and Cerro Toledo Formation on UT2451 and UT2453. n is number of analyses.
Average concentrations of selected elements in chevkinites of Duncairn tephra, La Sal Mountains tephra, and tephra beds from Valles caldera, New Mexico, USA.Footnote a

a Operating conditions specified in “Methods.” Analyses in wt% and FeOt is total iron as FeO. Average and standard deviation is given for each tephra bed. Individual analyses given in Supplementary Table 8.
Inclination of remanent magnetization for Duncairn tephra.Footnote a

a Average inclination is -48°±16°; n=7
b Way-up determination is ambiguous.
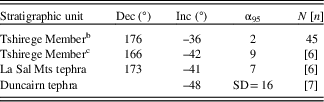
Mean paleomagnetic directions for Duncairn and La Sal Mountains tephra beds compared with Tshirege Member of the Bandelier Tuff.Footnote a

a Dec and Inc are declination and inclination of remanent magnetization, respectively. N is number of sites; n is number of samples; SD is standard deviation; and α95 is the radius of the 95% confidence oval about the mean. No declination for Duncairn tephra, because samples are unoriented.
b Data from Sussman et al. (Reference Sussman, Lewis, Mason, Geissman, Schultz-Fellenz, Olivia-Urcia and Gardner2011). For a -40° inclination at the Valles caldera, the expected inclination for a dipole field at the latitude of the Duncairn tephra is -53°.
c See Supplementary Table 3 for details on samples.
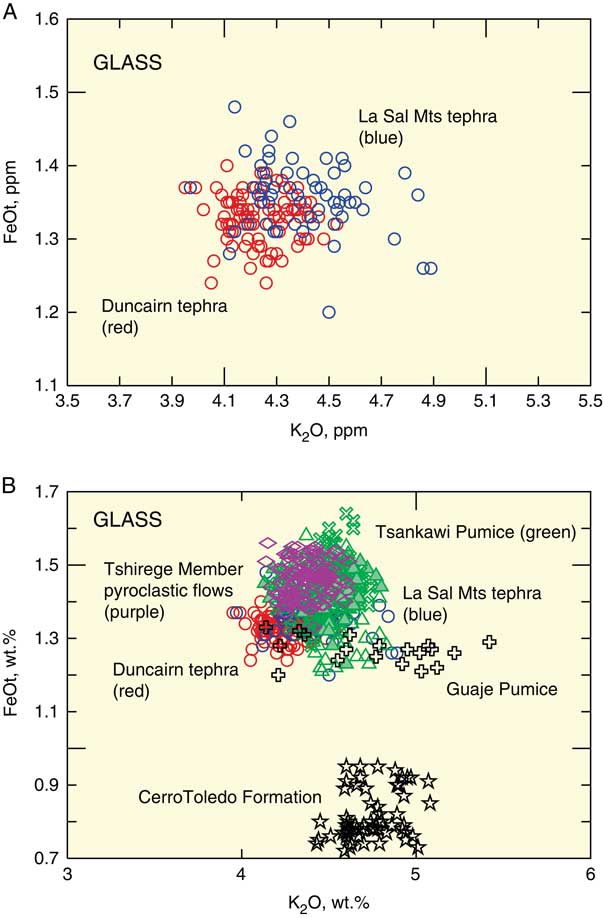
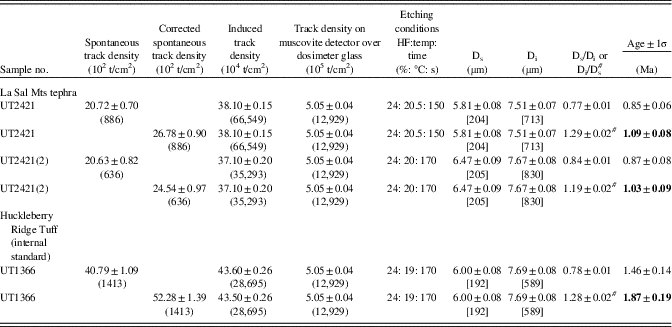
LSMt (UT2421) is exposed on the La Sal Loop Road at an elevation of ~2000 m in the La Sal Mountains of southeastern Utah (Fig. 2, Table 3). It crops out near the surface, has a maximum thickness of 50 cm, and is covered by a paleosol above which occurs soliflucted colluvium. This sequence is underlain by a 1-m-thick red-brown paleosol developed in 2 m of till, which, in turn, is underlain by another paleosol in weathered loess. The tephra is coarser-grained than Dt, bubble-wall and platy glass shards are abundant, and the mineral assemblage is similar to that of Dt, although titanomagnetite is present (Table 9, Supplementary Table 7). The average major-element glass composition is similar to that of Dt (Table 1), but some of its individual glass shards plot away from those of Dt on a FeOt–K2O diagram (Fig. 7A). Trace-element concentrations in its glass define two populations based mainly on differences in Rb, Y, and Nb (Table 4). This dichotomy can be seen in the La/Yb–Cs plot (Fig. 6C)—a figure that also shows Dt2 positioned close to the LSMt. No high-U glass has been found in the LSMt, unlike the Dt. Plagioclase is absent, but sanidine is present and close in composition to that of Dt (Table 5, Supplementary Table 6). Chevkinites in Dt and LSMt have similar compositions (Table 6, Supplementary Table 8). Mean paleomagnetic directions are 173° declination and −41° inclination, demonstrating a reversed magnetic polarity for LSMt (Table 8), which is compatible with the glass-fission-track age of 1.06±0.06 Ma (1σ) given the associated error (Table 10). The two beds underlying LSMt are also reversely magnetized.
Average composition on titanomagnetites in La Sal Mountains tephra compared with those in tephra beds from Valles caldera, New Mexico, USA.Footnote a

a Operating conditions specified in text. Fe2O3 values determined by the procedure of Carmichael (Reference Carmichael1967). Total iron measured as FeOt . Analyses of individual crystals given in Supplementary Table 7. Accuracy of analyses is monitored by standard L4-175 (Anderson, Reference Anderson1968). SD is standard deviation.
FeOt – K2O plots showing variation in composition of glass shards belonging to the Duncairn and La Sal Mountains tephra (Dt and LSMt) beds compared with tephra beds from the Valles caldera, New Mexico. (A) The compositional space occupied by the LSMt differs from that of Dt. although there is considerable overlap. (B) The Tsankawi Pumice, Tshirege Member flows, LSMt, and part of Dt have overlapping glass compositions, but the Cerro Toledo Formation and Guaje Pumice each has a distinctive composition. Sampling was done in the lower part of the Tshirege Member flows, the basal part of Guaje Pumice, and the upper part of the Cerro Toledo Formation.

Glass-fission-track age of La Sal Mountains tephra, Utah, USA.Footnote a

a See “Methods” for further details. Number of tracks counted is given in parentheses; number of tracks measured is given in square brackets. Ds is mean spontaneous track diameter; Di is mean induced track diameter. Ages in bold font are those corrected for partial track fading (PTF); other ages are uncorrected for PTF. 40Ar/39Ar age of Huckleberry Ridge Tuff is 2.003±0.014 Ma (2σ error) (Gansecki et al., Reference Gansecki, Mahood and McWilliams1998). The age of UT2421(2) was determined 15 mo after that of UT2421, with no reference being made to the earlier analysis. The weighted mean age and error of the La Sal Mts tephra is 1.06±0.06 Ma (1σ). # indicates application of Di/Ds value for the age correction.
Description of tephra beds in the Valles caldera area, New Mexico
Two large calderas formed in the Jemez Mountain volcanic field of north-central New Mexico during the early Pleistocene (Pillans and Gibbard, Reference Pillans and Gibbard2012): the older Toledo caldera and the Valles caldera, which are nearly coincident (Fig. 2). The erupted tephra from both calderas is referred to as the Bandelier Tuff. The volcanic sequence related to the Toledo caldera begins with the plinian Guaje Pumice and ignimbrites of the Otowi Member, dated at 1.61±0.01 Ma (Izett and Obradovich, Reference Izett and Obradovich1994). The Valles caldera eruptives consist of the plinian Tsankawi Pumice and overlying ignimbrites together forming the Tshirege Member. Several age determinations have been made on the Tshirege Member, and they range from 1.21 to 1.25 Ma (Spell et al., Reference Spell, Harrison and Wolff1990, Reference Spell, McDougall and Doulgeris1996; Izett and Obradovich, Reference Izett and Obradovich1994; Phillips et al., Reference Phillips, Goff, Kyle, McIntosh and Dunbar2006). There is also a maximum age for the Tshirege Member of 1.21 Ma constrained by dates on the underlying Cerro Toledo Formation (Spell et al., Reference Spell, McDougall and Doulgeris1996). We follow Cook et al. (Reference Cook, Wolff and Self2016), who adopted an age for the Tshirege Member eruption of 1.24±0.01 Ma. The Cerro Toledo Formation consists of several pumice-fall beds that were deposited during the interval between the two large eruptions of the Otowi and Tshirege Members (Spell et al., Reference Spell, McDougall and Doulgeris1996).
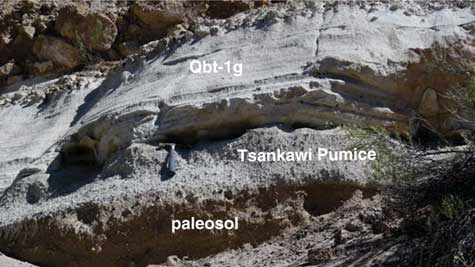
Guaje Pumice was dispersed to the east and southeast based on isopach maps in the proximal zone (Self et al., Reference Self, Heiken, Sykes, Wohletz, Fisher and Dethier1996) and its occurrence near Lubbock, Texas (Izett et al., Reference Izett, Wilcox and Borchardt1972). The ignimbrites of the Otowi Member, which attain a thickness of 180 m, occur in all parts of the Jemez Mountains (Self et al., Reference Self, Heiken, Sykes, Wohletz, Fisher and Dethier1996). Tsankawi Pumice, on the other hand, was transported to the northwest from the Jemez Mountains. It is the only deposit in the volcanic field that has this direction—all other fall units have dispersal axes trending NE-SSE. An extreme crystal enrichment factor of 7 indicates a very powerful, plinian eruption with a column some 45 km high (Self et al., Reference Self, Heiken, Sykes, Wohletz, Fisher and Dethier1996). On the north side of the Jemez Mountains this pumice bed is up to 2.6 m thick, whereas in the eastern part thicknesses vary laterally from 0.5 to 1 m. The overlying ignimbrites of the Tshirege Member (Qbt1g to Qbt5) reach a thickness of 275 m (Self et al., Reference Self, Heiken, Sykes, Wohletz, Fisher and Dethier1996) and were likely emplaced immediately following deposition of the Tsankawi Pumice, there being no weathering horizon between them (Fig. 8).
Tsankawi Pumice, 40 cm thick, below basal flow (Qbt-1g) of the Tshirege Member and above a paleosol. Note the absence of a weathered horizon between Qbt-1 and the Tsankawi Pumice. Samples UT2456 and UT2457 were collected at this site, which is locality 5 on Fig. 2.

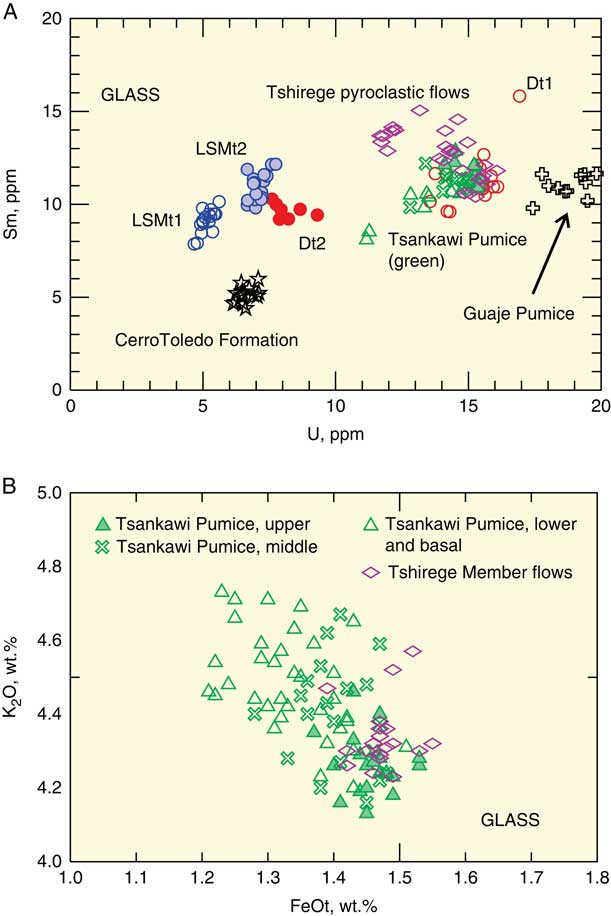
The phenocryst suite of the high-silica rhyolites of the Otowi and Tshirege Members of the Bandelier Tuff is similar and consists of quartz, alkali feldspar, ferrohedenbergite, orthopyroxene, magnetite, ilmenite, fayalite, chevkinite, apatite, hornblende, and biotite (Self et al., Reference Self, Heiken, Sykes, Wohletz, Fisher and Dethier1996; Warren et al., Reference Warren, Goff, Kluk and Budahn2007). Major- and trace-element concentrations in the glass of Tsankawi Pumice and the lower ignimbrites of the Tshirege Member are very similar (Figs. 6, 7B, and 9A, Tables 1 and 4). Specifically, the middle and upper parts of the Tsankawi Pumice are closer in average glass composition to the lower part of the Tshirege Member ignimbites (Tables 1 and 4). This similarity is true for both major and trace elements (Fig. 9). The basal Guaje Pumice is distinctive in its lower FeOt, La, and Ce and higher Rb, Ta, and U. The younger pumice beds of the Cerro Toledo Formation are distinctive in their low FeOt, Zr, and Y and relatively high CaO (Tables 1 and 4), in agreement with Slate et al. (Reference Slate, Sarna-Wojcicki, Wan, Dethier, Wahl and Lavine2007, Reference Slate, Sarna-Wojcicki, Koning, Wan, Wahl, Connell and Perkins2013), who sampled the entire sequence of tephra beds. It should be noted, however, that in this study only the basal part of the Guaje Pumice was sampled along with the lower ignimbrites of the Tshirege Member. Sanidines have the same composition, except for Cerro Toledo Formation, which has lower Na2O and higher K2O (Table 5, Supplementary Table 6). Chevkinites from the two plinian deposits have similar compositions (Table 6, Supplementary Table 8).
(A) Bivariate plot of U–Sm showing the glass compositional separation of stratigraphic units. Similar spatial separation can be seen for all REEs plotted against U. (B) K2O–FeOt plot showing that glass shards of the upper and middle Tsankawi Pumice have a similar composition to glass shards in the lower part of the Tshirege Member ignimbrites, unlike most glass shards in the lower and basal part of the Tsankawi Pumice, which have lower FeOt and higher K2O. Samples collected at site 3 (Fig. 2, Table 3).

Seven oriented samples for paleomagnetic analysis of the upper, welded Tshirege Member ignimbrites (Qbt3 and Qbt5; Supplementary Table 3) were collected at site P, a few kilometers southeast of the Valles caldera (Fig. 2, Table 3). Six samples gave meaningful results, which are listed in Table 8 and illustrated on an equal area stereonet in Supplementary Figure 1B. Mean paleomagnetic directions are 166° declination and −42° inclination, indicating a reversed magnetic polarity. These results are similar to those of Sussman et al. (Reference Sussman, Lewis, Mason, Geissman, Schultz-Fellenz, Olivia-Urcia and Gardner2011) and are consistent with the paleomagnetic directions determined for Dt and LSMt.
Source of the Dt and LSMt beds
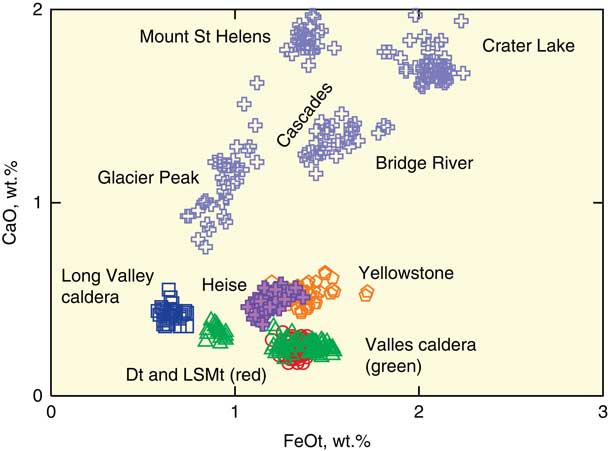
The Dt and LSMt have a close affinity to the Quaternary Bandelier Tuff, derived from the volcanic field in the Jemez Mountains, in terms of minerals present, major-element composition of glass shards, mineral chemistry, paleomagnetism, and geochronology. An origin in north-central New Mexico is also strongly supported by the CaO–FeOt plot (Fig. 10, Supplementary Table 9); the unusually low CaO in glass shards of Dt and LSMt distinguishes them from tephra beds of other major Quaternary volcanic fields in the western United States. We emphasize that there are no other major Quaternary silicic volcanic sources in North America that come close to resembling the Bandelier Tuff. The low calcium values of its glass shards are distinctive and give us confidence in defining the Valles caldera as the source of the distal Dt and LSMt beds.
CaO–FeOt plot showing the differing compositions of glass shards from five volcanic centers and magmatic provinces in the western United States. Duncairn (n=44) and La Sal Mountains (n=59) tephra (Dt and LSMt) beds overlap the compositional field of tephra from the Valles caldera (n=95), the smaller population group representing the Cerro Toledo Formation. Supplementary Table 9 contains all the individual glass shard analyses. The Bridge River tephra is derived from the volcano at the northernmost extension of the Cascades into British Columbia.

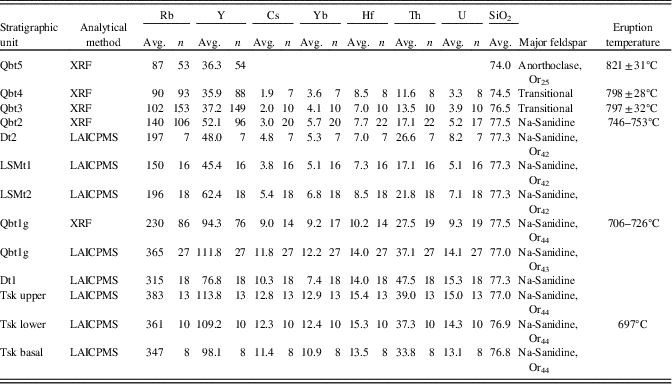
Compositional differences do exist, but they do not deny a genetic relationship with tephra from this source. Plagioclase of andesine to labradorite composition is conspicuous in Dt but has not been found in any of the other tephra samples of this study. The FeOt–K2O plots (Fig. 7) show the compositional space occupied by the Dt is only partly coincident with that of the Tsankawi Pumice and Tshirege Member ignimbrites. The U–Sm plot (Fig. 9A) shows Dt1 to be compositionally similar to the Tshirege Member beds; however, Dt2 and LSMt both have similar U contents, which are much lower than that of Dt1. The La/Yb–Cs plot (Fig. 6C) also shows Dt2 and LSMt to have distinctive compositions compared with Dt1, the Tsankawi Pumice, and the lower ignimbrites of the Tshirege Member, but these differences are likely due to fractional crystallization producing a compositionally zoned magma body (Smith and Bailey, Reference Smith and Bailey1966) consistent with the major- and trace-element compositional gradients seen in the Tshirege Member (Table 11) and the Tsankawi Pumice (Fig. 9B, Tables 1 and 4).
Selected trace-element compositions of the distal tephra beds from Saskatchewan and Utah in the context of compositional gradients in the Tshirege Member of the Bandelier Tuff, Valles caldera, New Mexico, USA.Footnote a

a XRF data on whole-rock samples is from Warren et al. (Reference Warren, Goff, Kluk and Budahn2007); data converted to element concentrations from oxides. LAICPMS data on glass shards is from this study. Three columns on the right from Goff et al. (Reference Goff, Warren, Goff and Dunbar2014).Major element in wt% and trace-element concentrations in ppm. Tsk is the Tsankawi Pumice, the oldest stratigraphic unit of the Tshirege Member of the Bandelier Tuff; Qbt5 is the youngest.
Dt1 has a similar composition to Tsankawi Pumice and the lower ignimbrites of the Tshirege Member of the Bandelier Tuff, but it comes from the same tephra bed as Dt2, which follows the LSMt on the compositional plots (Figs. 6, 9, and 11), so that the Dt and LSMt most likely come from the same source as the Tsankawi Pumice and Tshirege Member ignimbrites, that is, the Valles caldera in the Jemez Mountains of north-central New Mexico. An age of 1.06±0.12 Ma (2σ) for LSMt further supports this claim.
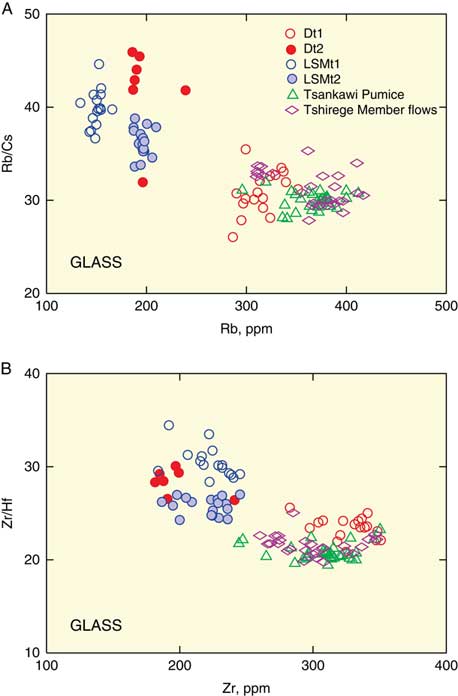
On both the Rb/Cs–Rb (A) and Zr/Hf–Zr (B) plots, the tephra beds cluster into two groups. Dt2 and LSMt form the less evolved group; Dt1 and the Tshirege Member tephra beds make up the more evolved group. See text for further explanation.

All these facts, taken together, provide strong evidence that the Dt and LSMt are sourced in the Jemez Mountains volcanic field of New Mexico, consistent with the extremely fine grain size of Dt, which points to a distant source. This study demonstrates for the first time the presence of Bandelier Tuff in western Canada.
DISCUSSION
Is there sufficient evidence to identify that part of the Bandelier Tuff to which the Dt and LSMt correlate? The most likely candidates are the two major plinian tephra deposits, namely, the Tsankawi Pumice and the Guaje Pumice, each of which preceded caldera-forming ignimbrites of the Tshirege Member and Otowi Member, respectively. Definition of isopachs on each component of the Bandelier Tuff in the source area shows that only one eruption of the Bandelier Tuff transported tephra northward (Self et al., Reference Self, Heiken, Sykes, Wohletz, Fisher and Dethier1996)—that of the Tsankawi Pumice with an age of 1.24 Ma. The Guaje Pumice can be discounted, because it is distributed to the east and southeast of the Valles–Toledo caldera complex, reaching Texas (Izett et al., Reference Izett, Wilcox and Borchardt1972). Furthermore, its age of 1.61±0.01 Ma (Izett and Obradovich, Reference Izett and Obradovich1994) eliminates it as a correlative of the LSMt, which has a glass-fission-track age of 1.06±0.12 Ma (2σ) (Table 10), and the composition of its basal tephra is unlike that of the Dt and LSMt (Figs. 7B and 9A). Tephra beds of the Cerro Toledo Formation can also be eliminated as possible correlatives of Dt and LSMt because of their small volume (Spell et al., Reference Spell, McDougall and Doulgeris1996) and the distinctive composition of the younger beds (Figs. 7B and 9A), but also the older beds, according to Slate et al. (Reference Slate, Sarna-Wojcicki, Wan, Dethier, Wahl and Lavine2007).
It follows, therefore, that the Dt and LSMt most likely relate to the Tsankawi Pumice, and possibly the lower Tshirege Member ignimbrites, in that co-ignimbritic ash may well have been caught up in the same northward-flowing winds, because ignimbrite emplacement immediately followed deposition of the Tsankawi Pumice. The possibility that this distal ash is derived from both the high plinian eruption column and co-ignimbritic ash clouds given off the Tshirege Member ignimbrites is supported by the work of Cook et al. (Reference Cook, Wolff and Self2016), who give evidence for the presence of co-ignimbritic ash-fall deposits related to the Otowi Member of the Bandelier Tuff. Both the Tsankawi Pumice and the lower Tshirege ignimbrites have a very similar composition and share some of their compositional traits with Dt1. Trace-element concentrations in glass of Tsankawi Pumice are broadly similar to Dt1 (Figs. 9A and 11), although the former is more evolved, as indicated by relatively high Cl (Table 1), Rb, Cs, and Y (Table 4). However, the single-grain plot of total alkalies versus SiO2 for Dt (Fig. 6A and B), which shows a compositional trend produced by the fractionation of sanidine, illustrates that some of the glass shards of Dt are more evolved than those of the Tsankawi Pumice, having higher SiO2 and lower alkalies, and therefore formed at a shallower depth (Gualda and Ghiorso, Reference Gualda and Ghiorso2013). Dt2 is less fractionated than Dt1, with lower Rb, Y, Ta, Th, U, and Cl (Tables 1 and 4). Its trace-element composition is not unlike that of the two glass populations of LSMt, especially in their Cs concentrations and Rb/Cs ratios (Table 4). More specifically, Cs data for Dt1 are very similar to those for the Tsankawi Pumice, which is constant within error at 12 ppm with Rb/Cs of 30, both indicating highly evolved magma (Fig. 11A). Dt2, with Cs of 4.8 ppm and Rb/Cs of 41, is much less evolved and is broadly similar to LSMt1 and LSMt2. The lower Rb/Cs values reflect the increased concentration in the melt of the highly incompatible Cs as fractionation proceeds. The affinity of Dt2 for LSMt can also be seen in the La/Yb–Cs plot, where Yb and Cs are being enriched and La possibly depleted in the melt during fractional crystallization to give the lower ratio values for the group containing the Dt1 and the Tshirege Member tephra (Fig. 6C). The same relationship is shown in the Zr/Hf–Zr plot (Fig. 11B), where Hf increases with crystal fractionation to give the lower ratio values for the Dt1 and Tshirege Member group, the high Zr concentration in the melt likely being caused by enrichment of volatiles, which inhibit crystallization of zircon (Stix and Gorton, Reference Stix and Gorton1990). Zircon phenocrysts are rare in the Tsankawi Pumice and have not been recorded in the initial ignimbrite of the Tshirege Member (Qbt1g) (Warren et al., Reference Warren, Goff, Kluk and Budahn2007). Differences in La, Ce, and Nd concentrations largely reflect varying degrees of fractionation of chevkinite. In short, the trace-element data do not militate against correlating the Dt and LSMt with the Tsankawi Pumice and the lower ignimbrites of the Tshirege Member of the Bandelier Tuff; they are most likely derived from a common magma body, as has been shown earlier.
Additional support for this correlation lies in the presence of plagioclase feldspar in the Dt, an occurrence that can be explained by derivation from the exotic gray dacitic pumice clasts within the middle and upper parts of the Tsankawi Pumice and the overlying Tshirege Member ignimbrites (Self et al., Reference Self, Heiken, Sykes, Wohletz, Fisher and Dethier1996). Compositions of sanidines, titanomagnetites, and chevkinites are almost identical (Tables 5, 6, and 9). Paleomagnetic directions of the Dt and LSMt compare well with those of the Tshirege Member of the Bandelier Tuff (Table 8), and the glass-fission-track age of the LSMt is close to the 40Ar/39Ar age of the Tshirege Member.
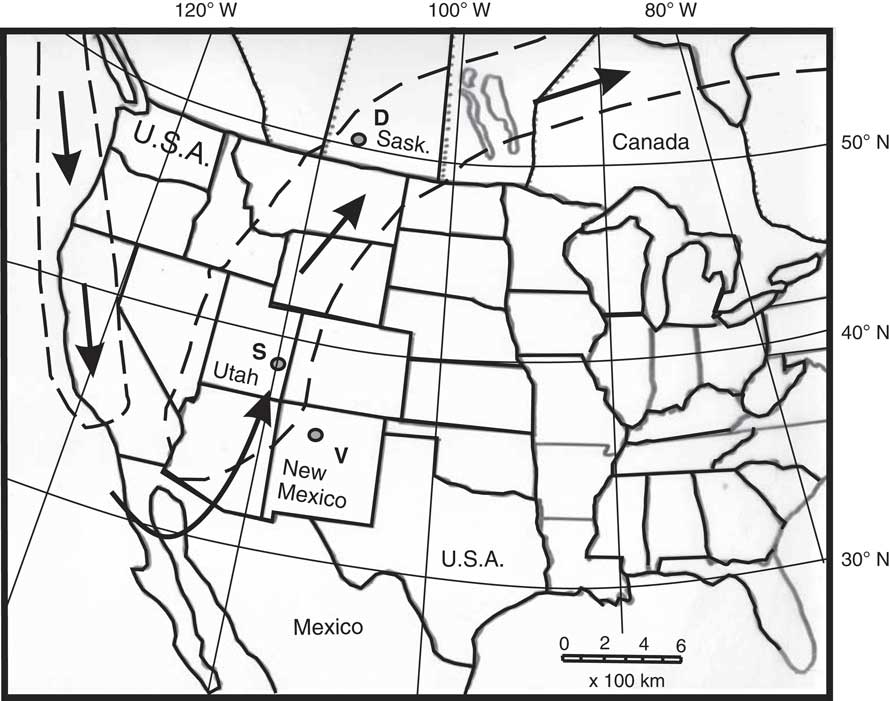
Placing the distal tephra beds from Saskatchewan and Utah in the context of compositional gradients in the Tshirege Member, as defined by trace elements, gives further insight into the possible proximal correlative beds (Table 11). Correlation of Dt1 with the Tsankawi Pumice and co-ignimbritic ash of Qbt1g is convincing. Also important is the realization that Dt2–LSMt1–LSMt2 represents the co-ignimbritic ash from Qbt2, the ignimbrite that followed Qbt1g. So how do Dt1 and Dt2 end up in the same bed in southwestern Saskatchewan? Transportation of tephra from north-central New Mexico to the north for a distance of 1500 km was likely facilitated by a deep southward penetration of the jet stream into southwestern United States and its northward return into Canada—a pattern that occurred on August 30, 2010 (Fig. 12). Jet streams are fast-flowing air currents found at the tropopause, about 10 km above the Earth’s surface. They form at the boundaries of adjacent air masses with significant differences in temperature, as seen where air from the polar region meets the warmer air to its south. Wind velocities in jet streams vary. Figure 12 shows a corridor of strong winds, but away from this corridor wind velocities decrease. Perhaps the Dt2 co-ignimbritic ash cloud got caught up in a rapidly moving part of the jet stream, allowing it to catch up with the Dt1, mixing with it before being deposited in Saskatchewan. If mixing occurred in this way, then the Qbt2 ignimbrite must have immediately followed emplacement of Qbt1g. Alternatively, the ash cloud of Qbt2 immediately followed that of Qbt1g, both being deposited in southwestern Saskatchewan and later becoming mixed by postdepositional reworking.
A simplified map showing the configuration of the jet stream in North America on August 30, 2010. A similar pattern of strong winds at the tropopause could easily and rapidly transport tephra from the Valles caldera (V) in New Mexico to the La Sal Mountains (S) in Utah and to Duncairn (D) in Saskatchewan. Dashed area and arrows indicate the extent and direction of the belt of strong winds; wind velocities decrease away from this belt.

A winter or early spring timing for the eruption is suggested by the high purity of the Dt, explained by deposition of tephra on snow, which in turn covered frozen ground. Arrival of the melt season then caused the tephra to be flushed into neighboring low areas of the local landscape, minimizing admixture with detrital material.
CONCLUSIONS
The Dt in southwestern Saskatchewan was derived from the large-magnitude eruption, 1.24 Ma, that created the Valles caldera in the Jemez Mountain region of New Mexico. The correlative proximal stratigraphic units are the Tsankawi Pumice together with the co-ignimbritic ash from Qbt1g and Qbt2, the lower ignimbrites of the Tshirege Member of the Bandelier Tuff. Mineralogical, geochemical, paleomagnetic, and geochronological information together demonstrate that the LSMt belongs to the same volcanic eruption—specifically, the co-ignimbritic ash of Qbt2 that was emplaced immediately after Qbt1g. The major-element composition of glass shards enabled identification of the source of the Dt and LSMt, but differentiation of the several ignimbrites of the Tshirege Member was only possible through their trace-element compositions, which demonstrated the origin of the Dt2 and LSMt in co-ignimbritic ash clouds. This study serves as a good example of coeval distal tephra beds derived from a common source but with differing mineralogical and chemical compositions due to their origin in a compositionally zoned magma body. With its widespread distribution, precise age, and compositional characteristics defined, the Tshirege Member of the Bandelier Tuff constitutes a potentially useful early Pleistocene stratigraphic marker across the midwestern United States and western Canada.
ACKNOWLEDGMENTS
Funds to support this study were granted to JAW and RWB by the Natural Sciences and Engineering Research Council of Canada. Yanan Liu, University of Toronto, provided valuable help with the microprobe analyses and S.E. Broyles, a meteorologist based at Flagstaff, Arizona, gave us useful information. J. Desloges, University of Toronto, kindly provided the grain-size distribution data for Dt, and Andrew and Tim Westgate ably assisted JAW and GW during fieldwork in the Los Alamos area in New Mexico. REK and ES-F assisted GW during the collection of tephra and paleomagnetic samples, enabled by support from the Los Alamos National Laboratory seismic hazard program. HCH wishes to thank Maria Cioppa for permission and help in using the superconducting magnetometer at the University of Windsor, and Alison Dias at UTM for drafting the paleomagnetic figures. This work is unclassified and approved for public release (LA-UR-18-21041). We thank John Stix (McGill University, Montreal), Stephen Kuehn (Concord University, West Virginia), an anonymous reviewer, and Jim O’Connor, Associate Editor, for suggestions that resulted in a significantly improved article.
SUPPLEMENTARY MATERIALS
To view supplementary material for this article, please visit https://doi.org/10.1017/qua.2018.139