The acceleration of social and industrial progress has delivered tangible benefits to daily life and production, yet it has also placed a growing strain on the Earth’s finite energy resources and led to considerable emissions of greenhouse gases. These emissions, in turn, have imposed serious consequences on the environment and climate that underpin human survival. Within the international community, it is now widely accepted that excessive CO2 emissions rank among the principal drivers of climate change; the consequent rise in global temperatures and the perturbation of the carbon cycle have, in turn, intensified the inherent instability of the climate system (Ong et al., Reference Ong, Ng and Mohammad2018). Against this backdrop, treating CO2 as a renewable carbon resource and using solar energy to photocatalytically reduce it into value-added chemical fuels, such as CO, methane and methanol, is considered one of the most promising technological pathways for achieving peak carbon and carbon neutrality goals (Patial et al., Reference Patial, Raizada, Khan, Singh, Van Le and Lichtfouse2021). An ideal photocatalytic CO2 reduction system must simultaneously satisfy three key conditions: the ability to absorb light across a wide spectral range for effective solar energy harvesting; efficient separation and transport of charge carriers to suppress carrier recombination; and abundant active surface sites to enhance CO2 adsorption and activation (Ortiz-Quiñonez & Pal, Reference Ortiz-Quiñonez and Pal2024).
In recent decades, numerous synthetic photocatalysts have been explored, such as titanium dioxide, graphitic carbon nitride, metal–organic frameworks, perovskites and various sulfide semiconductors (Low et al., Reference Low, Cheng and Yu2017; Zhu et al., Reference Zhu, Qin, Jiang, Ding and Hou2017). Although these materials have achieved remarkable performance breakthroughs at the laboratory scale, their large-scale application remains constrained by the following bottlenecks: complex synthesis processes, often involving high temperatures and pressures, strong acids and bases or expensive precursors; concerns regarding the environmental safety and long-term stability of nanomaterials; and high costs, making it difficult to meet the stringent economic requirements of industrial applications. Consequently, the search for widely available, inexpensive and environmentally friendly natural minerals to serve as photocatalyst substrates has become a research hotspot in this field.
Clay minerals have garnered considerable interest in the realms of environmental catalysis and energy conversion owing to their abundant reserves, large specific surface area, unique layered structure, excellent ion-exchange capacity and good chemical stability (Arabmofrad et al., Reference Arabmofrad, Lazzara, Miller and Jafari2024; Stewart & Erastova, Reference Stewart and Erastova2024; Cai et al., Reference Cai, Yin, Zhang, Yang, Zhang and Wang2025; Yang & Jin, Reference Yang and Jin2025; Zhang et al., Reference Zhang, Wang, Zhang, Masoudi, Hassanpouryouzband and Song2025; Jiang et al., Reference Jiang, Liu, Liang, Wang, Wang and Ma2026). Kaolinite (KL), as a typical 1:1-type layered silicate mineral, has a crystal structure composed of alternating layers of silicate tetrahedra and aluminosilicate octahedra stacked via shared oxygen atoms (Cheng et al., Reference Cheng, Liu, Yang, Ma and Frost2012). This structural feature endows the KL surface with abundant hydroxyl functional groups, which not only serve as hydrogen-bonding sites for CO2 molecules but also act as hole-capture sites in the oxidation half-reaction. However, KL has a relatively wide intrinsic bandgap, meaning its excitation is limited to ultraviolet light, which accounts for merely 5% of the solar spectrum. It shows almost no response to visible light, which constitutes nearly half of the solar spectrum. Therefore, its efficiency is extremely low when used as a standalone photocatalyst (Fan & Tahir, Reference Fan and Tahir2022).
In addition, pyrite (Py) ranks among the most widespread and prevalent sulfide minerals within the Earth’s crust, often occurring as a companion mineral to KL in sedimentary deposits. From a crystal chemistry perspective, Py belongs to the isometric crystal system; in its crystal structure, Fe2+ coordinates with dumbbell-shaped S22– dimers, forming a unique electronic band structure (Murphy & Strongin, Reference Murphy and Strongin2009; Chandra & Gerson, Reference Chandra and Gerson2010). Py possesses a narrow bandgap and displays strong optical absorption across the visible and even near-infrared range, making it a highly promising light-absorbing material (Tang et al., Reference Tang, Liang, Wen, Zhou, Yan and Zhou2025). However, Py has two inherent drawbacks in photocatalytic applications: first, photogenerated charge carriers recombine extremely rapidly, causing low quantum yield; and second, under illumination, photogenerated holes readily oxidize S2– or Fe2+ in the lattice, leading to photocorrosion of the material, which manifests as the formation of a passivation layer of iron oxides or hydroxides on the surface, thereby causing rapid deactivation (Lei et al., Reference Lei, Sun, Yao, Zhao, Li and Peng2026).
Drawing from this discussion, the combination of KL and Py can theoretically produce a synergistic enhancement effect: KL can serve as an ideal dispersing matrix to prevent the agglomeration of Py nanoparticles, while its polar surface environment facilitates the adsorption and enrichment of CO2; Py, in turn, acts as the primary visible light-absorbing unit responsible for generating photogenerated carriers. However, traditional liquid-phase chemical synthesis methods typically require the use of soluble iron salts, sulfur sources and clay precursors, which not only involves cumbersome processes but also makes it difficult to simulate the actual coexistence conditions of natural minerals. More importantly, achieving close and stable interfacial contact between the two natural minerals is key to realizing the synergistic effect.
Mechanical ball milling is a green and efficient solid-state processing technique capable of inducing crystal structure distortion in minerals through mechanochemical effects, reducing reaction activation energy and promoting atomic-scale interfacial fusion between different phases (Zhang & Saito, Reference Zhang and Saito2012; Cagnetta et al., Reference Cagnetta, Robertson, Huang, Zhang and Yu2016). In recent years, mechanical ball milling has been extensively employed for the activation and functional engineering of clay minerals (Di Leo et al., Reference Di Leo, Pizzigallo, Ancona, Di Iaconi, Spada and Mongelli2019; Ochirkhuyag & Temuujin, Reference Ochirkhuyag and Temuujin2024). Given that KL and Py often coexist in nature, this study innovatively proposes the direct use of natural mineral ore to construct a KL/Py composite photocatalyst through a simple mechanical ball-milling process. The advantages of this strategy include: full utilization of the natural symbiotic structure of the minerals, thereby avoiding complex chemical separation and resynthesis processes; the mechanical forces during ball milling simultaneously achieve the nanonization of Py, the interlayer activation of KL and the in situ bonding at the interface between the two minerals; and the process is simple, low-cost and easily scalable, aligning with the concepts of green chemistry and sustainable materials innovation.
Against this backdrop, the present work examines the influence of composite mineral type and mass ratio during ball milling on the structure of the composite material, interfacial interactions and photocatalytic CO2 reduction performance. By combining various characterization techniques, the study provides an in-depth revelation of the synergistic enhancement mechanism and offers new theoretical foundations and technical pathways for the value-added utilization of clay minerals and the design of natural mineral-based photocatalysts.
Experimental
Materials
Natural KL (chemically pure, Al2Si2O5(OH)4 content >96%, China Kaolinite Co., Ltd), natural Py (FeS2 content >98%, Tongling, Anhui), CO2 gas (99.9%) and deionized (DI) water were used. All reagents are employed directly without additional purification.
Methods
Preparation of KL/Py composites
For the KL/Py composite, KL and Py are mixed in mass ratios of 1:1, 1:2 and 1:0.5 then ball milled in a planetary ball mill (400 rpm, 6 h, ball-to-powder mass ratio of 10:1) using a zirconia (ZrO2) jar and zirconia balls (diameter: 5 mm and 10 mm mixed) to minimize wear debris and avoid metallic contamination. The resulting composites are designated KL1/PyX, where X represents the mass ratio of Py to KL.
Preparation of ball-milled Py
For comparison, pristine Py was subjected to the same ball-milling procedure (400 rpm, 6 h, ball-to-powder mass ratio of 10:1, zirconia jar and balls) without the addition of KL. The obtained sample was denoted as Py-BM.
Characterization
X-ray diffraction (XRD; Bruker D8 Advance, Cu-Kα radiation) was employed to characterize the crystalline phase composition. Morphological features, XRD traces and elemental distribution (energy-dispersive X-ray spectroscopy (EDS) mapping) of the samples were characterized using a field-emission transmission electron microscope (TEM; FEI Tecnai G2F20) and a high-resolution TEM (HR-TEM). Ultraviolet–visible diffuse reflectance spectroscopy (UV-Vis DRS) was collected on a UV-765 spectrophotometer, and the bandgap width was estimated using the Tauc method. Steady-state photoluminescence (PL) spectra were recorded with an F-4600 fluorescence spectrometer (Hitachi). Surface chemical states were investigated using X-ray photoelectron spectroscopy (XPS; Nexsa, ThermoFisher), and binding energies were referenced to the C 1s peak at 284.8 eV. Electrochemical measurements were performed with a CHI-760E electrochemical workstation employing a standard three-electrode setup consisting of 0.1 M Na2SO3 as the electrolyte, a fluorine-doped tin oxide (FTO)-coated glass working electrode (10 mm × 10 mm), a Pt foil auxiliary electrode and an Ag/AgCl reference electrode. Electrochemical impedance spectroscopy (EIS) was carried out at open-circuit potential across a frequency range of 10–1–105 Hz.
Photocatalysis CO2 reduction test
A laboratory-constructed quartz reactor with a volume of 300 mL was employed for CO2 photoreduction. A 10 mg portion of photocatalyst was transferred into a glass dish (35 mm diameter), mixed with a minimal amount of DI water and dried at 60℃ in an oven to achieve uniform dispersion and to form a thin layer on the base of the dish. The dish was subsequently loaded into the quartz vessel. Upon evacuation of the reactor, high-purity CO2 gas was introduced continuously at a rate of 30 mL min–1 for 20 min, after which the reactor was sealed. Subsequently, 1 mL of DI water was injected into the reactor base.
Irradiation was performed using a UV-enhanced xenon lamp system (MC-PF300UV, Beijing Meruichen Technology Co., Ltd). The lamp was suspended vertically ∼1 cm above the reactor, delivering an average light intensity of 120 mW cm–2 (measured at the reactor surface using a photometer, PL-MW2000, Perfectlight). The lamp provided a full-spectrum output (200–800 nm) without any cut-off filter.
The relative humidity inside the sealed reactor was not directly controlled but was kept consistent by injecting the same volume (1 mL) of DI water in each test.
At hourly intervals over a 3 h period, 2.5 mL of gaseous sample was extracted from the reaction vessel using a syringe. The gas product composition was determined using a gas chromatography system (Fuli, GC9790II, China), and quantification was performed with certified standard gases. Each photocatalyst was subjected to three replicate tests to minimize the impact of random variations.
Results and discussion
Fabrication and structural characterization of the KL/Py composite
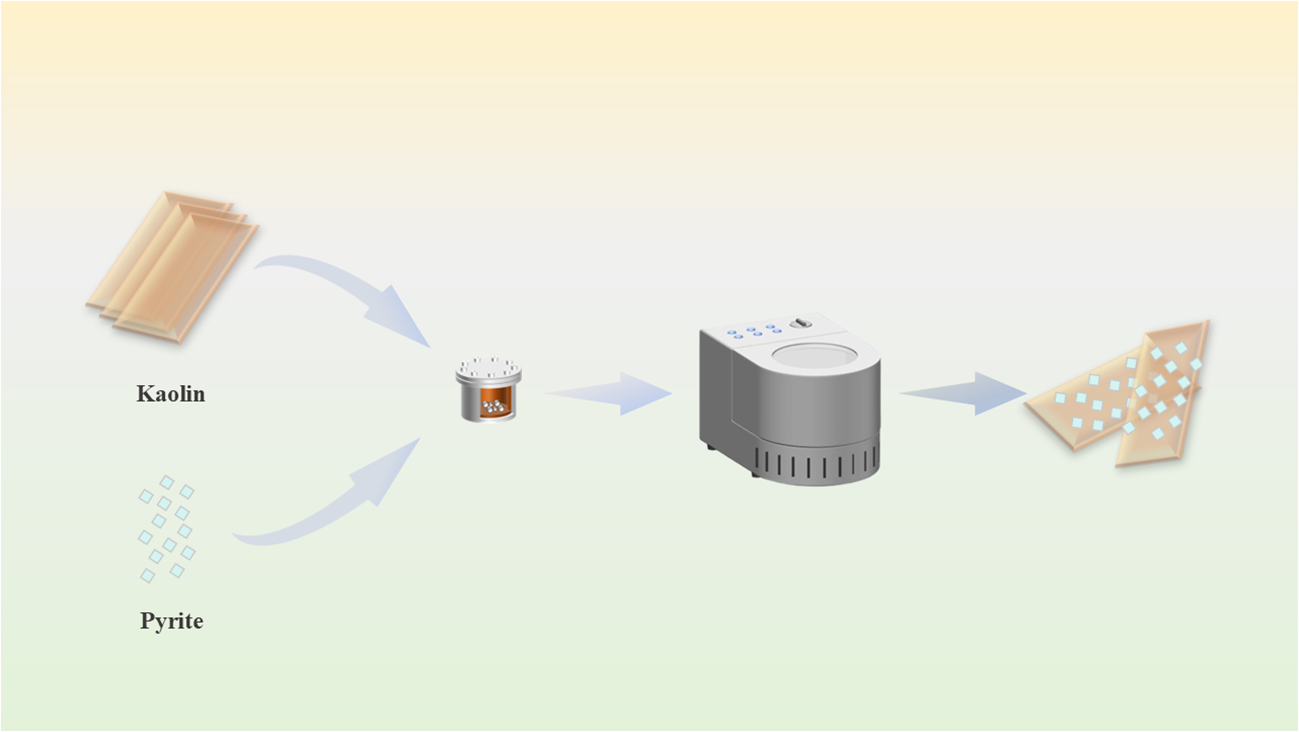
A schematic diagram of the fabrication process for the KL/Py composite is presented in Fig. 1. Py and KL were compounded via mechanical ball milling to form a tightly contiguous heterogeneous interface. As a green solid-state processing technique, mechanical ball milling can induce structural distortion in mineral crystals through mechanochemical effects, thereby promoting interfacial fusion between different phases (Zhang & Saito, Reference Zhang and Saito2012; Ochirkhuyag & Temuujin, Reference Ochirkhuyag and Temuujin2024).
Schematic depicting the mechanical ball-milling procedure for fabricating KL/Py composites.

The phase composition of KL is illustrated in Fig. S1. Characteristic diffraction peaks were observed at 12.3°, 20.8°, 24.8° and 28.3°2θ, which are assignable to the (001), (110), (002) and (101) planes of KL (PDF#00-001-0527), respectively. The well-defined diffraction peaks indicate a high degree of crystallinity and the absence of impurities. The elemental composition of KL was assessed using an X-ray fluorescence spectrometer (PFX-235), with the results summarized in Table S1.
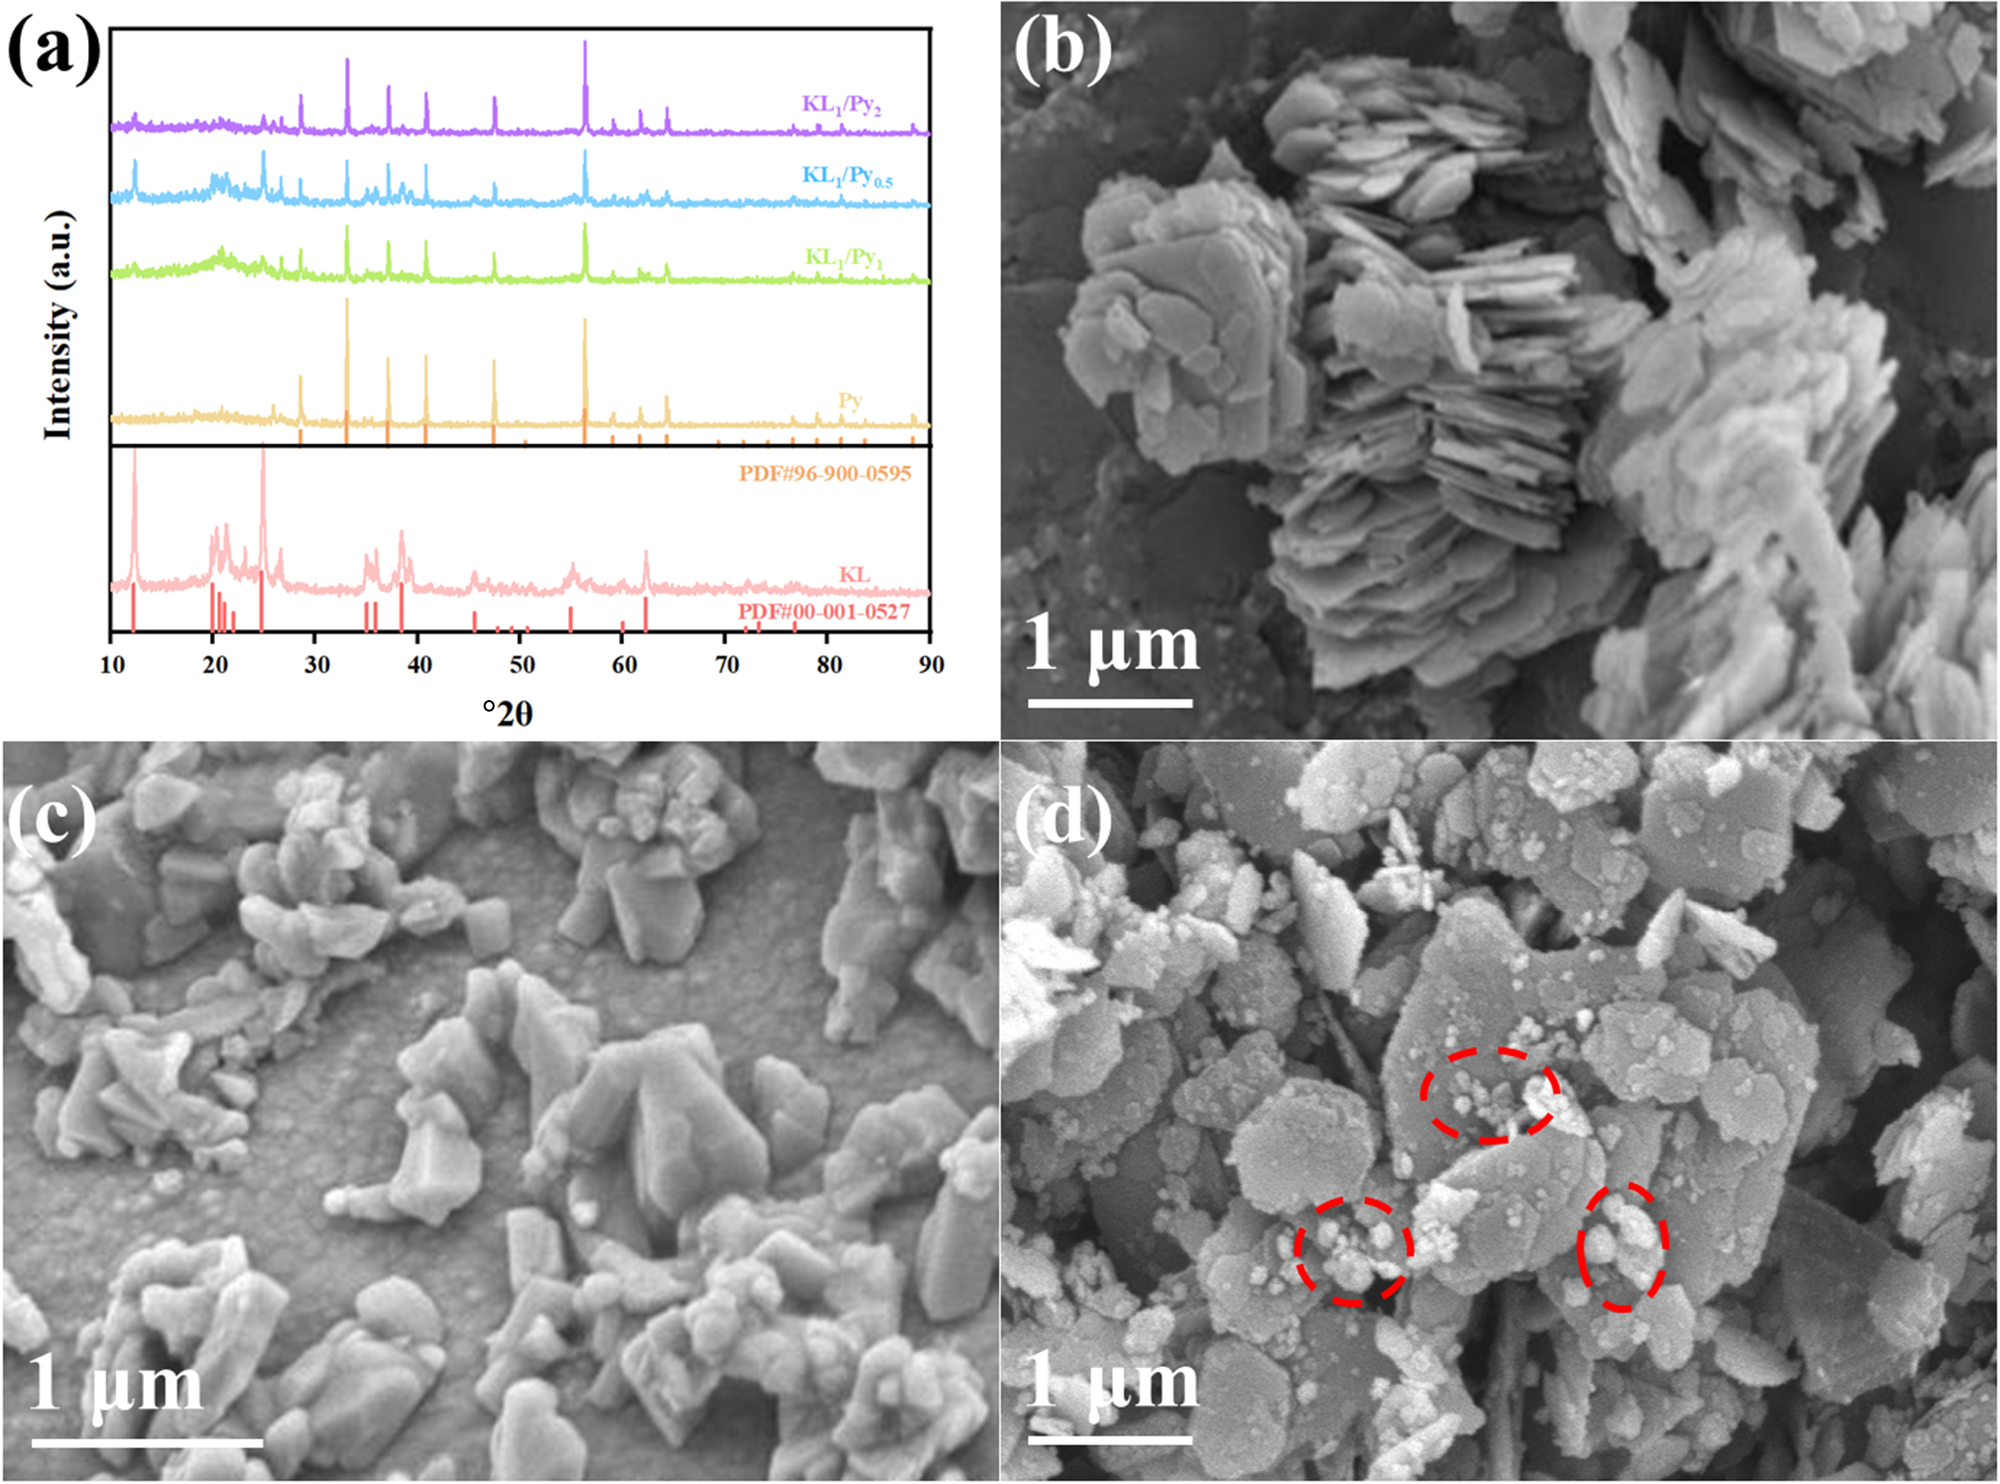
Figure 2a shows the XRD traces of the various samples. Py exhibits typical Py phase diffraction peaks at 28.5°, 33.1°, 37.1°, 40.8° and 47.4°2θ (PDF#96-900-0595), which is consistent with the crystal structure of Py reported in the literature (Murphy & Strongin, Reference Murphy and Strongin2009). As the KL content in the composite increased, the intensity of its distinctive diffraction peaks progressively increased, while that of Py’s characteristic peaks gradually declined. The XRD traces of the KL/Py composites show diffraction features attributable to both KL and Py, with no formation of impurity phases, indicating that both components retained their original crystal structures during the ball-milling process. Notably, the intensity of the KL (001) plane diffraction peak in the composite material was slightly weakened and its half-width was increased, suggesting that the ball-milling process may have caused partial delamination or disorder of the layered structure, thereby exposing more active sites (Cagnetta et al., Reference Cagnetta, Robertson, Huang, Zhang and Yu2016). As displayed in Fig. 2b–d, the KL exhibited a typical hexagonal layered stacking structure, with layer dimensions ranging from 0.5 to 2.0 μm and thicknesses of ∼50–200 nm. The layer edges were sharp and well-defined, and the surface was smooth. The Py appeared as irregular particles with a particle size of ∼0.2–1.0 μm. Observation of the scanning electron microscopy (SEM) image after ball-milling of the two materials (Fig. 2d) revealed that the Py particles had been significantly refined and were attached to the surface of the KL layers or lodged within the interlayer spaces. The layered structure of KL was partially delaminated after ball milling, forming thin sheets with blunted edges and a roughened surface. These results indicate the successful preparation of a KL/Py composite featuring strong interfacial interaction. Such favourable interfacial contact further promotes the transport and spatial separation of photogenerated charge carriers induced by KL during photocatalysis.
(a) XRD traces of KL, Py, KL1/Py1, KL1/Py2 and KL1/Py0.5. SEM images of (b) KL, (c) Py and (d) KL/Py.

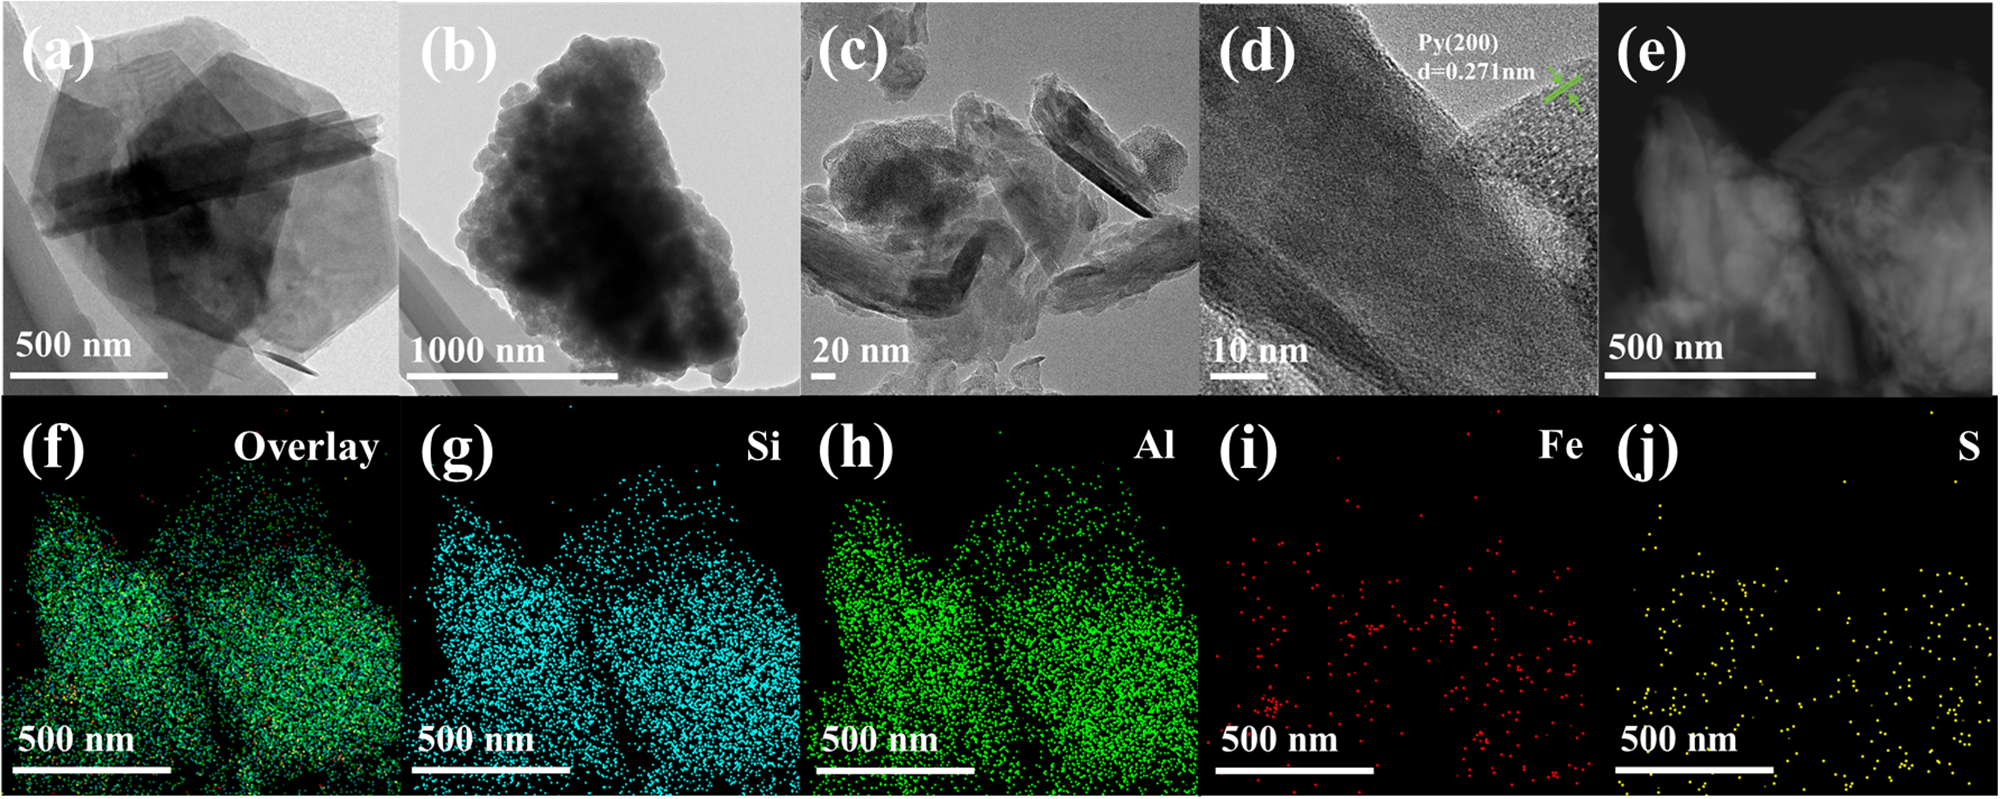
To further elucidate the atomic structure at the interface, HR-TEM was employed to characterize the KL/Py sample. Figure 3a,b shows that KL exhibited a hexagonal layered structure, whereas Py appeared as aggregated and irregular particles. Figure 3c shows that the Py nanoparticles were tightly anchored at the edges of the KL layers. High-resolution images (Fig. 3d) clearly reveal the interface between the two phases. The KL region exhibited a dispersed amorphous or short-range ordered structure, corresponding to ball milling-induced distortion of the layered structure. The Py particles, in contrast, displayed distinct lattice striations with an interplanar spacing of 0.271 nm, corresponding to the Py (200) plane (Chaturvedi et al., Reference Chaturvedi, Katz, Guevremont, Schoonen and Strongin1996). At the interface, the disordered layer of KL formed atomic-scale close contact with the Py (200) plane. The interface width was ∼2–3 nm, and no distinct amorphous layer was observed, indicating that mechanical ball milling facilitated in situ bonding between the two minerals. This tight, heterogeneous interface plays a critical role in the spatial separation and transport of photogenerated charge carriers (Chandra & Gerson, Reference Chandra and Gerson2010). EDS elemental mapping further confirmed that Si, Al, Fe and S were uniformly distributed throughout the composite, indicating that ball milling had achieved homogeneous mixing of the two components.
HR-TEM images of (a) KL, (b) Py and (c,d) KL/Py. (e–j) EDS mapping images of KL/Py.

Figure 3 Long description
The composite image contains ten panels labeled (a) through (j). Panels (a)–(e) are electron microscopy images at different magnifications showing irregular, plate-like and aggregated particles. Panel (a) presents a large layered particle with angular sheets, while panels (b) and (c) show clustered and fragmented structures. Panel (d) is a high-resolution image revealing parallel lattice fringes with measured spacings of approximately 0.728 nm and 0.271 nm, indicating crystalline order. Panel (e) shows another particle aggregate at lower contrast. Panels (f)–(j) display elemental mapping results of the same region. The overlay map combines all detected elements, while the remaining maps show the distributions of silicon (Si), aluminum (Al), iron (Fe), and sulfur (S). Silicon and aluminum are broadly distributed throughout the particle, iron appears as scattered localized regions, and sulfur is present in smaller dispersed concentrations. Scale bars range from 10 nm to 1000 nm.
Photocatalytic performance and charge-separation characteristics of the CO2 reduction reaction
The CO2 photoreduction activity of the as-prepared samples was assessed using a gas–solid reaction setup under UV-enhanced light irradiation without any sacrificial agent. In each hour of the experiment, 1 mL of gas sample was collected for product yield analysis. As illustrated in Fig. S2, a gradual upward trend was observed in the CO2 photoreduction rate of the samples during the initial 3 h of the 6 h test, reaching equilibrium at the 3 h mark and subsequently stabilizing between 3 and 6 h. Accordingly, subsequent experiments focused on evaluating the photocatalytic CO2 reduction yield within the first 3 h.
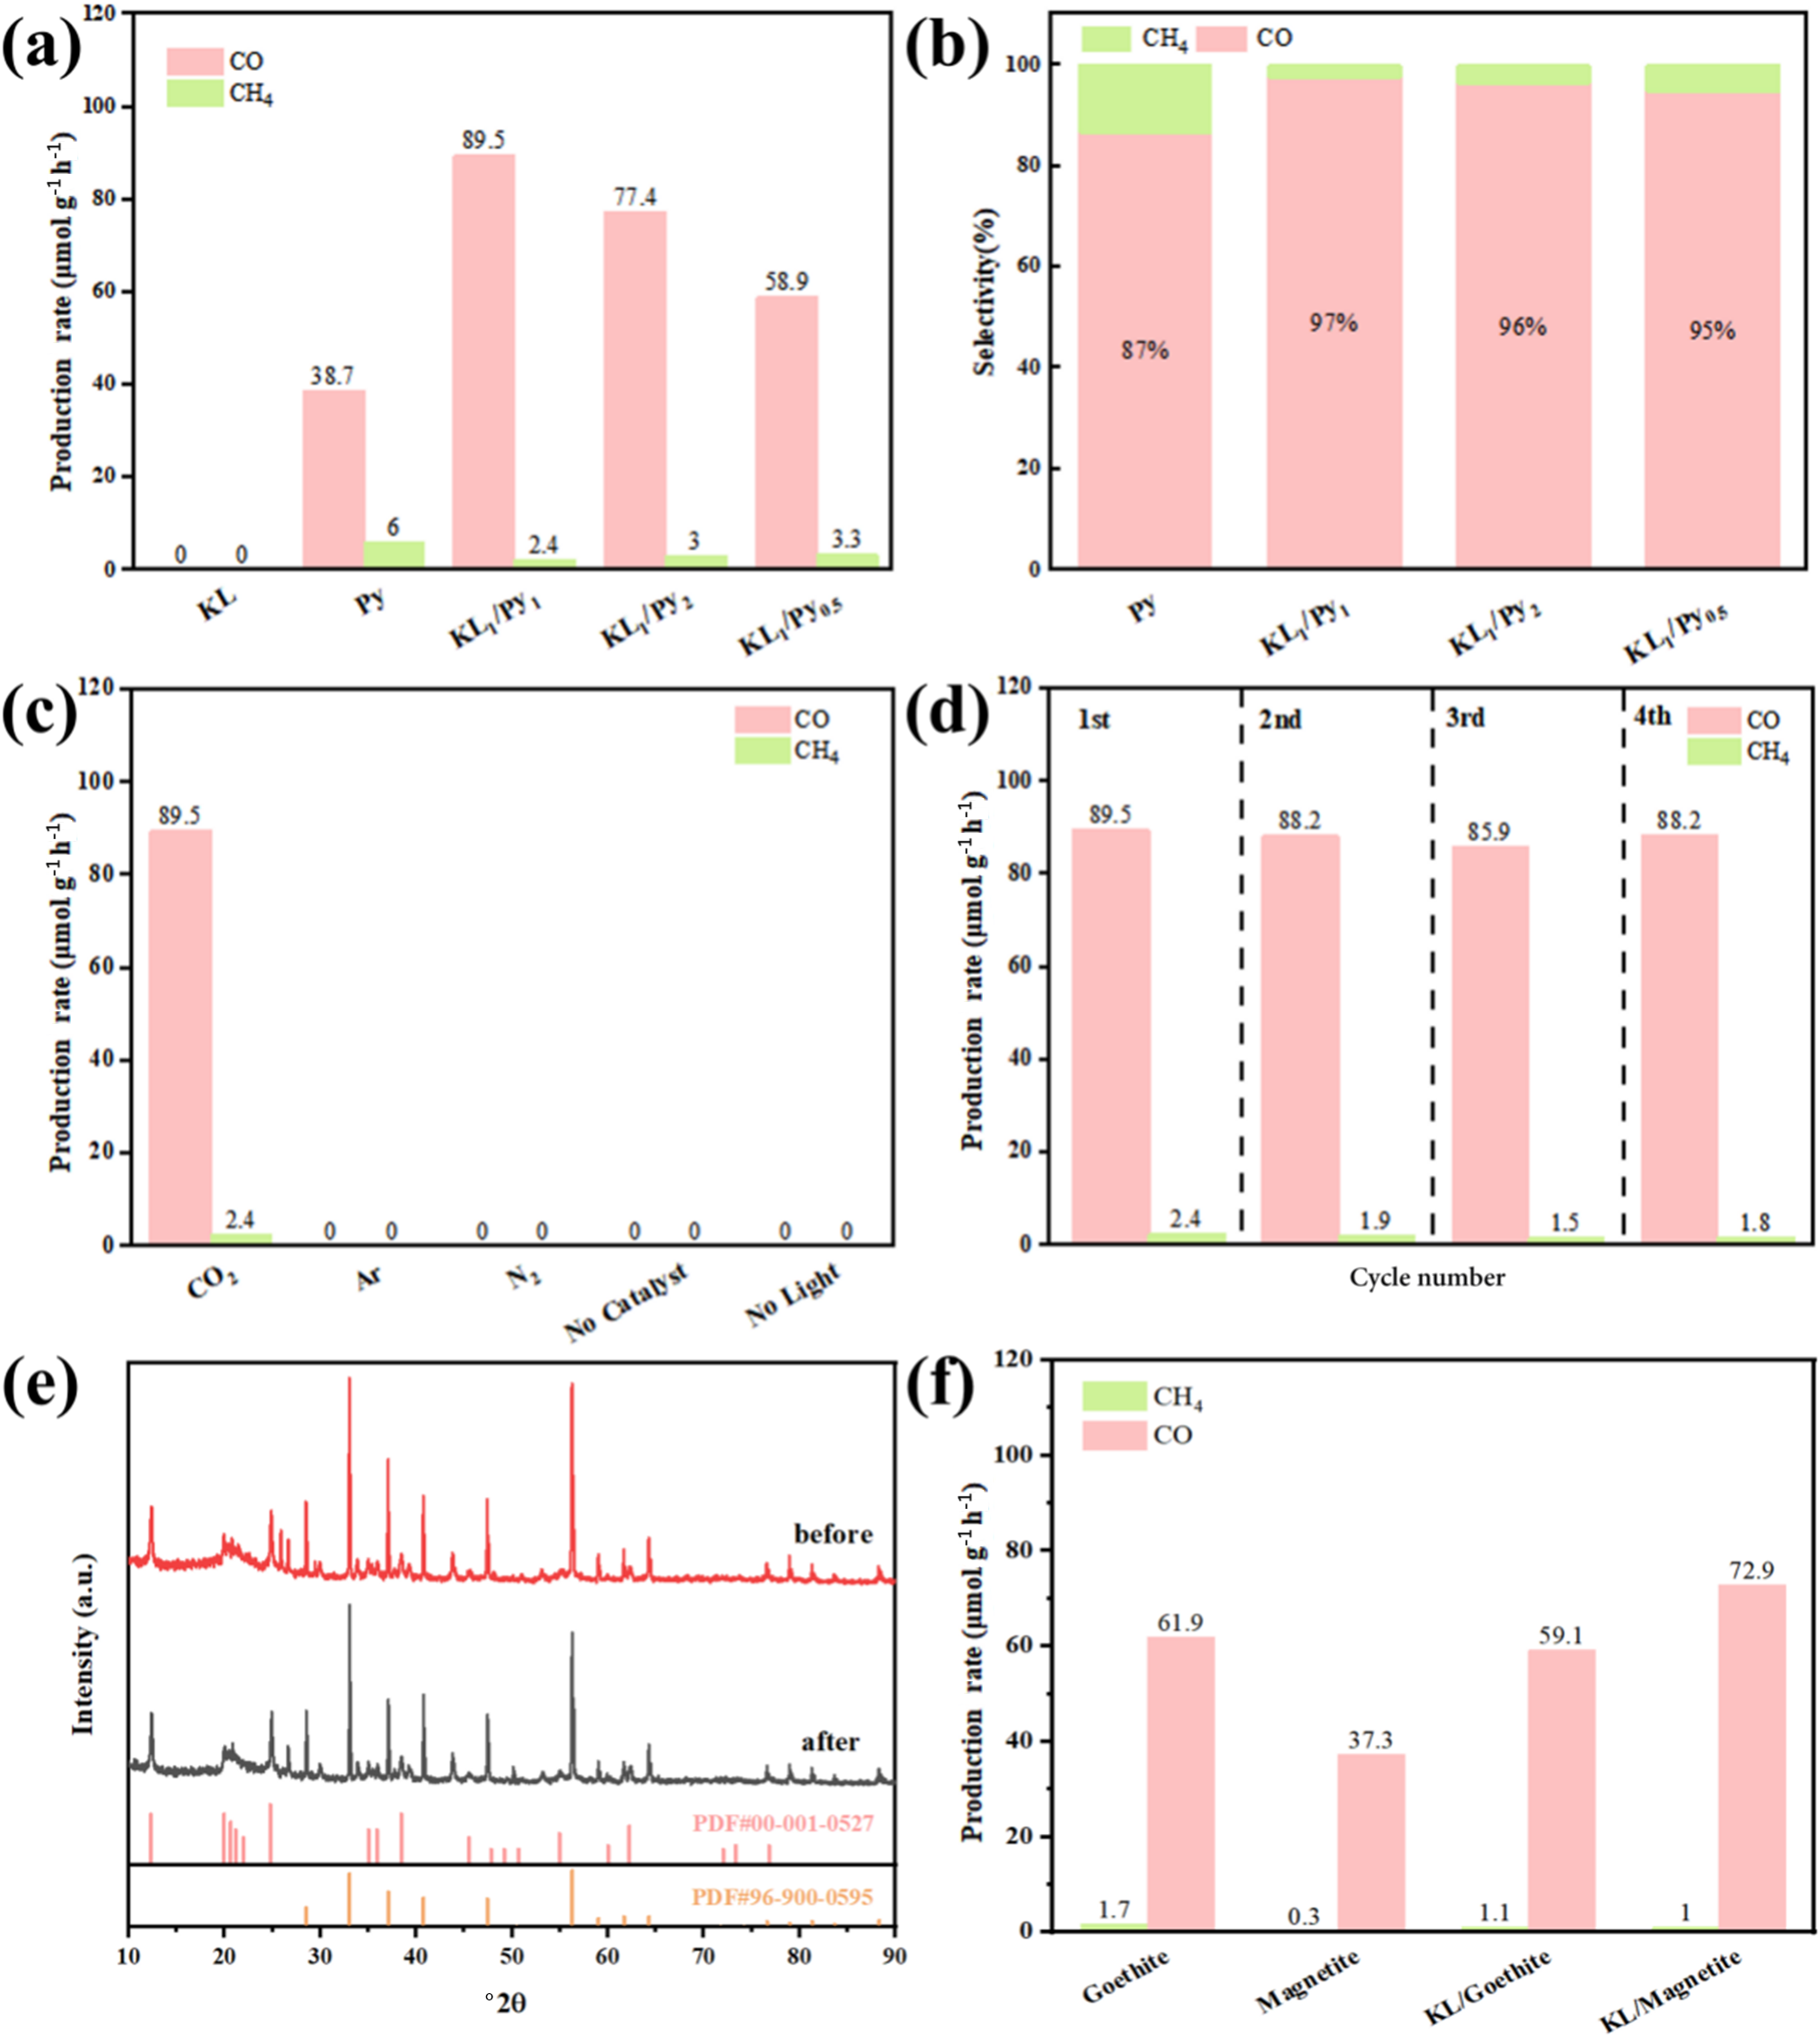
As shown in Fig. 4a, KL produced no detectable products under illumination, indicating that it lacked photocatalytic CO2 reduction activity, which is consistent with its wide bandgap characteristics (Fan & Tahir, Reference Fan and Tahir2022). In contrast, Py yielded CO and CH4 at rates of 38.7 and 1.6 μmol g–1 h–1, respectively. The composite materials exhibited substantially higher CO2 photoreduction activity than Py alone, indicating that KL promoted charge carrier separation, consequently improving the overall performance of these materials (Naciri et al., Reference Naciri, Ghazzal and Paineau2024). As the KL loading in the samples increased, the CO2 reduction efficiency initially increased and subsequently declined. The performance follows the order KL1/Py1 > KL1/Py2 > KL1/Py0.5. The optimal performance was achieved at a Py-to-KL mass ratio of 1:1, yielding a CO evolution rate of 89.5 μmol g–1 h–1, which was 2.3 times that of Py. Moreover, the CO2 photoreduction capability of the KL/Py composite was markedly superior to that observed for the physically mixed samples of KL and Py, as depicted in Fig. S3.
(a,b) CO2 photoreduction activity and product selectivity of KL1/Py1, KL1/Py2 and KL1/Py0.5. (c) CO2 photoreduction tests conducted on KL/Py under various atmospheres and conditions. (d) Cycling stability of KL/Py during repeated photocatalytic runs. (e) XRD profiles of KL/Py before and after the reaction. (f) Comparative activity of KL composites with other associated minerals towards CO2 photoreduction under gas–solid conditions.

Figure 4 Long description
The image A showing a grouped bar chart with a vertical axis labeled Production rate (micromole gram superscript negative 1 hour superscript negative 1) from 0 to 120. The horizontal axis categories are KL, Py, KL1 slash Py1, KL1 slash Py2, KL1 slash Py0.5. Two bar series are labeled CO and CH subscript 4. Values shown above bars: Py has CO 38.7 and CH subscript 4 6; KL1 slash Py1 has CO 89.5 and CH subscript 4 2.4; KL1 slash Py2 has CO 77.4 and CH subscript 4 3; KL1 slash Py0.5 has CO 58.9 and CH subscript 4 3.3. KL shows 0 and 0. The image B showing a stacked bar chart with a vertical axis labeled Selectivity (percent) from 0 to 100. The horizontal axis categories are Py, KL1 slash Py1, KL1 slash Py2, KL1 slash Py0.5. Two stacked components are labeled CH subscript 4 and CO. Percent values printed inside the CO portions are 87 percent for Py, 97 percent for KL1 slash Py1, 96 percent for KL1 slash Py2 and 95 percent for KL1 slash Py0.5. The image C showing a grouped bar chart with a vertical axis labeled Production rate (micromole gram superscript negative 1 hour superscript negative 1) from 0 to 120. The horizontal axis categories are CO subscript 2, Ar, N subscript 2, No Catalyst, No Light. Two bar series are labeled CO and CH subscript 4. Values shown: at CO subscript 2, CO 89.5 and CH subscript 4 2.4. At Ar, N subscript 2, No Catalyst and No Light, bars are at 0. The image D showing a grouped bar chart with a vertical axis labeled Production rate (micromole gram superscript negative 1 hour superscript negative 1) from 0 to 120. The horizontal axis is labeled Cycle number with categories 1st, 2nd, 3rd, 4th. Two bar series are labeled CO and CH subscript 4. Values shown above bars: 1st CO 89.5 and CH subscript 4 2.4; 2nd CO 88.2 and CH subscript 4 1.9; 3rd CO 85.9 and CH subscript 4 1.3; 4th CO 88.2 and CH subscript 4 1.8. The image E showing a line plot with a vertical axis labeled Intensity (a.u.). The horizontal axis is labeled 2 theta (degree) with tick labels from 10 to 90. Two traces are labeled before and after. Two rows of vertical reference marks appear along the bottom, each with a label line beginning with PDF number. The image F showing a grouped bar chart with a vertical axis labeled CO evolution rate (micromole gram superscript negative 1 hour superscript negative 1) from 0 to 80. The horizontal axis categories are Graphite, Magnetite, KL1 slash Graphite, KL1 slash Magnetite. Two bar series are labeled CH subscript 4 and CO. Values shown above bars: Graphite CO 61.9 and CH subscript 4 1.7; Magnetite CO 37.3 and CH subscript 4 0.3; KL1 slash Graphite CO 59.1 and CH subscript 4 1.1; KL1 slash Magnetite CO 72.9 and CH subscript 4 1.
Product selectivity represents another crucial consideration in photocatalytic CO2 reduction studies. As illustrated in Fig. 4b, the selectivity of the KL1/Py1 composite towards photocatalytic CO2 reduction products increased from 87% to 97% relative to that of pure Py, indicating that the incorporation of KL improved product selectivity. Accordingly, the optimal mass ratio for the mechanically ball-milled KL/Py composite was determined to be 1:1.
Control experiments (Fig. 4c) showed negligible CO detection in the absence of light or photocatalyst or in Ar or N2 atmospheres, confirming that the significantly enhanced CO evolution in the presence of CO2 originated from the CO2 source.
Figure 4d demonstrates that the KL/Py composite exhibited excellent cycling stability, with performance remaining largely unchanged after four cycles. For Py, the production levels of CO and CH4 dropped by 51% and 83%, respectively, upon the fourth cycle (Fig. S4).
Moreover, XRD profiles of the samples before and after the reaction (Fig. 4e) showed no notable shifts in diffraction peak positions, indicating that the CO2 photoreduction process did not modify the materials’ crystalline structure and that the composite maintained good structural stability. In comparison with KL/other associated mineral composites (Fig. 4f), KL/Py exhibited greater activity regarding the photoreduction of CO2 to CO (Chen et al., Reference Chen, Du, Zhu and Liu2010; Fajrina & Tahir, Reference Fajrina and Tahir2019).
To evaluate the effect of ball milling alone on Py activity, the CO2 photoreduction performance of Py-BM was also tested. As shown in Fig. S5, the CO and CH4 evolution rates of Py-BM were 42.3 and 3.9 μmol g–1 h–1, respectively, which are only slightly higher than those of pristine Py, indicating that ball milling itself did not significantly improve the activity of Py. In contrast, the KL/Py composite achieved a CO yield of 89.5 μmol g–1 h–1, confirming that the synergistic effect between KL and Py, rather than mere mechanical refinement, was responsible for the improved performance.
Mechanistic insights into CO2 photoreduction
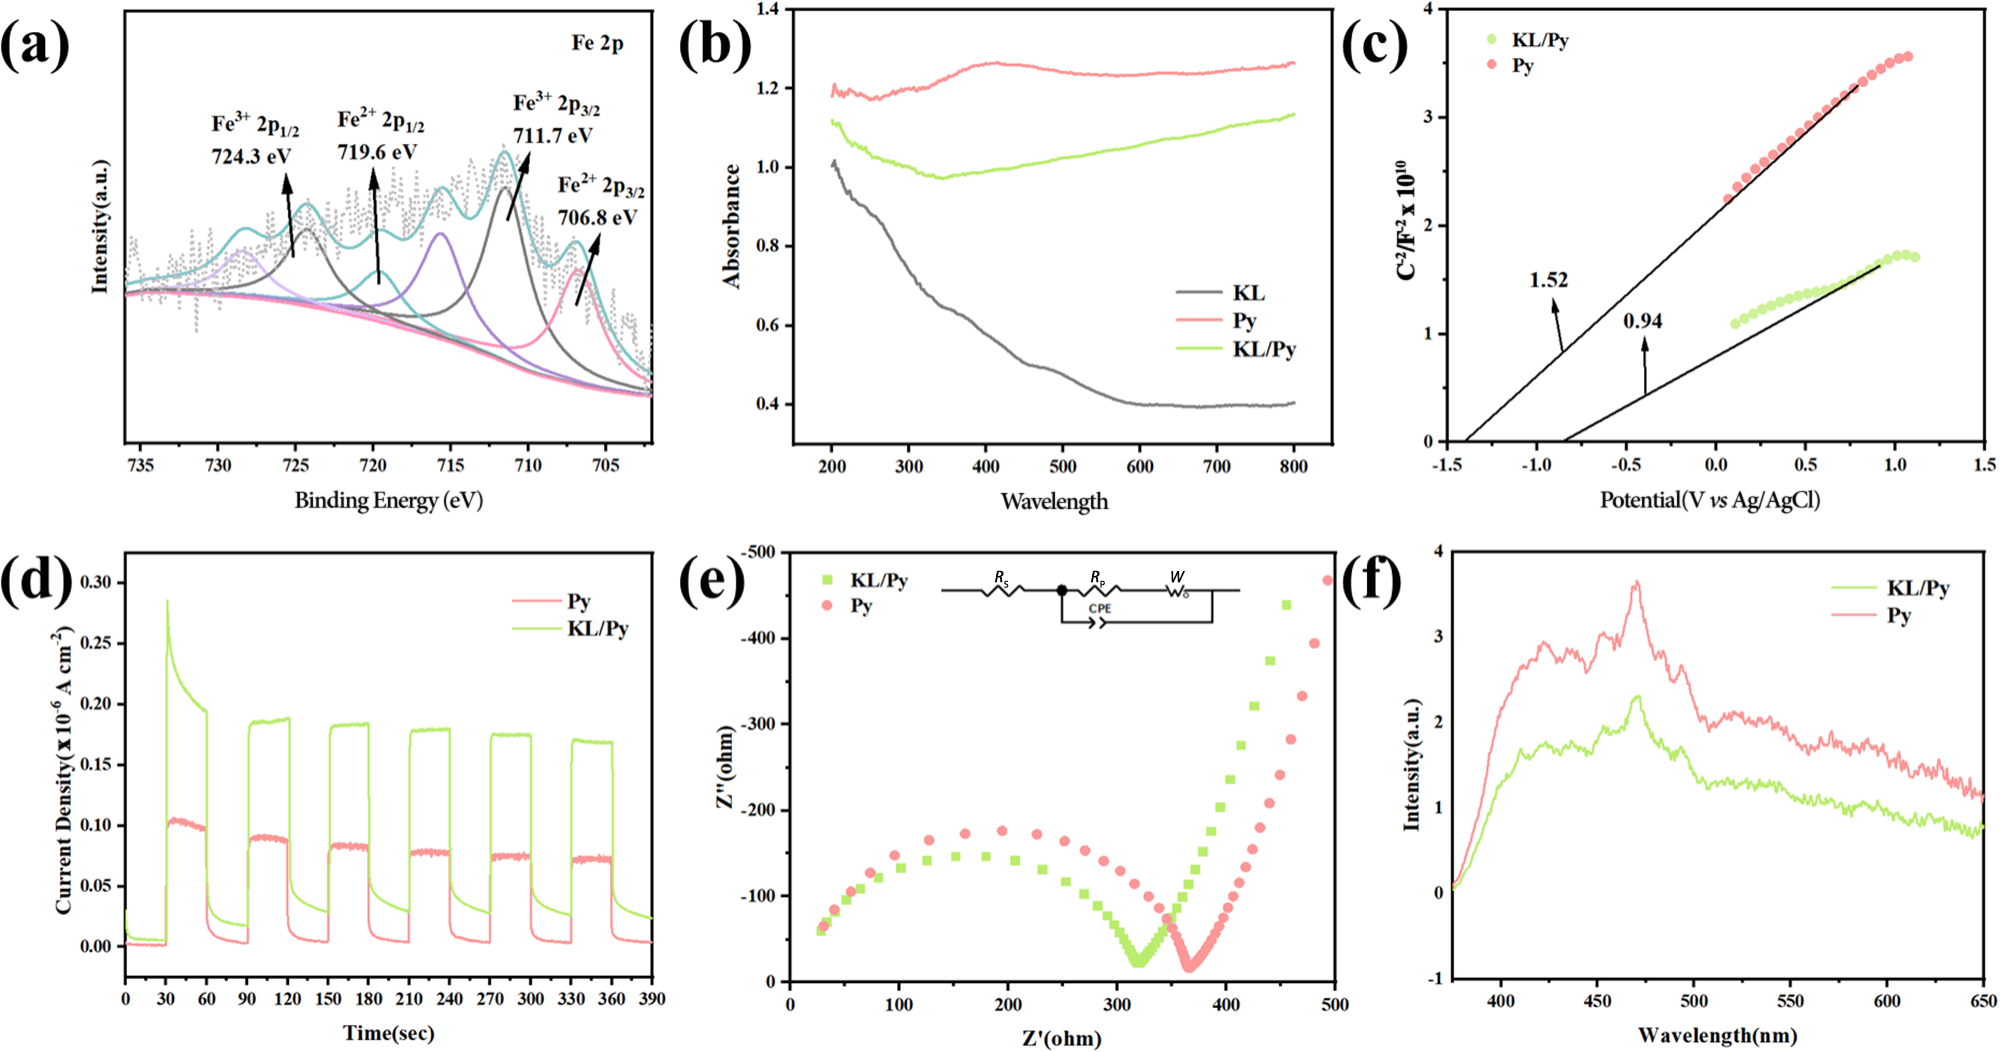
To verify the role of KL in improving the CO2 photoreduction capability of Py, we investigated its surface chemical state, light-harvesting capability and photoelectrochemical properties. The Fe XPS spectrum of the KL/Py composite is presented in Fig. 5a. Binding energies were referenced to the C 1s line at 284.8 eV for all XPS spectra (Fig. S6). The Fe 2p spectrum revealed the coexistence of Fe2+ and Fe3+, consistent with the characteristic chemical states of iron species on the Py surface (Chandra & Gerson, Reference Chandra and Gerson2010). Furthermore, silicate components were detected in the composite’s spectrum, consistent with the Fourier-transform infrared (FTIR) spectroscopy results (Fig. S7). The FTIR spectrum of KL exhibited characteristic absorption bands at 3688.0, 3614.0, 1112.3, 1022.3, 994.0, 907.8, 780.7, 739.4 and 677.0 cm–1. The peaks at 3688.0, 3614.0 and 907.8 cm–1 can be attributed to Al–OH stretching vibrations (Tang et al., Reference Tang, Su and Li2012). In the lower-wavenumber region, the bands at 1112.3 and 1022.3 cm–1 correspond to Si–O stretching vibrations, whereas those at 780.7, 739.4 and 677.0 cm–1 are assignable to Si–O–Al stretching vibrations (Cheng et al., Reference Cheng, Liu, Yang, Ma and Frost2012). For the KL/Py composite photocatalyst, all characteristic absorption peaks of KL were clearly discernible, further confirming the incorporation of KL into the composite. The UV-Vis DRS spectrum (Fig. 5b) revealed that KL absorbed strongly in the UV region but negligibly in the visible region, consistent with its wide-bandgap nature. Py exhibited broad-spectrum absorption in the 200–800 nm range, consistent with its narrow-bandgap characteristics. The absorption profile of the KL/Py composite lay between those of its two components, with significantly enhanced absorption in the visible region, indicating that the introduction of KL did not impair Py’s light absorption capability and that the composite helped broaden the light response range. Notably, the KL/Py composite did not exhibit any significant new absorption peaks, suggesting that the interaction between the two components primarily occurred at the interface rather than through the formation of a new phase (Li et al., Reference Li, Chen, Chen, Zhao, Zhang and Ke2018).
(a) XPS spectrum of Fe 2p. (b) UV-Vis spectra of KL, Py and KL/Py. (c) Mott–Schottky plots of Py and KL/Py. Ag/AgCl = reference silver/silver chloride electrode; C = space charge layer capacitance (farad, F). (d) Instantaneous photocurrent curves of Py and KL/Py composites. (e) EIS spectra of Py and KL/Py composites. CPE = constant phase angle element; R p = polarization resistance; R s = solution resistance; W = impedance. (f) Steady-state PL spectra of Py and KL/Py composites.

Figure 5 Long description
The image A showing an X ray photoelectron spectroscopy deconvolution plot labeled Fe 2p. The x-axis is labeled Binding Energy (eV), ranging from 735 to 750. The y-axis is labeled Intensity (a.u.). Multiple fitted peak curves are overlaid on a measured spectrum. Peak text labels include Fe2 plus 2p3 over 2 710.6 eV, Fe3 plus 2p3 over 2 713.3 eV, Fe 2p 719.6 eV, Fe2 plus 2p1 over 2 723.6 eV and Fe3 plus 2p1 over 2 726.5 eV. The labeled peaks indicate multiple Fe chemical-state components in the plotted Fe 2p region. The image B showing ultraviolet visible absorbance spectra with a legend listing KL, Py and KL slash Py. The x-axis is labeled Wavelength (nm), ranging from 200 to 800. The y-axis is labeled Absorbance, with labeled values from 0.0 to 1.2. The KL curve stays near the top of the plot across the range, the Py curve is lower than KL and the KL slash Py curve lies between KL and Py over most wavelengths. The image C showing a Mott Schottky plot with a legend listing KL slash Py and Py. The x-axis is labeled Potential (V), ranging from minus 0.6 to 0.2. The y-axis is labeled 1 over C squared, with labeled values from 0 to 8. Two straight line trends are shown; the KL slash Py line is higher than the Py line over the same potential range. Two numeric annotations on the plot read 1.52 and 0.54. The image D showing a chopped step chronoamperometry style plot with a legend listing Py and KL slash Py. The x-axis is labeled Time (s), ranging from 0 to 300. The y-axis is labeled Current density (mA cm superscript minus 2), ranging from 0.00 to 0.10. Both traces show repeated step increases and decreases over time. The KL slash Py trace reaches higher step levels than the Py trace during the on steps. The image E showing an electrochemical impedance spectroscopy Nyquist plot with a legend listing KL slash Py and Py and a small equivalent circuit diagram above the plot. The x-axis is labeled Z prime (ohm), ranging from 0 to 800. The y-axis is labeled minus Z double prime (ohm), ranging from 0 to 400. Each dataset forms an arc made of discrete points. The KL slash Py arc spans a smaller range of Z prime and minus Z double prime than the Py arc. The image F showing steady state photoluminescence spectra with a legend listing KL slash Py and Py. The x-axis is labeled Wavelength (nm), ranging from 350 to 650. The y-axis is labeled Intensity (a.u.), with labeled values from 0 to 3. The Py curve is higher than the KL slash Py curve across most of the wavelength range, with both curves rising from near 350 nanometer to a broad maximum region and then decreasing toward 650 nanometer.
Py is a direct-bandgap semiconductor. The Tauc plot method was applied to the UV-Vis spectra to derive the relationship between (αhν)2 and hν, where α is the adsorption coefficient, h is Planck’s constant and ν is the frequency of light (Fig. S8a,b). The bandgaps of Py and the KL/Py composite were determined to be ∼1.40 and 1.38 eV, respectively. Although the bandgap of the composite was slightly narrower than that of Py, the two values are in close proximity, suggesting that the incorporation of KL exerted only a marginal influence on the bandgap width of the composite.
The catalytic activity of a photocatalyst is generally regarded as being strongly correlated with its band structure and charge carrier dynamics (Low et al., Reference Low, Cheng and Yu2017). To investigate these aspects, Mott–Schottky measurements were performed on Py and the KL/Py composite under dark conditions using electrochemical methods to evaluate their flat-band potentials (Efb) and band alignments. The resulting data are displayed in Fig. 5c. The slopes of the Mott–Schottky plots for Py and the KL/Py composite were found to be 1.52 and 0.94, respectively, confirming that both materials are n-type semiconductors. The smaller slope observed for the KL/Py composite relative to that of pure Py indicates a higher carrier density (N d) for the composite (Yang et al., Reference Yang, Wang, Lin, Yin, Lü and Wan2013).
Furthermore, transient photocurrent response tests (Fig. 5d) corroborated this conclusion. Under intermittent illumination, the photocurrent density of the KL/Py composite was approximately twice that of Py. This increase confirmed that the synergistic interaction between the KL and Py semiconductors facilitated the separation efficiency of photogenerated electron–hole pairs. Moreover, the photocurrent response of the composite was both reversible and stable, with reproducible increases upon each illumination and rapid recovery upon cessation of irradiation, indicating stable photocurrent characteristics as underpinning the sustained photocatalytic activity.
EIS measurements were performed in the dark at the open-circuit potential to investigate the charge transport kinetics. As displayed in Fig. 5e, the arc radius in the Nyquist plot for the KL/Py composite was markedly smaller than that for pure Py, suggesting a notable decrease in charge transport resistance and solid-state interfacial resistance. This finding aligns with the superior photocatalytic activity of the KL/Py composite relative to pure Py, probably attributable to the intimate and heterogeneous interface formed between KL and Py, which diminished the EIS response and promoted charge carrier separation and migration.
PL spectroscopy was employed to evaluate the separation efficiency of photogenerated charges in the samples. As shown in Fig. 5f, the PL peak intensity of the KL/Py composite was markedly reduced. This decrease was attributed to KL functioning as a hole-trapping site, engendering a cooperative interaction with the PL characteristics of Py, thereby reducing the PL emission intensity of the composite. PL intensity serves as an indicator of the recombination rate of photogenerated charge carriers, with a lower PL intensity corresponding to a reduced recombination rate. These observations imply that the KL/Py composite effectively increased the dissociation of photogenerated electron–hole pairs, thereby inhibiting recombination of charge carriers and increasing the usage efficiency of photogenerated charges.
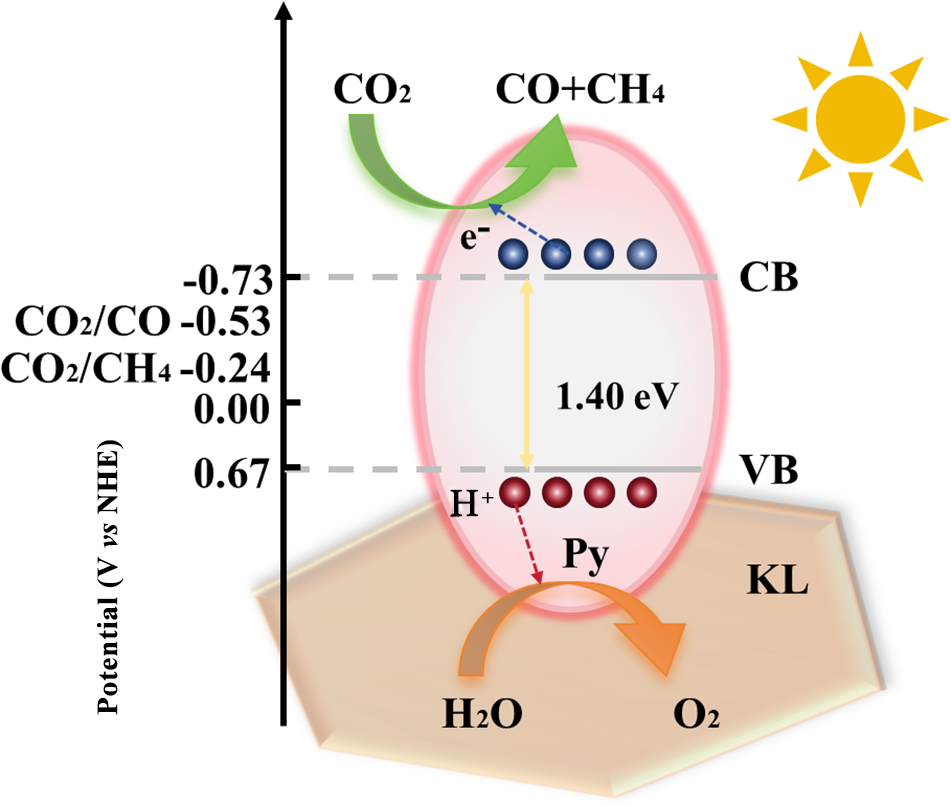
Drawing from the experimental findings presented here, the superior photocatalytic capability of this material can be ascribed to several factors. The KL carrier promotes the dispersion of Py, resulting in KL/Py nanoparticles of uniform size, high dispersion and a large specific surface area, which provide more active sites for adsorption and photocatalytic reactions. Notably, the negatively charged surface of KL promotes the spatial dissociation of photogenerated charge carriers through electrostatic interactions, thereby suppressing charge carrier recombination. Accordingly, a proposed mechanism for the photocatalytic conversion of CO2 to CO over the KL/Py composite is illustrated in Fig. 6. Under simulated solar irradiation, electrons in the valence band of Py are excited to the conduction band, leaving behind holes in the valence band. As shown in Figs S7 & S8, the bandgap of Py is ∼1.40 eV, with the conduction band located at approximately –0.73 eV and the valence band located at ∼0.67 eV (Zhou et al., Reference Zhou, Ma, Li, Shu and Zhang2022). As an electrical insulator, KL is not photoexcited but possesses abundant negative surface charge. These charges electrostatically repel photogenerated electrons while attracting photogenerated holes, thereby reducing the probability of electron–hole recombination. The resultant increase in available charge carriers increases photocatalytic activity. Given that the conduction band potential of Py is sufficiently negative compared with the potentials needed for the reduction of CO2 to CO (–0.53 eV) and to CH4 (–0.24 eV; Biswas et al., Reference Biswas, Rahimi, Saravanan, Dey, Chauhan and Surendran2024), photogenerated electrons can engage in reactions with surface-adsorbed CO2 molecules over the composite surface, producing CO and CH4 via multi-electron reduction pathways. The sufficiently negative conduction band potential of Py renders these reduction reactions thermodynamically favourable. Additionally, the abundant hydroxyl species on the KL surface serve as active sites for CO2 uptake and activation, promoting the bending and activation of CO2 molecules and thereby lowering the reaction energy barrier (Li et al., Reference Li, Jing, Lv, Zhou, Fu and Tang2024). The large specific surface area and layered structure of KL facilitate the adsorption of CO2 and reaction intermediates, while the abundant photogenerated electrons supplied by Py drive the multi-electron reduction process. Collectively, KL and Py exert a synergistic effect that promotes carrier migration to the surface and increases the light-harvesting capability of the composite, ultimately boosting the overall CO2 photoreduction activity of the composite.
Proposed mechanism for photocatalytic CO2 reduction over KL/Py composites. CB = conduction band; NHE = normal hydrogen electrode; VB = valance band.

Figure 6 Long description
The diagram illustrates the photocatalytic reduction of carbon dioxide over KL/Py composites. On the left, a vertical axis labeled 'Potential' in volts versus normal hydrogen electrode shows values from minus 0.73 to 0.67. The conduction band and valence band are marked as CB and VB, respectively. Electrons, represented by blue dots, are excited from the VB to the CB, leaving holes, shown as red dots, in the VB. The energy gap between these bands is indicated as 1.40 electron volts. A green arrow points from carbon dioxide to carbon monoxide and methane, indicating the reduction process. A red arrow shows the movement of holes from water to oxygen. The KL substrate is depicted at the bottom, with the Py component above it. A sun symbol in the top right corner represents solar irradiation driving the process.
Conclusion
In this study, we successfully directly composited the natural mineral KL with its associated mineral Py using a mechanical ball-milling method, thereby constructing a KL/Py composite photocatalyst with a tight heterojunction interface. Mechanical ball milling not only achieves the nanoscale reduction of Py and the partial exfoliation of KL layers but also induces the transfer of interface electrons from Py to KL through mechanochemical interactions, forming atomic-scale tight contacts. The composite material with the optimal ratio exhibited excellent photocatalytic CO2 reduction performance under simulated sunlight, with a yield of 89.5 μmol g–1 h–1, which was 2.3 times that of pure Py, and its activity remained stable after four cycles. KL plays multiple synergistic roles in the composite material, including acting as an electron acceptor to prolong carrier lifetime, serving as a CO2 adsorption platform to improve adsorption capacity and functioning as a physicochemical barrier to effectively suppress the photocorrosion of Py.
This work demonstrates a technical approach for constructing highly efficient photocatalysts through simple solid-state processing using combinations of natural minerals and their associated minerals. The approach offers distinct advantages such as low cost, simple operation and ease of scaling up, providing a new theoretical basis for the value-added utilization of clay minerals and the design of natural mineral-based photocatalysts.
Supplementary material
The supplementary material for this article can be found at https://doi.org/10.1180/clm.2026.10040.
Data availability
The datasets generated and analysed during this study can be obtained from the corresponding author upon reasonable request.
Financial support
This work is supported by the National Natural Science Foundation of China (No. 42377227).
Competing interests
The authors declare none.