
I. INTRODUCTION
Bulk metallic glasses (BMGs) have attracted dramatic attention in the materials science community due to their extraordinary properties; e.g., their amorphous atomic structure gives rise to distinctive mechanical properties such as high fracture strength, high hardness, and large elastic strain limit in contrast to common engineering materials. Reference Greer1–Reference Inoue and Takeuchi4 However, BMGs usually fail catastrophically without any macroscale plastic deformation due to fast propagation of a major shear band. Reference Liu and Zhang5,Reference Sun and Wang6 Therefore, many efforts have been carried out to reinforce and improve the ductility and toughness of BMGs during the last decade. Reference Schuh, Hufnagel and Ramamurty3,Reference Gludovatz, Naleway, Ritchie and Kruzic7–Reference Park and Kim9 Since shear bands play a central role in plastic behaviors of BMGs, it has been widely accepted that the plasticity of BMGs can be improved by introducing heterogeneity to arrest the propagation Reference Brink, Peterlechner, Rösner, Albe and Wilde10 or delocalize the formation of shear bands. Reference Schuh, Hufnagel and Ramamurty3,Reference Greer and Ma11
In this regard, introducing second phases has been used as a common technique to reinforce and improve the ductility or toughness of glassy materials. Reference Park and Kim9–Reference Das, B.Tang, Kim, Theissmann, Baier, Wang and Eckert20 The most commonly used approach is to produce a microstructural composite of amorphous matrix embedded with crystalline particles or dendrites. The second crystalline phase may act as initiation sites for shear band forming and therefore increase the number of shear bands throughout the specimen. Reference Park and Kim9 For example, partial crystallization by nucleation and subsequent dendritic growth of β phase by controlling the cooling process of solidification as shown in Ref. Reference Hays, Kim and Johnson18 gave rise to a significant increase in the failure strain and toughness of Zr–Ti–Cu–Ni–Be metallic glass (MG). Hofmann et al. also significantly increased the ductility and toughness of Ti–Zr-based BMG composite by combining a body-centered cubic dendrite and the glass matrix. Reference Hofmann, Suh, Wiest, Duan, Lind, Demetriou and Johnson19 Their macroscale tensile specimens underwent a plastic deformation in a ductile manner demonstrating a considerable necking (50% reduction in area) in the gauge section. In addition, Wu et al. Reference Wu, Chan, Jiang, Chen and Wang17 investigated the influence of the B2 crystalline phase on the mechanical properties of CuZr-based BMG and showed that the capability of the plastic deformation of the B2-BMG composite was improved under tension with a total engineering strain of 22.3% (19.3% plastic strain).
Nanolaminates composed of alternating layers of glassy and nanocrystalline metals have also been suggested as an alternative method to improve the mechanical performance of BMGs. Reference Kim, Jang and Greer21–Reference Guo, Jägle, Yao, Maier, Korte-Kerzel, Schneider and Raabe23 Kim et al. synthesized nanolaminate of Cu50Zr50 MG and nanocrystalline Cu which demonstrated 25% increase in strength and about 4% fracture strain by suppressing the instantaneous catastrophic failure often associated with MG. Reference Kim, Jang and Greer21 Guo et al. also synthesized multilayer composites of amorphous Cu54Zr46 and nanocrystalline Cu. Reference Guo, Jägle, Yao, Maier, Korte-Kerzel, Schneider and Raabe23 They found that an increase in Cu layer thickness can suppress catastrophic propagation of shear bands and promote the ductility of the MG matrix.
While all aforementioned reinforcements either mainly serve as sites to initiate the formation of multiple shear bands (e.g., addition of crystalline particles) or block the propagation of shear bands (e.g., formation of amorphous–crystalline nanolaminates), in this study, we propose to use graphene as the reinforcement in BMGs to enhance their ductility and toughness; owing to its ultrastrong in-plane structure but weakly bonded interface with the MG matrix, graphene has the potential to play dual roles and act as both sources for shear bands formation and barriers to shear band propagation. Some previous studies have already demonstrated the reinforcing influences of carbon nanotubes (CNTs) on the elastic–plastic behavior of BMGs. Reference Hsu, Lin and Lee8,Reference Bian, Pan, Zhang and Wang24,Reference Zhao, Li, Gao, Bai and Misra25,Reference Rezaei, Shariati, Tavakoli-Anbaran and Deng42 For example, Zhao et al. Reference Zhao, Li, Gao, Bai and Misra25 have reported 24 and 250% improvement in the compressive strength and ductility of Mg-based metallic glass with 3 vol% of CNT. Furthermore, Siegrist and Löffler Reference Siegrist and Löffler16 mixed graphite particles with the BMG matrix Zr52.5Cu17.9Al10Ni14.6Ti5 and found that with an optimal graphite particle size a maximal plastic strain of 18.5% can be obtained in the BMG without causing a decrease in the strength. Although no experimental studies have been reported on adding graphene sheets to BMGs, as an intriguing advantage, they can be used for all different compositions of amorphous alloys and their application as a reinforcement is not restricted by the agents related to the constituent elements and contents. In addition, as compared to other types of heterogeneity (crystalline embedment, second phase nanoparticle, or CNT), the large surface area of graphene has the potential to more effectively block the propagation of shear bands.
Hence, in this research, we propose to investigate the potential improvement of graphene addition on the mechanical characteristics and especially ductility and toughness of BMGs by using molecular dynamics (MD) simulations. Various models of Cu–Zr based BMGs containing continuous (long) or discontinuous (short) graphene sheets were constructed. They were then imposed to tensile loading to examine their mechanical behavior and deformation mechanism. Different arrangements and relative lengths of the reinforcement were considered to find out their impact on the elastic and plastic deformation of the graphene-reinforced metallic glass nanocomposite (G-MGC) specimens. It is also hoped that the G-MGC can serve as a model system to evaluate the effectiveness of both approaches (e.g., initiation of multiple shear bands and blockage of shear band propagation) on the ductility and toughness improvement in general BMGs, thus guiding the design of novel BMGs that are both strong and ductile.
II. METHODOLOGY
A. Interatomic potentials
In this study, embedded-atom method (EAM) potential Reference Sheng, Kramer, Cadien, Fujita and Chen26 was used to describe the atomic interactions of the metallic atoms of the MG matrix. Tersoff potential Reference Tersoff27 was adopted to represent the covalent C bonds of the reinforcement, which has been widely used to model graphene and CNTs. Reference Lindsay and Broido28–Reference Tjong33 The potential parameters were taken from Ref. Reference Kınacı, Haskins, Sevik and Çağın31. To validate the reliability of the potential for the graphene model, a monolayer graphene sheet was constructed and exposed to an in-plane tension. The values of 1.07 TPa, 192 GPa, and 0.36 were obtained for Young’s modulus, tensile strength, and fracture strain, respectively, which are in good agreement with those reported in the literature (e.g., Ref. Reference Ni, Bu, Zou, Yi, Bi and Chen34).
As a common approach, Lennard–Jones (LJ) potential has been widely used to represent the van der Waals type interaction in the nonbonded interface of CNT and graphene with metal matrices. Reference Arcidiacono, Walther, Poulikakos, Passerone and Koumoutsakos35–Reference Liu, Wang, Wu and Wang41 For example, Kim et al. Reference Kim, Lee, Yeom, Shin, Kim, Cui, Kysar, Hone, Jung, Jeon and Han39 used LJ 12-6 energy function to describe the nonbonded Ni–C interfacial interaction in Ni–graphene multilayered composite which was derived based on their density functional theory (DFT) calculations. Furthermore, LJ potential has also been used by Choi et al. Reference Choi, Yoon and Lee40 to represent the nonbonded interface of CNT and Al and by Liu et al. Reference Liu, Wang, Wu and Wang41 to describe the interactions of C–Cu and C–Ni in graphene-metal nanolayered composites, respectively. In this regard, the LJ 12-6 energy function was adopted in the present study to model the interactions of C atoms in graphene with Cu and Zr atoms in the metal matrix. More details about the calculation of the potential parameters for the C–Cu and C–Zr interfacial pairs can be found in the previous publication of the authors, Reference Rezaei, Shariati, Tavakoli-Anbaran and Deng42 in which the geometric and arithmetic average have been used to obtain the ε and σ, respectively. The potential parameters were obtained from the literature studies Reference Filippova, Kunavin and Pugachev43–Reference Kang, Choi, Lee, Kwon and Hwang45 and the cutoff distance was set to be r c = 9 Å.
The total potential energy of the G-MGC was thus calculated by adding the three aforementioned potentials as in Eq. (1):
 $$E_{{\rm{total}}} = E_{{\rm{eam}}} + E_{{\rm{Tersoff}}} + E_{{\rm{LJ}}}^{{\rm{C - Cu}}} + E_{{\rm{LJ}}}^{{\rm{C - Zr}}}$$
in which
 $E_{{\rm{eam}}}$
and
 $E_{{\rm{Tersoff}}}$
stand for the EAM potential of the matrix and Tersoff potential of the reinforcement, respectively.
 $E_{{\rm{LJ}}}^{{\rm{C - Cu}}}$
and
 $E_{{\rm{LJ}}}^{{\rm{C - Zr}}}$
denote the LJ potentials of the C interface with Cu and Zr elements of the matrix, respectively.
B. Simulation setup
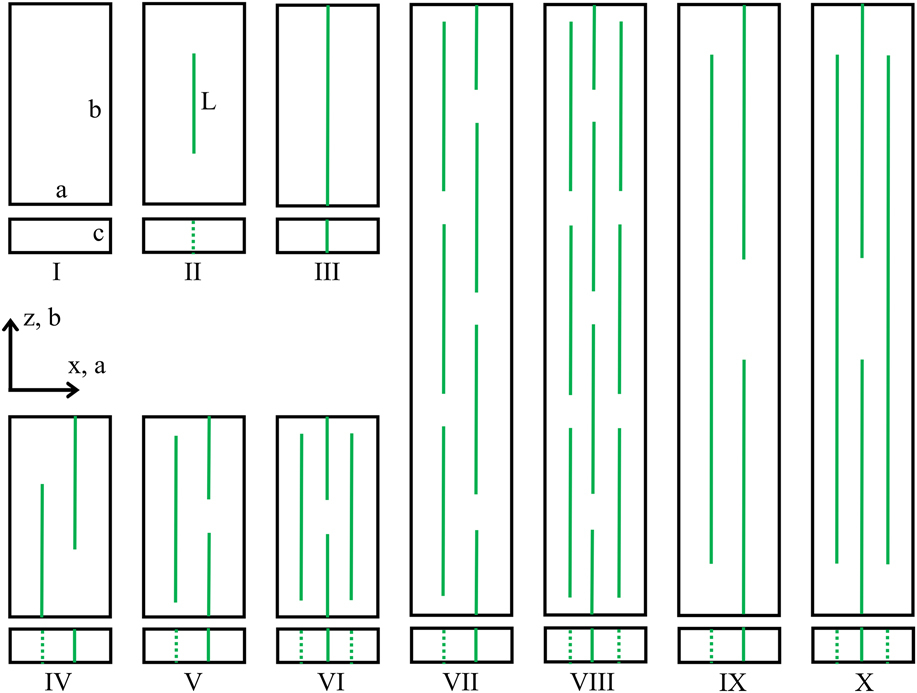
The numerically well-tempered Cu64Zr36 amorphous alloy of dimensions 300 × 300 × 300 Å produced in the previous work Reference Rezaei, Shariati, Tavakoli-Anbaran and Deng42 was used as the base material to construct the matrices of the G-MGCs. Figure 1 illustrates the schematic diagrams of the various configurations of the graphene and the MG matrices considered in this study. In total, 10 different models named specimen I, II … X were constructed. This figure shows the front view (xz-plane) and the top view (xy-plane) of each specimen in which a, b, and c indicates the thickness, height, and depth of the specimens, respectively. Overall, two different sized monolithic MGs were taken into account as represented by specimen I in Fig. 1. In the first one, a = 150 Å, b = 300 Å, and c = 30 Å, which is the unreinforced MG counterpart of the composite models II, III, IV, V, and VI (named, short specimens). In the second one, a = 150 Å, b = 900 Å, and c = 30 Å, which corresponds to the monolithic MG counterpart of the reinforced composites VII, VIII, IX, and X (named, long specimens). Boundary conditions of all the specimens were set to shrink-wrapped (F) along x-axis and periodic (P) along y- and z-axes. Here the shrink-wrapped surfaces along the x-direction are necessary which allow the shear banding to occur in MGs. An isothermal–isobaric ensemble, NPT, and a canonical ensemble, NVT, were utilized for equilibration and loading processes, respectively, during which the temperature was kept constant at 10 K. Time step was 1 fs for all the simulations and each specimen was relaxed for 100 ps before being loaded. The tensile deformation was applied by uniformly stretching the sample along z direction at a constant strain rate of 108 s−1. The MD code large-scale atomic/molecular massively parallel simulator was used to perform all the simulations. Reference Lewandowski and Greer46
Schematic diagrams of MG and G-MGC test specimens containing long or short graphene. The various arrangements are illustrated by both front and top views in each model.

Different lengths and arrangements of graphene were taken into account to reinforce the MG matrix. The graphene can be categorized into two distinct classes in a length standpoint. In the first class, the graphene is continuous and has a long length in z-direction, i.e., specimen III, which is repeated on both periodic boundaries along the axis z. This is the ideal case that one can approach for a G-MGC. In the second class, the graphene is discontinuous and has a short length which is embodied in all other specimens to reinforce the MG matrices. The second class should better represent the dispersion of graphene in real-life samples, but both are considered in this study for comparison purposes. As shown in Fig. 1, specimens II, IV, V, and VI are short ones and reinforced with one, two, three, and four short graphene sheets, respectively. Specimens VII, VIII, IX, and X are long ones and reinforced with seven, ten, three, and four short graphene sheets, respectively. Although the exact arrangement of graphene in those samples will be impractical to achieve experimentally, it provides insight into the potential reinforcing roles of graphene sheets in improvement of plasticity in amorphous metals.
III. RESULTS AND DISCUSSION
The specimen density was calculated by adding the atomic masses of the 3 elements (Cu, Zr, and C) and dividing it by the relaxed volume of each specimen. Overall, the density of the composite is reduced by increasing the weight fraction of the reinforcement. Table I shows the atomic and weight fractions of the graphene in each composite as well as the density of all the MG and nanocomposite specimens. In this table the results of specimen V with θ = 63.4° [as defined in Fig. 4(d)] have been reported. In calculation of mechanical properties, it was assumed that the composite material has the same properties along y- and z-axes, namely, E = E y = E z and ν = ν zy = ν zy . In other words, the material is assumed transversely isotropic with a symmetric plane normal to direction x. This assumption is reasonable since all materials considered in this study are periodic in directions y and z and the in-plane properties of the graphene sheets are nearly identical. Moreover, the weight fraction of the graphene is very small in comparison to the matrix, which is isotropic due to its amorphous structure. The value of the strain-energy density obtained at rupture strain is known as the toughness (the modulus of toughness) of the material. Reference Beer and Johanston47 It is equal to the area under the entire stress–strain curve and represents the energy per unit volume required to cause the material to rupture.
Atomic (at.%) and weight (wt%) fractions of added graphene and density of all the specimens. I(S) and I(L) stand for the short and long lengths of specimen I, respectively. Only the case θ = 63.4° is included for specimen V.

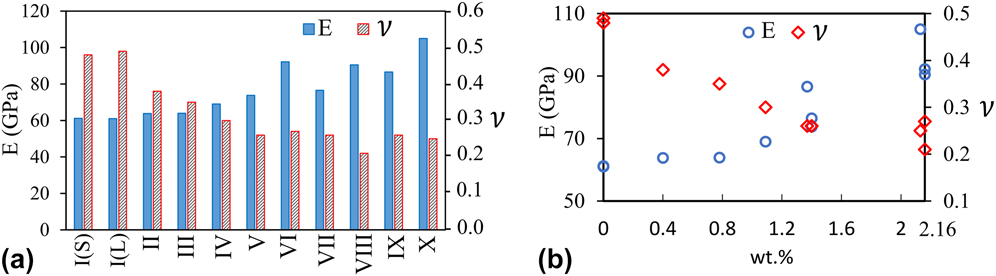
Figure 2(a) depicts the estimated Young’s modulus (E z ) and Poisson’s ratio (ν zy ) for all the specimens from I to X. Only the results of specimen V with θ = 63.4° have been reported in Fig. 2. Figure 2(b) shows the elastic modulus and Poisson’s ratio as a function of the weight fraction of the reinforcement. Generally, the Young’s modulus of the samples increased by increasing the reinforcement weight fraction while the Poisson’s ratio decreased. However, it is observed that while the weight fraction of graphene in sample V (1.4 wt%) and sample IX (1.37 wt%) is similar, the long sample (IX) has a higher Young’s modulus than the short sample (V). A similar trend is also found between sample VI (2.16 wt%) and sample X (2.13 wt%) that the long sample (X) has a higher Young’s modulus than the short sample (VI). A possible explanation is that in the short sample (e.g., sample V), the density of the interfaces between the edge of the graphene and the MG is higher than that in the long sample of similar wt% of graphene (e.g., sample IX). Since those interfaces mainly serve as stress concentration (weak points) that eventually lead to the yielding and formation of shear bands, the short samples tend to have a slightly lower Young’s modulus than the long ones of similar wt% of graphene.
Estimated Young’s modulus and Poisson’s ratio along the tension axis z (a) for all the MG and nanocomposites specimens, I … X, and (b) as a function of the wt% fraction of C atoms of the graphene. I(S) and I(L) stand for the short and long lengths of specimen I, respectively.

It is also important to note that due to the relative small size of the simulated MG as compared to real-life samples, the Poisson’s ratio for the simulated monolithic glass is ∼0.5, which is higher than that reported for typical experimental samples (∼0.31–0.38 Reference Mattern, Bednarcik, Pauly, Wang, Das and Eckert48–Reference Duan, Blauwe, Lind, Schramm and Johnson50 ). Such size effect was further proved by simulating a bigger sample with two times thicker in x-direction than sample I, from which a Poisson’s ratio of ∼0.4 was obtained. In the following, the results obtained for the short specimens including I (b = 300 Å), II, III, IV, V, and VI are first discussed and the mechanical behaviors of the nanocomposites are compared with those of the monolithic MGs. Similar discussions are then provided for long specimens I (b = 900 Å), VII, VIII, IX, and X in the next subsection.
A. Short specimens
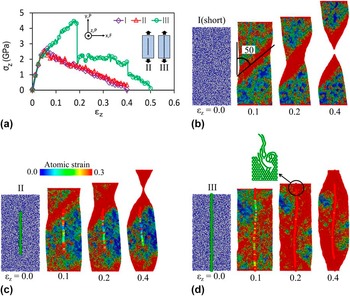
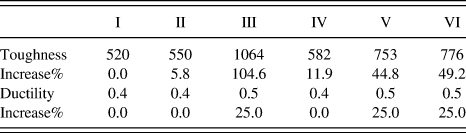
Figure 3 shows the stress–strain curves and deformation mechanisms for specimens I, II, and III under the tensile loading along z direction. The deformed structures were shown in a color spectrum of atomic strain. The insets of Fig. 3(a) indicate the coordinate axes along with their corresponding boundary conditions and the configurations of the nanocomposites. As can be seen in Fig. 3(a), no strengthening was observed by adding short graphene (L = 153.5 Å) in specimen II. In contrast, the long graphene in specimen III strengthened the MG and increased the tensile strength and strain by 67.3% and 195%, respectively, and enhanced the toughness and ductility by 90.6% and 25%, respectively, as shown in Table II. Figure 3(b) illustrates the deformation mechanism in specimen I for the applied strains 0, 10, 20, and 40%. The specimen started to plastically deform at its yield strength by a strong localization through a shear band formation. Shear banding as the dominant deformation mode of MGs Reference Lewandowski and Greer46,Reference Greer, Cheng and Ma51–Reference Bei, Xie and George53 is very common in MD simulations especially at low temperatures. Reference Feng, Qi, Wang, Pan, Ma, Zhang, Li and Liu54–Reference Cao, Cheng and Ma60 The plastic deformation was localized through a shear band and a neck region formation. The necking progressed gradually and extensively before fracture as similar to crystalline materials, which resulted in the large tensile ductility 40% as shown in Fig. 3(a). It is important to note that the high ductility in MG predicted here is very common from MD studies, Reference Albe, Ritter and Şopu59,Reference Li and Li61–Reference Feng, Qi, Li and Liu64 which is largely due to the usually 10 orders of magnitude higher strain rate than experimental and the nanoscale sizes (particularly in length) of the simulated sample. Therefore, the value of ductility and the toughness measured in this work will only serve as an indicator to evaluate the mechanical behavior of samples with similar size under the same testing conditions. Nevertheless, recent experimental studies showed that nanoscale MG samples can deform in a ductile manner without catastrophic failure, for example, Guo et al. Reference Guo, Yan, Wang, Tan, Zhang, Sui and Ma65 have reported large tensile ductility (23–45%) for small size MG samples. Moreover, the obtained stress–strain curve, yield strength, shear banding, and necking here are in good agreement with those experimentally performed by Tian et al. for nanosized monolithic Cu–Zr MGs. Reference Tian, Shan and Ma66
Stress–strain curves for specimens I, II, and III (a), deformation mechanism of specimen I (b), specimen II (c), and specimen III (d) at different strains under a tensile load along the axis z.

Toughness (MJ/m3) and ductility of short specimens II, …, VI and its increase percentage with respect to monolithic counterpart specimen I (b = 300 Å). Only the case θ = 63.4° is included for specimen V.

As indicated in Fig. 3(b), the shear band plane was inclined at ∼50° to the loading axis which is larger than the angle of maximum shearing plane. This observation is in good agreement with the experimental results available in the literature for MGs. For instance, Gao et al. Reference Gao, Wang, Bei and Nieh67 reported deviation of the shear band direction from the ideal angle π/4 for various compositions of glassy alloys under compressive and tensile loading conditions. Different values for fracture or shear band angle from 39.4 to 46° under compression and from 48 to 60° under tension have been reported in Ref. Reference Gao, Wang, Bei and Nieh67 depending on the composition of the MGs.
Figure 3(c) illustrates the deformation behavior of specimen II at different strains in which the shear banding occurred as similar to specimen I. It is indicated by the red color that during the tensile loading, both the MG matrix and the graphene sheet were stretched. The graphene layer shifted the shear band plane to the unreinforced portion of the matrix. On the other hand, Fig. 3(d) shows the deformation mechanism of specimen III, in which the applied strain was not localized at a single shear band and the continuous graphene caused the external load to be distributed through the entire composite, leading to a large plasticity. The sample was failed from where the graphene was broken as shown in the inset of Fig. 3(d).
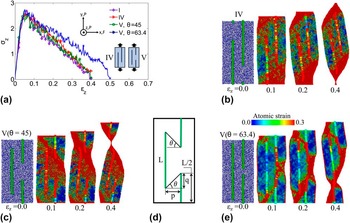
Figure 4(d) explained the gap angle formed between two neighboring graphene end edges in which p and q indicate the separation of two neighbor graphene sheets and their coincident portions along the axis z, respectively. The angle is thus obtained as
 $\tan \,\theta = {q \over p} = {{2L - b} \over {2p}}$
Stress–strain curves for specimens I, IV, and V (a), deformation mechanism and failure of specimen IV (b), and specimen V with gap angle θ = 45° (c), and θ = 63.4° (e) at different strains under a tensile load along the axis z. (d) Definition of the gap angle θ between two neighbor reinforcements.

, where L and b stand for the reinforcement length and the specimen height as shown in Fig. 1. The angle (θ) can be modified by changing the length of graphene layers and their separation distance. The calculated stress–strain curves for specimens IV and V are presented in Fig. 4(a) along with specimen I of the same size for the purpose of easy comparison. It is found that the configuration of specimens IV and V with θ = 45° did not strengthen the composite, while another configuration of V (θ = 63.4°) could increase the plastic limit by ∼25% and the toughness by 44.8% (Table II). As can be concluded from Fig. 4(e), the graphene nanosheets performed two important roles resulting in a remarkable improvement in the nanocomposite ductility and toughness in the nanocomposite. First, they could block the propagation of the shear band at the early stage because of their strong in-plane structure. Second, the edges of the graphene sheets increased the nucleation sites of plastic deformation and delocalized the applied strain energy.
For specimen IV (L = 200.4 Å), by repeating the sample in the periodic loading direction, a gap can be imagined between the reinforcements where the shear band could pass and caused the composite to fail without any strengthening. In Fig. 4(c) since the angle is θ = 45°, the arrangement of the reinforcements could not prevent the shear band from growing through the gap. By increasing the angle to θ = 63.4° which is larger than the MG shearing direction, the applied strain load was spread at more local sites and the nanocomposite ductility was thus enhanced as seen in Fig. 4(e). Slipping was observed between the reinforcement and matrix under the applied stretching load which significantly enlarged the gap size θ and reduced the gap angle without breaking the graphene, which eventually resulted in a graphene-free path for the shear band to be formed. This shows that the reinforcement-matrix interfacial reaction could not bear the transferred shear stresses in the plastic region. This fact reveals the important reinforcing effects of the graphene–matrix interface in strengthening MGs which was modeled by a van der Waals potential. Hence, the MG ductility should be more enhanced by making the interface stronger, for example, by chemically bonding the metal matrix particles and the graphene C atoms in fabrication of real-life materials. Reference Kim, Cha, Gemming, Eckert and Hong68–Reference Georgakilas, Otyepka, Bourlinos, Chandra, Kim, Kemp, Hobza, Zboril and Kim72
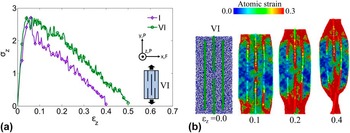
Figure 5 shows the stress–strain curves and atomic strain for specimens VI and I subjected to a tensile loading along the axis z. As can be seen in Fig. 5(a), both the elastic and plastic properties of the G-MGC were improved by graphene addition with the special reinforcement arrangement in specimen VI. The ductility and toughness of specimen VI were enhanced by ∼25% and 49.2%, respectively, due to the delocalizing of the plasticity as illustrated in Fig. 5(b). By further stretching the sample, the reinforcements slipped inside the matrix and the gap angle θ was reduced. The shear band thus grew and finally failed the composite without breaking the graphene structures.
(a) Stress–strain curves of specimens I and VI, and (b) deformation mechanism of specimen VI at different strains under a tensile load along the axis z.

While Figs. 4 and 5 both show that short graphene can dramatically improve the ductility and toughness of MGs, such improvement was not observed by adding CNTs as having been shown in a previous study Reference Rezaei, Shariati, Tavakoli-Anbaran and Deng42 although CNTs and graphene share many common properties such as the ultrahigh yield strength and modulus. Because of their tubular geometry and dramatically smaller surface area than graphene, CNTs cannot serve as effective barriers as graphene in growing path of shear bands which is the key to enhance the ductility and toughness of MGs imposed to tensile loading. In addition, while the MD simulations used a dramatically higher tensile strain rate of 108 s−1 than typical experiments, the strategy to delocalize plastic deformation in graphene-reinforced MGs as shown in Figs. 4 and 5, e.g., by forming multiple shear bands and arresting the propagation of shear bands, is found to be consistent with previous findings in various MG-based composites synthesized experimentally with second phase particles Reference Park and Kim9–Reference Das, B.Tang, Kim, Theissmann, Baier, Wang and Eckert20 or forming crystalline–amorphous nanolaminates, Reference Kim, Jang and Greer21–Reference Guo, Jägle, Yao, Maier, Korte-Kerzel, Schneider and Raabe23 although no direct experimental results are available for graphene-reinforced MGs.
B. Long specimens
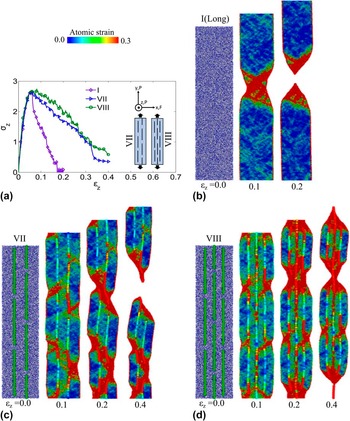
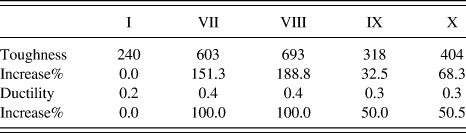
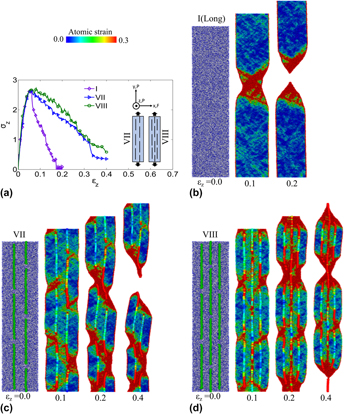
Due to the limitations of MD simulations, a periodic boundary condition along the z direction was used in the previous models by using a length of b = 300 Å to represent the experimentally available samples of significantly larger size. While this technique is widely used in MD simulations, the selection of periodic length may cause some artificial size effects. To extrapolate or better predict the mechanical properties of real-life samples, Fig. 6 shows the stress–strain curves and deformation mechanisms for the long MG and G-MGC specimens including I (b = 900 Å), VII, and VIII exposed to a tensile load along the axis z. These specimens are three times longer than the short ones and they contain more number of short graphene sheets. As shown in Fig. 6(a), the graphene addition did not improve the yield strength of the matrix. This is because the applied strain load concentrated on the regions between the graphene layers. However, significant improvements by 100% in ductility and also 151.3% in toughness (Table III) were obtained in comparison to the monolithic MG sample.
Stress–strain curves for specimens I, VII, and VIII (a), deformation mechanism of specimen I (b), specimen VII (c), and specimen VIII (d) at different strains under a tensile load along the axis z.

Toughness (MJ/m3) and ductility of long specimens VII, …, X and its increase percentage with respect to counterpart monolithic specimen I (b = 900 Å).

Figure 6(b) illustrates the deformation mechanism of specimen I at various applied strains, which showed that the specimen deformed plastically by a single shear band formation across the material. Figure 6(c) shows the deformation mechanism of the nanocomposite VII (embedding seven short graphene layers with separation 50 Å along x-axis) at various steps of the loading. Some small localized shear bands formed between the graphene sheets which were blocked by the graphene layers on the other side. However, the relative movement of the graphene sheets made the gap angles smaller and created a major shear band which eventually failed the material.
The same deformation mechanism was observed for specimen VIII which consisted of ten short graphene sheets in three lines with 37.5 Å separation between them as shown in Fig. 6(d). Here, the plastic deformations started from the two free surfaces of the matrix close to the graphene ends. The middle reinforcements restricted the shear bands from passing through the specimen. The composite eventually failed because of slipping at the interfacial planes between the reinforcements and the matrix without any breaking at the graphene structures.
In real-life specimens of dramatically larger size (or length along z to be more specific) than in MD simulations, the improvement in ductility and toughness in the graphene/MG composites as compared to monolithic MG should be even more pronounced than that shown in Fig. 6. The reason is that the deformation in the graphene/MG composite is more or less homogeneous, and an increase in the periodic length will also result in the increase of possible sites for shear band formation, causing the ductility and toughness to be almost unchanged at larger size. In contrast, since the plasticity of monolithic metallic glass is limited to a single shear band with similar size regardless of the length, the ductility in terms of percentage in elongation should be dramatically decreased when the sample length is further increased. This trend is well demonstrated by comparing the stress–strain curves shown in Figs. 4 and 6.
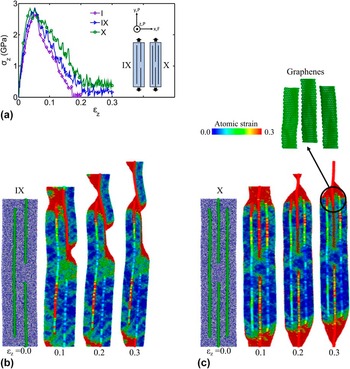
To further prove that the extraordinary enhancement of ductility and toughness in MG-graphene composites shown in Fig. 6 was mainly due to the increased number of sites for initiating shear bands and blocking role of the graphene layers, not by the overall wt% of graphene, we constructed specimens IX and X which consisted of three and four longer graphene sheets (L = 750 Å), respectively, with different arrangements. The graphene sheets were longer but a lower number in comparison to specimens VII and VIII. The obtained stress–strain curves for specimens IX and X under a tensile loading along the axis z are shown in Fig. 7(a). As can be seen, the graphene addition increased the ductility and toughness (as shown in Table III) of the MG for both specimens. However, the improvement of ductility and toughness in specimens IX and X was much lower than the specimens VII and VIII. The reason is that the population of the reinforcements and therefore the density of gaps between them were lower than that in specimens VII and VIII which caused the externally applied strain energy concentrated at fewer local initiation sites and the nanocomposites thus failed at a considerably smaller plastic strain limit.
Stress–strain curves for specimens I, IX, and X (a), deformation mechanism of specimen IX (b), and specimen X (c) at different strains under a tensile load along the axis z.

The detailed deformation of specimen IX is demonstrated in Fig. 7(b) by various snapshots of the strained sample. The three gaps acted as initiation sites to be plastically deformed under the external applied load. Here the gap angle θ was always high so that the graphene did not allow the locally formed shear bands to grow across the material. However, the reinforcement-matrix interfacial interactions could not resist the graphene from slipping. Figure 7(c) illustrates the deformation mechanism of specimen X at various steps of the tensile loading test. The matrix started to plastically deform from the free surfaces through the unreinforced portions. Meanwhile, the graphene slipped under the applied tensile load which eventually caused the nanocomposite to be fractured through the localized strains at the end parts of the sample. The inset of Fig. 7(c) shows the graphene layers of the fractured nanocomposite maintaining their perfect structures.
IV. CONCLUSIONS
In summary, we investigated the dual roles of graphene interface to enhance the ductility and toughness in amorphous MGs. We therefore constructed various models of G-MGCs by considering different numbers, arrangements, and lengths of the reinforcement to simulate real samples with different graphene sizes and weight fraction. Continuous graphene was the ideal reinforcing case for which the strength and plastic region of the nanocomposite were both dramatically enhanced. They also made the external applied strain load to be spread throughout the material. It needs to be mentioned that although it is not practical to synthesize graphene sheet of infinite size as assumed for the continuous graphene in the MD simulations, with the rapid progress in synthesizing large-area graphene in the industrial scale, it is possible to approach the ideal reinforcing case in metallic glass by graphene in the near future. Nevertheless, even short graphene nanosheets, which are closer to their real-life reinforcing applications, could significantly enhance stiffness, ductility, and toughness of the MGs. They played two key roles to reinforce the amorphous matrices that prevented the formation of a single shear band and therefore delocalized the plastic deformation:
-
(1) First, their end edges along the loading axis acted as initiation sites for shearing deformation leading to increase the number of local shearing bands.
-
(2) Second, the strong structure of the graphene restricted the locally formed small shear bands to grow and move across the matrix.
In this regard, graphene with large surface area can most effectively provide strong barriers to block shear band formation and propagation in comparison to other second phases such as CNTs. Reference Rezaei, Shariati, Tavakoli-Anbaran and Deng42 It is also worth mentioning that due to the computational limitations, the size of both the graphene and the metallic glass studied in this work is dramatically smaller than typically available in real-life samples. By scaling the dimensions of both the metallic glass and the graphene sheets used in current study to realistic samples, it is hoped that the experimentally synthesized graphene with a much larger size should also be effective in initiating and blocking shear bands of a wider width about 10 nm to be expected in real-life metallic glass. However, the slipping movements of the reinforcement inside the matrix opened the path for small shear bands to grow and finally fail the composite. In practice, functionalization of the graphene sheets to enhance their bonding between the BMG matrix will be needed to avoid early failure of the composite.
In brief, both the type and distribution of heterogeneity should be taken into account in designing real-life BMG-based engineering composite materials with enhanced ductility and toughness.
ACKNOWLEDGMENTS
R. Rezaei would like to acknowledge Shahrood University of Technology, Ministry of Science, Research and Technology of Iran, and University of Manitoba for providing a research sabbatical. This work was made possible by the facilities of the Shared Hierarchical Academic Research Computing Network (SHARCNET: www.sharcnet.ca) and Compute/Calcul Canada.