INTRODUCTION
The family Mactridae Lamarck (1809) is a worldwide family represented almost in all seas (Keen, Reference Keen and Moore1969). It dates from the lower Cretaceous of North America (Skelton & Benton, Reference Skelton, Benton and Benton1993). In the western Atlantic, after a taxonomic review of the whole family, Signorelli & Pastorino (Reference Signorelli and Pastorino2011, Reference Signorelli and Pastorino2012) restricted to seven the species for the Magellanic zoological province and to seven for the Argentine provinces. Alcide d'Orbigny (Reference Orbigny and Bertrand1846) proposed from the Argentine province, four species, including Mactra isabelleana, described from Maldonado Bay, Uruguay. However, this species ranges from Rio de Janeiro (~22°S), Brazil to the San Matías Gulf (~41°S), Argentina (Signorelli & Pastorino, Reference Signorelli and Pastorino2012, and literature therein). This is a burrowing species commonly sampled from muddy and sandy bottoms along the Buenos Aires coast and Río de la Plata estuary. Its presence along the study area (around 20 degrees of latitude) suggests a tolerance to different environmental factors that could be influencing the shell shape. This variation was only recently mentioned by Scarabino et al. (Reference Scarabino, Zaffaroni, Clavijo, Carranza, Nin, Menafra, Rodríguez-Gallego, Scarabino and Conde2006).
The morphological analysis of the shell plays an important role in diverse fields such as taxonomy, evolution, functional anatomy, or fisheries management of molluscs. The shell is generally the most conspicuous part of the mollusc body and, to a large degree, also the most variable in shape. Because intra- and inter-specific variation in shell morphology is the result of the combined effects of genetic differentiation and phenotypic plasticity, its study constitutes a key element (e.g. Stanley, Reference Stanley1970; Gould, Reference Gould1971; Ackerly, Reference Ackerly1992; Manuel & Dadswell, Reference Manuel and Dadswell1993; Gaspar et al., Reference Gaspar, Santos, Vasconcelos and Monteiro2002; Ubukata, Reference Ubukata2003; Márquez et al., Reference Márquez, González-José and Bigatti2011). The molluscs are restrained by different biological and environmental processes, which are recorded in the ontogeny (Palmer et al., Reference Palmer, Pons and Linde2004; Krapivka et al., Reference Krapivka, Toro, Alcapán, Astorga, Presa, Pérez and Guiñez2007; Márquez et al., Reference Márquez, Amoroso, Gowland Sainz and Van der Molen2010a). These processes change the external morphology of taxa. Modern morphometric methods could be an excellent way to quantify and study these changes. Traditional morphometric methods present difficulties for the assessment of shell shape variation (Sokal & Rohlf, Reference Sokal and Rohlf1995), because the results are very sensitive to the particular distances and ratios chosen. These measurements are highly correlated with size (Bookstein, Reference Bookstein1991; Zelditch et al., Reference Zelditch, Swiderski, Sheets and Fink2004) and make it difficult to obtain robust size-free shape variables. The more recently developed landmarks based method for morphometric analysis, the geometric morphometrics (GM) approach, provides an effective way to avoid confusion between size and shape by preserving shape variables throughout the analysis (Rohlf & Marcus, Reference Rohlf and Marcus1993; Adams et al., Reference Adams, Rohlf and Slice2004; Mitteroecker & Gunz, Reference Mitteroecker and Gunz2009). Several authors have worked with GM methods to report shell variation in molluscs (e.g. Chiu et al., Reference Chiu, Chen, Lee and Chen2002; Carvajal-Rodriguez et al., Reference Carvajal-Rodrıguez, Conde-Padín and Rolán-Alvarez2005; Márquez et al., Reference Márquez, González-José and Bigatti2011; Teso et al., Reference Teso, Signorelli and Pastorino2011). Studies of intraspecific shell shape variation were mentioned in several species of bivalves (i.e. Crampton, Reference Crampton1995; Ubukata, Reference Ubukata2003; Márquez et al., Reference Márquez, Robledo, Escati Peñaloza and Van der Molen2010b; Gordillo et al., Reference Gordillo, Márquez, Cárdenas and Zubimendia2011; Márquez & Van der Molen, 2011). Salinity, grain size, wave exposure, latitudinal gradient and depth have been proposed to explain intraspecific shell shape variation of bivalves (Olabarría & Thurson, Reference Olabarría and Thurston2004; Aguirre et al., Reference Aguirre, Perez and Sirch2006; Conde-Padín et al., Reference Conde-Padín, Grahame and Rolán-Alvarez2007; Krapivka et al., Reference Krapivka, Toro, Alcapán, Astorga, Presa, Pérez and Guiñez2007; Roopnarine et al., Reference Roopnarine, Signorelli and Laumer2008; Márquez et al., Reference Márquez, González-José and Bigatti2011).
The objective of this work is to compare the shell shape variation of Mactra isabelleana sampled along the Río de la Plata estuary and open sea by using GM methodology.
MATERIALS AND METHODS
Fieldwork
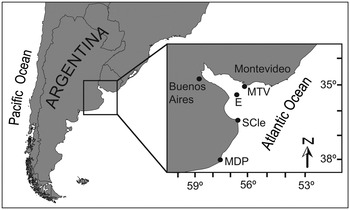
The sampled localities are from south to north: Mar del Plata (MDP, 38°00′32″S 57°31′45″W), San Clemente del Tuyú (SCle, 36°23′52″S 56°42′13″W) and Río de la Plata estuary (E, 35°38′45″S 56°53′03″W) in Argentina; and Buceo beach, Montevideo (MTV, 34°54′02″S 56°07′20″W) in Uruguay (Figure 1). The samples from MDP and E were collected with a trawling net aboard the RV ‘Puerto Deseado' in October 2009 and those from SCle and MTV by hand in the intertidal zone in November 2007.
Map of the study area showing the four sampling localities: Montevideo (MTV); Estuary (E); San Clemente del Tuyú (SCle) and Mar del Plata (MDP).

Geometric morphometrics and statistical analyses
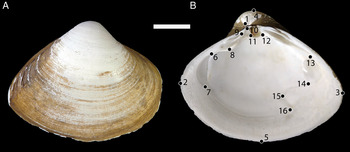
Fifteen specimens of M. isabelleana were randomly selected from each locality. All the specimens were cleaned of soft tissues and the inner side of the left valves photographed with a Nikon D100 digital camera. The forms of individuals were captured by the Cartesian coordinates of a two-dimensional configuration of 16 anatomical landmarks. To improve the identification of points, all landmarks were painted with small points of a permanent marker after capturing them (Figure 2).
(A) External view of Mactra isabelleana d'Orbigny, 1846; (B) internal view of right valves showing location of Type I and Type II geometrically homologous landmarks. These landmarks are: LM1, Umbo; LM2, anterior end; LM3, posterior end; LM4, dorsal margin; LM5, ventral margin; LM6, superior limit of the anterior adductor muscle scar; LM7, inferior limit of the anterior adductor muscle scar; LM8, distal limit of the dorsal anterior lateral tooth; LM9, inferior limit of the anterior cardinal tooth; LM10, superior limit of the anterior cardinal tooth; LM11, ventral limit of the posterior cardinal tooth; LM12, posterior limit of the resilifer; LM13, superior limit of the posterior adductor muscle; LM14, inferior limit of the posterior adductor muscle; LM15, internal limit of the pallial sinus; LM16, external limit of the pallial sinus. Scale bar = 1 cm.

All specimens were digitalized with the software TPS dig2 (Rohlf, Reference Rohlf, Marcus, Corti, Loy, Naylor and Slice1996) by one observer (J.H.S.). Landmark configurations were superimposed by generalized Procrustes analysis (Rohlf & Slice, Reference Rohlf and Slice1990; Slice et al., Reference Slice, Bookstein, Marcus, Rohlf, Marcus, Corti, Loy, Naylor and Slice1996). This procedure translates and rotates the landmark configurations to a common origin and scales them to unit centroid size. To assess and control putative allometric effects, we computed the multivariate regression of shape (Procrustes coordinates used as dependent variables) on size (independent variable). Klingenberg (Reference Klingenberg2008) suggested that such regression is of utility to detect and remove the effect of size, age or environmental factors before shape comparisons between groups. To evaluate the independence between the shape and size variables, we carried out a permutation test with 10,000 rounds. The principal components of shape were calculated from a principal component (PC) analysis of the variance–covariance matrix of the Procrustes coordinates to display the major features of shape variation along the axes. The variable used for size normalization was the centroid size, calculated for each specimen as the square root of the sum of the squared deviations of landmarks from the centroid (Bookstein, Reference Bookstein1991; Zelditch et al., Reference Zelditch, Swiderski, Sheets and Fink2004).
We have computed a canonical variate analysis (CVA) on the first PCs in order to recover an axis of maximum discrimination among groups. Only the first, most informative, PCs were used in order to accomplish the ‘rule of thumb' of discriminant analysis which indicates that the sample size of the smallest group (P, N = 15) needs to exceed by large amounts the number of predictor variables (16 2D landmarks = 28 shape variables or PCs). To test shape differences between localities we used an extension to the multivariate case of a multiple comparison method based on cluster analysis generated using an unweighted pair-group method with arithmetic mean (UPGMA-MDGC: Valdano & Di Rienzo, Reference Valdano and Di Rienzo2007; Márquez et al., Reference Márquez, Robledo, Escati Peñaloza and Van der Molen2010b). This new method is a hybrid technique that combines a hierarchical clustering based on Mahalanobis distances (Mahalanobis, Reference Mahalanobis1948) for hypothesis testing in multivariate cases. This method is successful in determining the number of groups in hierarchical cluster analyses. The graphical output of the MDGC test is a useful tool, since it shows a clear distinction between statistically different shell shapes from each locality as well as their relationships (Márquez et al., Reference Márquez, Robledo, Escati Peñaloza and Van der Molen2010b).
RESULTS
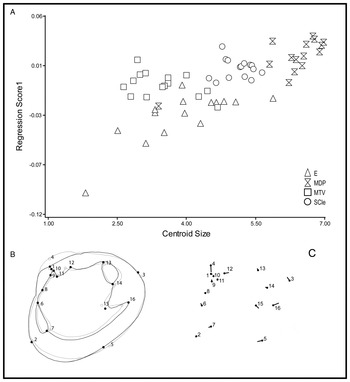
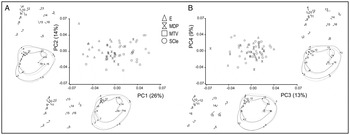
Allometric growth, in which shape varies with size, was observed. The multivariate regression of shape on centroid size was highly statistically significant (permutation test with 10,000 random permutations, P < 0.0001), and accounted for 11% of the total amount of shape variation (Figure 3). To describe the size-unrelated shell shape features, we performed a PC of the residuals from the regression of shape on centroid size (allometric correction). The first 8 PCs explained 82.5% of the total variation. The pattern of the shell shape variation is summarized in Figure 4 with scatterplots for the first four PCs of shape. The specimens from the four localities were mostly overlap. The geometrical interpretation of the positive extremes of PC1 was associated with an enlargement of the dorsoventral axis of the shell. The second PC axis was related to the development of the umbo shape and elongation of the posterior area (Figure 4A). The third PC showed a more circular shell shape and a shallower pallial sinus. Finally the fourth PC was associated with a posterior end elongation and less inflated umbo (Figure 4B).
Regression of shape onto size: (A) shape scores as a function of centroid size illustrating allometric growth of Mactra isabelleana. Shapes at the opposite extremes of the range of allometric variation are shown by using shell outlines (B), and displacement vector graphs (C); (B) the grey outline diagram shows average shell shape and the change from the grey circles to the black dots indicates the predicted landmark shift corresponding to an increase of centroid size by 7 scale factor; (C) the vector from the black dot diagram, indicates the predicted landmark shift corresponding to an increase of centroid size by 7 scale factor.

Plot of the principal components (PCs) for Mactra isabelleana localities based on Procrustes distances. The figures represent the transformation and displacement vectors from the overall mean shape (light grey outline and black dot) to the positive extreme shape (black outline and vector) for each PC. Shape changes have been exaggerated (scale factor= 0.1) in both types of graphic for better visualization: (A) PC1 versus PC2; and (B) PC3 versus PC4. Percentages of explained variance for each axis are in parentheses. See Figure 1 for localities reference labels.

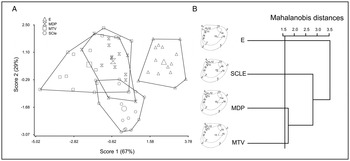
The shell shape variations among the four localities sampled, were successfully discriminated using CVA of the residuals from the regression of shape on centroid size. The first eight PCs explained collectively 83% of total variance. All of them were used to compute a CVA with the smallest sample size (P, N = 16) being twice the shape variables used as predictors. The first 2 canonical axes (CV) explained 96% of the total variance. The greatest difference in CV1 was between the E and MTV localities (Figure 5A). The most evident shell shape variation along the CV1 was the difference in the development of the umbo and the elongation of the anterior end (Figure 5A). The CV2 was mostly associated with enlargement of the dorsoventral axis of the shell (Figure 5A) and this variation was observed between SCLE and the other localities.
Shell shape differences between localities: (A) analysis of the overall shell shape variation along the first two canonical axes. The largest symbols indicate the average for each locality; (B) unweighted pair group method with arithmetic mean dendrogram showing the relationships among localities, and the diagrams of the reconstructed consensus configurations of each sampled locality. The cut-off criterion (P = 0.05) obtained with the MDGC test is indicated with a horizontal line. Four statistically different groups of shell shapes were identified by this method.

The dendrogram calculated on the Mahalanobis distance matrix showed that, even though each locality had a characteristic shell shape with statistically significant differences (P < 0.05), similarities between sites grouped them in three principal groups. In the first level group are included the specimens from MTV and MDP. The specimens from SCLE were the most related and compounded the second group. Finally, the specimens from E were the most divergent group in terms of their shell shape (Figure 5B).
DISCUSSION
In the GM method, the term shape is used to denote the geometric properties of an object that are independent of the object's overall size, position and orientation, whereas the form of an object comprises both its shape and size. The GM method allows testing separately the size and shape components of variations. In our paper, we study the shell shape variations but not shell form variation. The shape/size variation, called allometry, refers to a change in shape associated with size differences. The presence of allometry can account for a large and statistically significant proportion of morphological variation. We tested it by using a multivariate regression of shape onto size (Figure 3). The relation between size and shape was detected (allometry) which indicates that the shape variations were dependent on the size variation (Figure 3). The main shell form variation was related to the size and shape of umbo, chondrophore development and pallial sinus depth (Figure 3B, C). After this test we focused on the shell shape variation study of M. isabelleana. The unrelated-size shell shape variation observed was examined in four populations of Río de la Plata estuary and open sea. The use of the GM method revealed, with high resolution, the overall shell shape variations and significant differences between populations from different localities. The shell morphology of the specimens belonging to the MTV group was the most similar to that observed in the MDP group. The E locality was the most divergent population among the four localities sampled. The main variations in shell shape, evidenced by the PCs, were related to the enlargement of the posterior end and the development of the umbo. Both variations suggested a transition from trigonal to more elongated shells.
In natural systems, organisms face several ecological challenges and often respond with phenotypic shifts (Langerhans et al., Reference Langerhans, Chapman and Dewitt2007). Thereby, the interaction between environment and genotype affects considerably the phenotype of the organisms. The results obtained in this study suggest, environmental similarities between MDP and MTV, intermediate in SCLE and exclusive in E. The adaptations to different environments are registered on the morphology of the species. There are several publications about the relationship between shell morphology and environmental factors such as latitude, temperature, currents, depth and type of sediment (e.g. Beukema & Meehan, Reference Beukema and Meehan1985; Claxton et al., Reference Claxton, Wilson, Mackie and Boulding1998; Roopnarine et al., Reference Roopnarine, Signorelli and Laumer2008). In our study, the seasonal cycle of temperature, with cold and warm periods, affected similarly the four localities sampled (Guerrero et al., Reference Guerrero, Acha, Framinan and Lasta1997). The salinity effect over shell variation was also largely studied (e.g. Aguirre et al., Reference Aguirre, Perez and Sirch2006; Krapivka et al., Reference Krapivka, Toro, Alcapán, Astorga, Presa, Pérez and Guiñez2007; Márquez & Van der Molen, Reference Márquez and Van der Molen2011). Salinity apparently plays an important role over the morphology of M. isabelleana. This parameter is closely related to the oceanic currents and the type of sediment deposited by the basins of the Paraná and Uruguay Rivers (e.g. Stramma & Peterson, Reference Stramma and Peterson1990; Guerrero et al., Reference Guerrero, Acha, Framinan and Lasta1997; Framiñan et al., Reference Framiñan, Etala, Acha, Guerrero, Lasta, Brown, Perillo, Piccolo and Pino Quivira1999; Simionato et al., Reference Simionato, Meccia, Guerrero, Dragani and Nuñez2007). The bottom salinity values were similar in SCle and MTV (25‰) while E presented the lower values (15‰) and MDP the highest values (36‰) (Guerrero et al., Reference Guerrero, Acha, Framinan and Lasta1997; Framiñan et al., Reference Framiñan, Etala, Acha, Guerrero, Lasta, Brown, Perillo, Piccolo and Pino Quivira1999). The dispersion of the planktonic larvae in bivalves connects regional and local populations (Gaines et al., Reference Gaines, Gaylord, Gerber, Hastings and Kinlan2007). Salinity and currents, among other causes, could affect this dispersion. However, in our study we observed that the specimens belonging to the E group are living in a muddy, anoxic substrate deposited by the basins of the Paraná and Uruguay Rivers while the other groups are burrowed in muddy to sandy substrates. These clearly divergent sediment conditions support our main hypothesis that the shell shape variation could be produced by different grain size existent along localities. In addition, the direction and speed of sediment, poured by the rivers' basins facilitate the connection between the E and SCLE groups, explaining the intermediate condition of the latter. The MDP and MTV groups were the most morphologically similar due to the grain size substrate where the organisms are living. In both localities sandy bottoms are dominant (e.g. Carranza & Rodriguez, Reference Carranza and Rodríguez2007; Haeften et al., Reference Haeften, Scagliola, Comino and Gonzalez2011). The SCLE group shows an intermediate morphology between the open sea and estuary morphotypes. This locality has a sandy soft bottom influenced by the pouring of mud sediments from the rivers (e.g. Lopez et al., Reference Lopez, Penchaszadeh and Marcomini2008). Finally the grain size sampled in the E locality is dominated by a fine mud substrate.
The shell shape variation among different populations of M. isabelleana studied was revealed using GM. The presence of this species in the Río de la Plata estuary and open sea is an excellent example to test the shell shape plasticity in burrowing species affected by the substrate where they are living.
ACKNOWLEDGEMENTS
We thank the crew of the RV ‘Puerto Deseado' for their technical assistance during fieldwork. Special thanks to Fabrizio Scarabino for his cooperation in the collection of MTV samples. We are grateful to Consejo Nacional de Investigaciones de Científicas y Técnicas (CONICET) of Argentina to which G.P. belongs as a researcher and J.H.S. and F.M. as fellows. This contribution was partially supported by the projects PICT 942 and PICT 0323 from the Agencia Nacional de Promoción Científica y Tecnológica (Argentina).