


1 Introduction and Summary
Foundation models (FMs) are rapidly transforming political science research, offering unprecedented capabilities for analyzing political content (Heseltine and Clemm von Hohenberg Reference Heseltine and von Hohenberg2024; Törnberg Reference Törnberg2023; Waight et al. Reference Waight2025; Weidmann, Faulborn, and García Reference Weidmann, Faulborn and García2025). Given their widespread adoption, understanding how they process and create political information is crucial.
Extensive research documents that FMs perpetuate gender (e.g., Hofmann and Mõttus Reference Hofmann and Mõttus2025; Rudinger et al. Reference Rudinger, Naradowsky, Leonard and Van Durme2018; Zhao et al. Reference Zhao, Wang, Yatskar, Ordonez and Chang2018) and group-based stereotypes (e.g., Abid, Farooqi, and Zou Reference Abid, Farooqi and Zou2021; Lee, Montgomery, and Lai Reference Lee, Montgomery and Lai2024; Lucy and Bamman Reference Lucy and Bamman2021).Footnote 1 These systems also exhibit liberal leanings when evaluated through standardized political orientation tests (e.g., Feng et al. Reference Feng, Park, Liu and Tsvetkov2023; Rozado Reference Rozado2023; Rozado Reference Rozado2024). However, these two streams of research have developed largely in isolation, and a critical gap remains: we do not understand whether or how demographic characteristics influence the way FMs attribute political characteristics. This gap has significant implications for political science research. For example, when using FMs for labeling tasks, demographic cues could systematically influence political coding in ways that researchers do not anticipate or desire, potentially introducing confounders into measures (Knox, Lucas, and Cho Reference Knox, Lucas and Cho2022).
Unlike text-only models, vision-language models (VLMs) can process visual cues of race and gender in naturalistic stimuli and enable researchers to test political inferences of these stimuli in realistic contexts. By presenting identical political content while varying only the demographic features of individuals in images, we can isolate the effect of visual demographic information on political attributions.
Human perception research provides clear expectations for how demographic cues might influence political judgments. Decades of research demonstrate that people use demographic characteristics as heuristics for inferring political ideology: Black Americans are often assumed to be liberal, White Americans conservative, and women more left-leaning than men (Dolan Reference Dolan2014; Lerman and Sadin Reference Lerman and Sadin2016). These associations significantly influence how political candidates are perceived and evaluated, even when their actual policy positions are identical (Crowder-Meyer et al. Reference Crowder-Meyer, Gadarian, Trounstine and Vue2020; McDermott Reference McDermott1997; Sanbonmatsu Reference Sanbonmatsu2002). Research on prototypicality, the stereotypical representation of features of their social group, suggests that more prototypical features strengthen category-based judgments (Burge, Wamble, and Cuomo Reference Burge, Wamble and Cuomo2020; Lemi Reference Lemi2021; Livingston and Brewer Reference Livingston and Brewer2002; Ma, Correll, and Wittenbrink Reference Ma, Correll and Wittenbrink2018; Maddox and Gray Reference Maddox and Gray2002). If FMs learn from human-generated data, we expect similar demographic-based ideology attributions.
To test whether and how VLMs link demographic characteristics to political ideology, we conducted detailed experiments with GPT-4o-mini and validated key findings across GPT-4o and LLaVA (Liu et al. Reference Liu, Li, Qingyang and Lee2023).Footnote 2 Using identical campaign advertisements that varied only in the race and gender of the featured candidate, we found that demographic-political associations were both systematic and model-dependent. In our primary analysis with GPT-4o-mini, Black candidates and women were consistently attributed more liberal ideologies than White candidates and men—patterns that persisted across temperature settings and prompt variations, and exceeded both random allocation baselines and real-world political identification patterns from nationally representative survey data. Validation tests revealed an important distinction: while the gender effect replicated across all three models, racial associations varied, weakening in GPT-4o and disappearing in LLaVA. Racial prototypicality showed no significant effect in any model, suggesting that when racial associations occur, models may process racial categories as discrete rather than continuous features.
2 Methods
2.1 Main Study Design
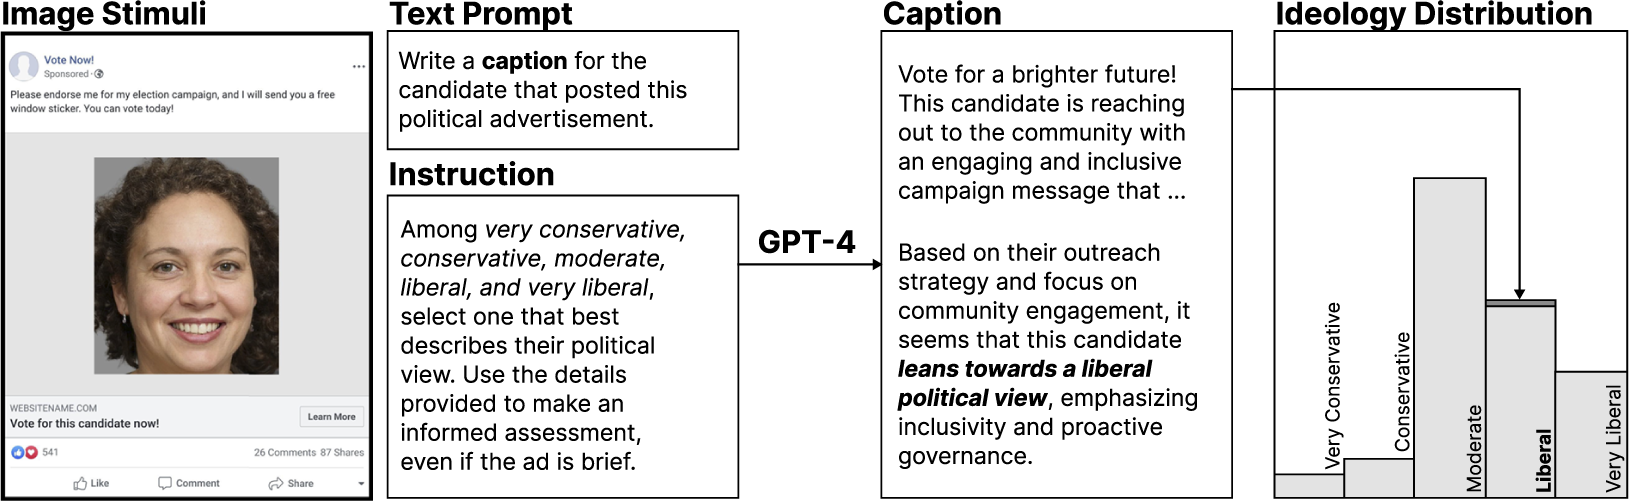
Figure 1 shows a visualization of the study design. The complete set of faces we used in this study is shown in Appendix I of the Supplementary Material. We conducted our primary analysis using GPT-4o-mini, with systematic replication in GPT-4o and LLaVA.Footnote 3 For all models, we presented identical campaign advertisements that varied only in the race and gender of the featured candidate. Each advertisement consisted of a facial image overlaid on a standardized Facebook campaign template containing neutral text (“Please endorse me for my election campaign, and I will send you a free window sticker. You can vote today!”). We prompted each model to generate captions or answer questions about the candidates’ political views, specifically asking it to categorize each candidate as very conservative, conservative, moderate, liberal, or very liberal.Footnote 4
Visualization of the study design.

Figure 1 Long description
The flowchart consists of four main sections arranged horizontally from left to right.
1. Image Stimuli: A screenshot of a Facebook political advertisement featuring a portrait of a smiling woman with curly hair. The ad text asks for an endorsement in exchange for a window sticker.
2. Text Prompt and Instruction: Two stacked boxes. The top box, Text Prompt, asks to write a caption for the candidate. The bottom box, Instruction, directs the model to select a political view from very conservative to very liberal based on the ad details.
3. G P T-4 Processing: An arrow labeled G P T-4 points from the instructions to a Caption box. This box contains a generated campaign message about a brighter future and an assessment that the candidate leans towards a liberal political view.
4. Ideology Distribution: An arrow from the Caption box points to a bar chart. The x-axis is labeled with five categories: Very Conservative, Conservative, Moderate, Liberal, and Very Liberal. The bars show a distribution where Moderate is the highest peak, followed by Liberal, then Conservative, with Very Liberal and Very Conservative having the lowest frequencies. A specific line from the caption box points directly to the Liberal bar on the chart.
To do this, we used 40 images from the GAN Face Database (GANFD; Marsden et al. Reference Marsden, Jaurique, McDonald and Burke2024) representing four intersectional groups: Black women, Black men, White women, and White men. Within each racial group, we selected images with both high and low racial prototypicality ratings to examine whether the strength of racial features influenced political attributions. The GAN Face Database was generated using the StyleGAN2 model (Karras et al. Reference Karras, Laine, Aittala, Hellsten, Lehtinen and Aila2020), which was trained on the Flickr-Faces-HQ (FFHQ) dataset (Karras, Laine, and Aila Reference Karras, Laine and Aila2019). A necessary limitation of this study is its reliance on synthetic images, which, despite allowing experimental control and overcoming important ethical and licensing challenges, may not fully capture the complex visual cues that AI models use to attribute ideology to real individuals.Footnote 5 We generated 50 completions for each image/prompt combination. This resulted in 8,000 total responses (50 iterations, 40 images, and 4 prompts).
After generating responses, we used GPT-4o to code political ideology from the generated text, achieving 100% accuracy compared to human coding in our pilot study. We assigned each response to a five-point ideological scale ranging from
$-2$
 (most conservative) to 2 (most liberal), excluding responses labeled as “refused to answer” (refusal rates varied by model; see Appendix C.3 of the Supplementary Material for details).
2.2 Baselines
To provide context to our results, we compared model outputs to five benchmarks. None represents a “true” or correct baseline. Instead, they offer different reference points to help interpret the magnitude and direction of any demographic-ideology associations in model outputs (additional details are in Appendix D of the Supplementary Material). Appendix J of the Supplementary Material briefly considers a sixth baseline of human labels.
-
1. No-Picture Baseline: The distribution of attributions assigned when no images were included to isolate the contribution of visual demographic cues.
-
2. Equal Distribution: Testing whether outputs deviate from uniform random assignment.
-
3. Normal Distribution: Testing whether outputs deviate from Gaussian random assignment centered at the moderate category.
-
4. U.S. Population Data: Overall political identification from the Weidenbaum Center Survey (WCS), a nationally representative sample collected with YouGov.
-
5. U.S. Subgroup Data: Race- and gender-specific distributions from the WCS, which included a large oversample of Black Americans.
2.3 Statistical Approach
We compared the distribution of attributed ideologies across the five categories (very conservative to very liberal) to our baselines using both descriptive statistics and
$\chi ^2$
 goodness-of-fit tests. These tests evaluated whether observed ideological distributions differed significantly from expected baseline distributions, both for the overall sample and for specific demographic subgroups. We also examined differences-in-differences, comparing how the gap between demographic groups in model outputs differed from the corresponding gaps in baseline data. (Note that expected group differences are by construction zero except in the WCS benchmark; we do not expect different ideology by race or gender for the other benchmarks.)
Second, we fit linear models with random effects for each image. These models examined how race, gender, and their interaction influenced political ideology attributions on average while accounting for random variation between individual images. Again, we compare these reported differences to the WCS baseline, noting that the expected coefficients for the other baselines are zero.
2.4 Model Comparison and Robustness
We replicated our main analysis using GPT-4o-2024-11-20 (henceforth GPT-4o) and the open-source LLaVA model to examine whether demographic-political associations generalize across architectures (accessed July 2025). For our primary model (GPT-4o-mini), we also conducted additional ablation experiments: a Debias condition with explicit instructions to avoid demographic assumptions, an Order condition randomizing ideology label sequence, and Temperature variations (0, 0.3, 0.6). Additional details are provided in Appendix H of the Supplementary Material.Footnote 6
3 Results
3.1 Main Analysis
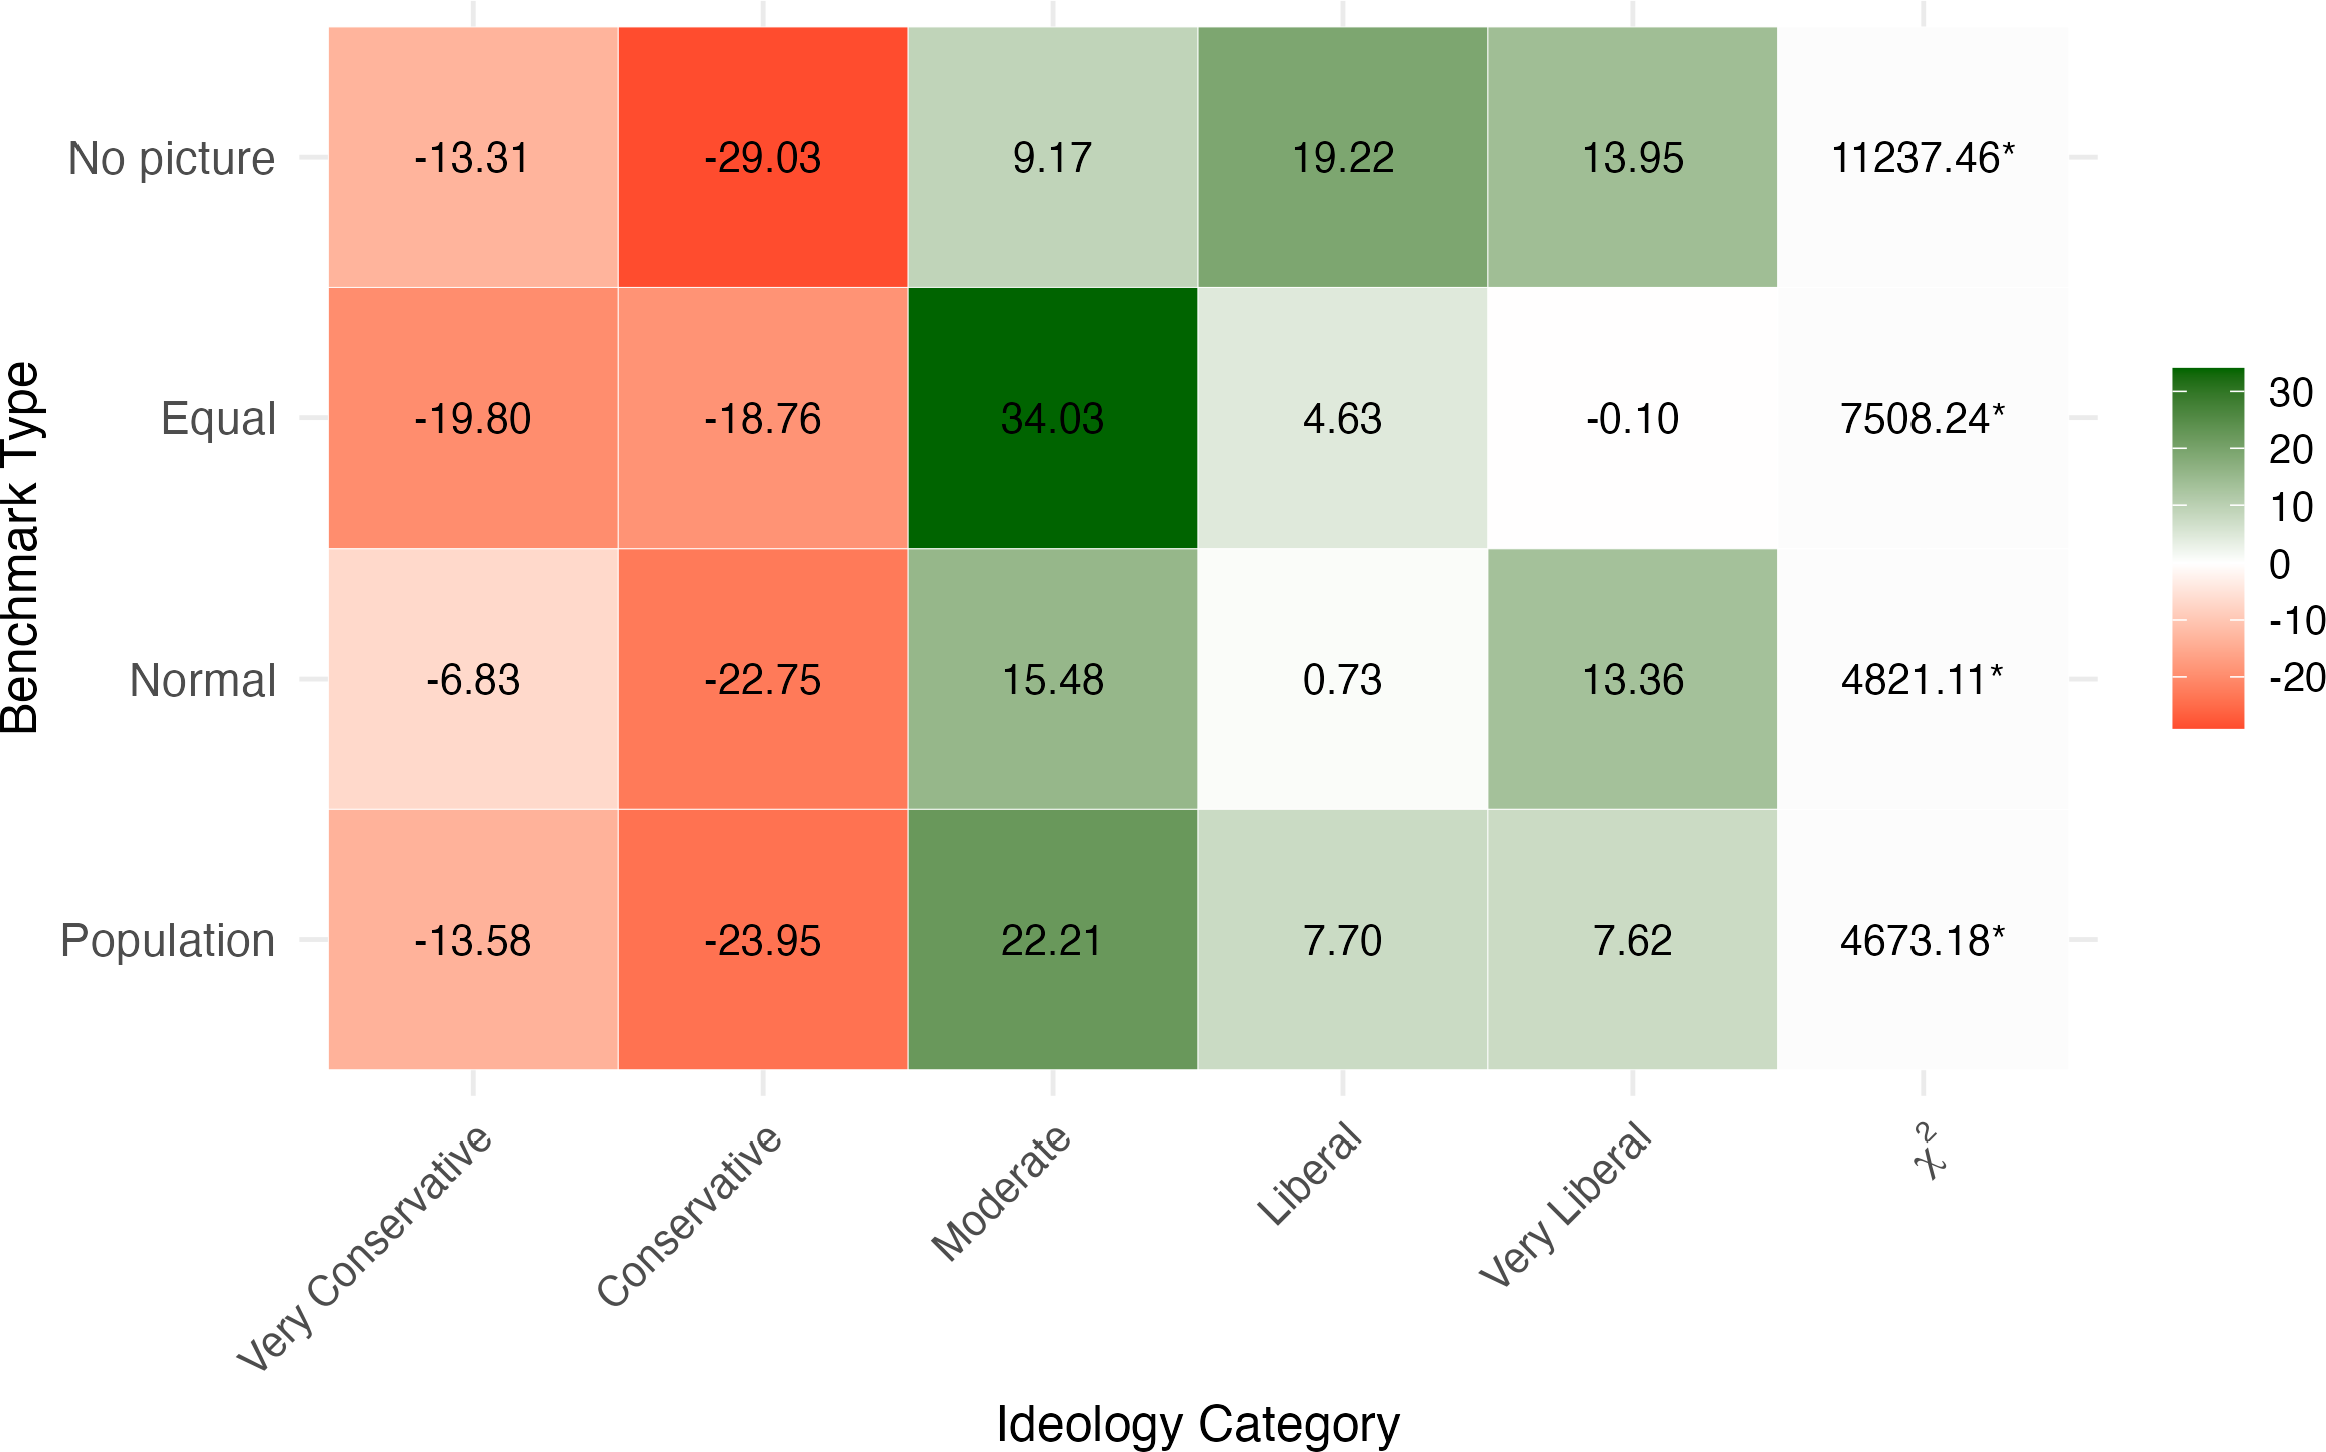
Figure 2 presents the difference between GPT-4o-mini’s ideological attributions and each benchmark distribution. Positive values (shaded green) indicate that the model assigned more candidates to that ideological category than expected under the baseline, while negative values (shaded red) indicate fewer assignments than expected.
$\chi ^2$
 statistics comparing the model outputs to the baseline distributions are shown on the right.
Percentage point differences between GPT-4o-mini ideological attributions and various benchmarks. Green indicates the model assigns more candidates to that ideological category relative to the benchmark; red indicates fewer.
$\chi ^2$
 tests compare overall distributions between model outputs and each benchmark. An asterisk denotes statistical significance at
$p < 0.05$
 .

Figure 2 Long description
The heatmap consists of four rows representing Benchmark Type: No picture, Equal, Normal, and Population. The columns represent Ideology Category: Very Conservative, Conservative, Moderate, Liberal, and Very Liberal. A final column displays chi super 2 values.
Row 1: No picture. Values are -13.31, -29.03, 9.17, 19.22, 13.95. Chi super 2 is 11237.46 asterisk.
Row 2: Equal. Values are -19.80, -18.76, 34.03, 4.63, -0.10. Chi super 2 is 7508.24 asterisk.
Row 3: Normal. Values are -6.83, -22.75, 15.48, 0.73, 13.36. Chi super 2 is 4821.11 asterisk.
Row 4: Population. Values are -13.58, -23.95, 22.21, 7.70, 7.62. Chi super 2 is 4673.18 asterisk.
Negative values are shaded in red, indicating fewer attributions than the benchmark, with the darkest red at -29.03. Positive values are shaded in green, indicating more attributions, with the darkest green at 34.03. A vertical color scale to the right ranges from -20 (red) to 0 (white) to 30 (green). All chi super 2 values are marked with an asterisk denoting P < 0.05.
The pattern is clear and consistent across all benchmarks: GPT-4o-mini systematically over-attributes moderate, liberal, and very liberal ideologies while under-attributing conservative and very conservative ideologies. This pattern appears regardless of baseline comparison and is always statistically significant. Figure E.1 in the Supplementary Material shows that while the model shifts all demographic groups leftward relative to benchmarks, it does so most dramatically for women and Black candidates, effectively eliminating conservative attributions for these groups.
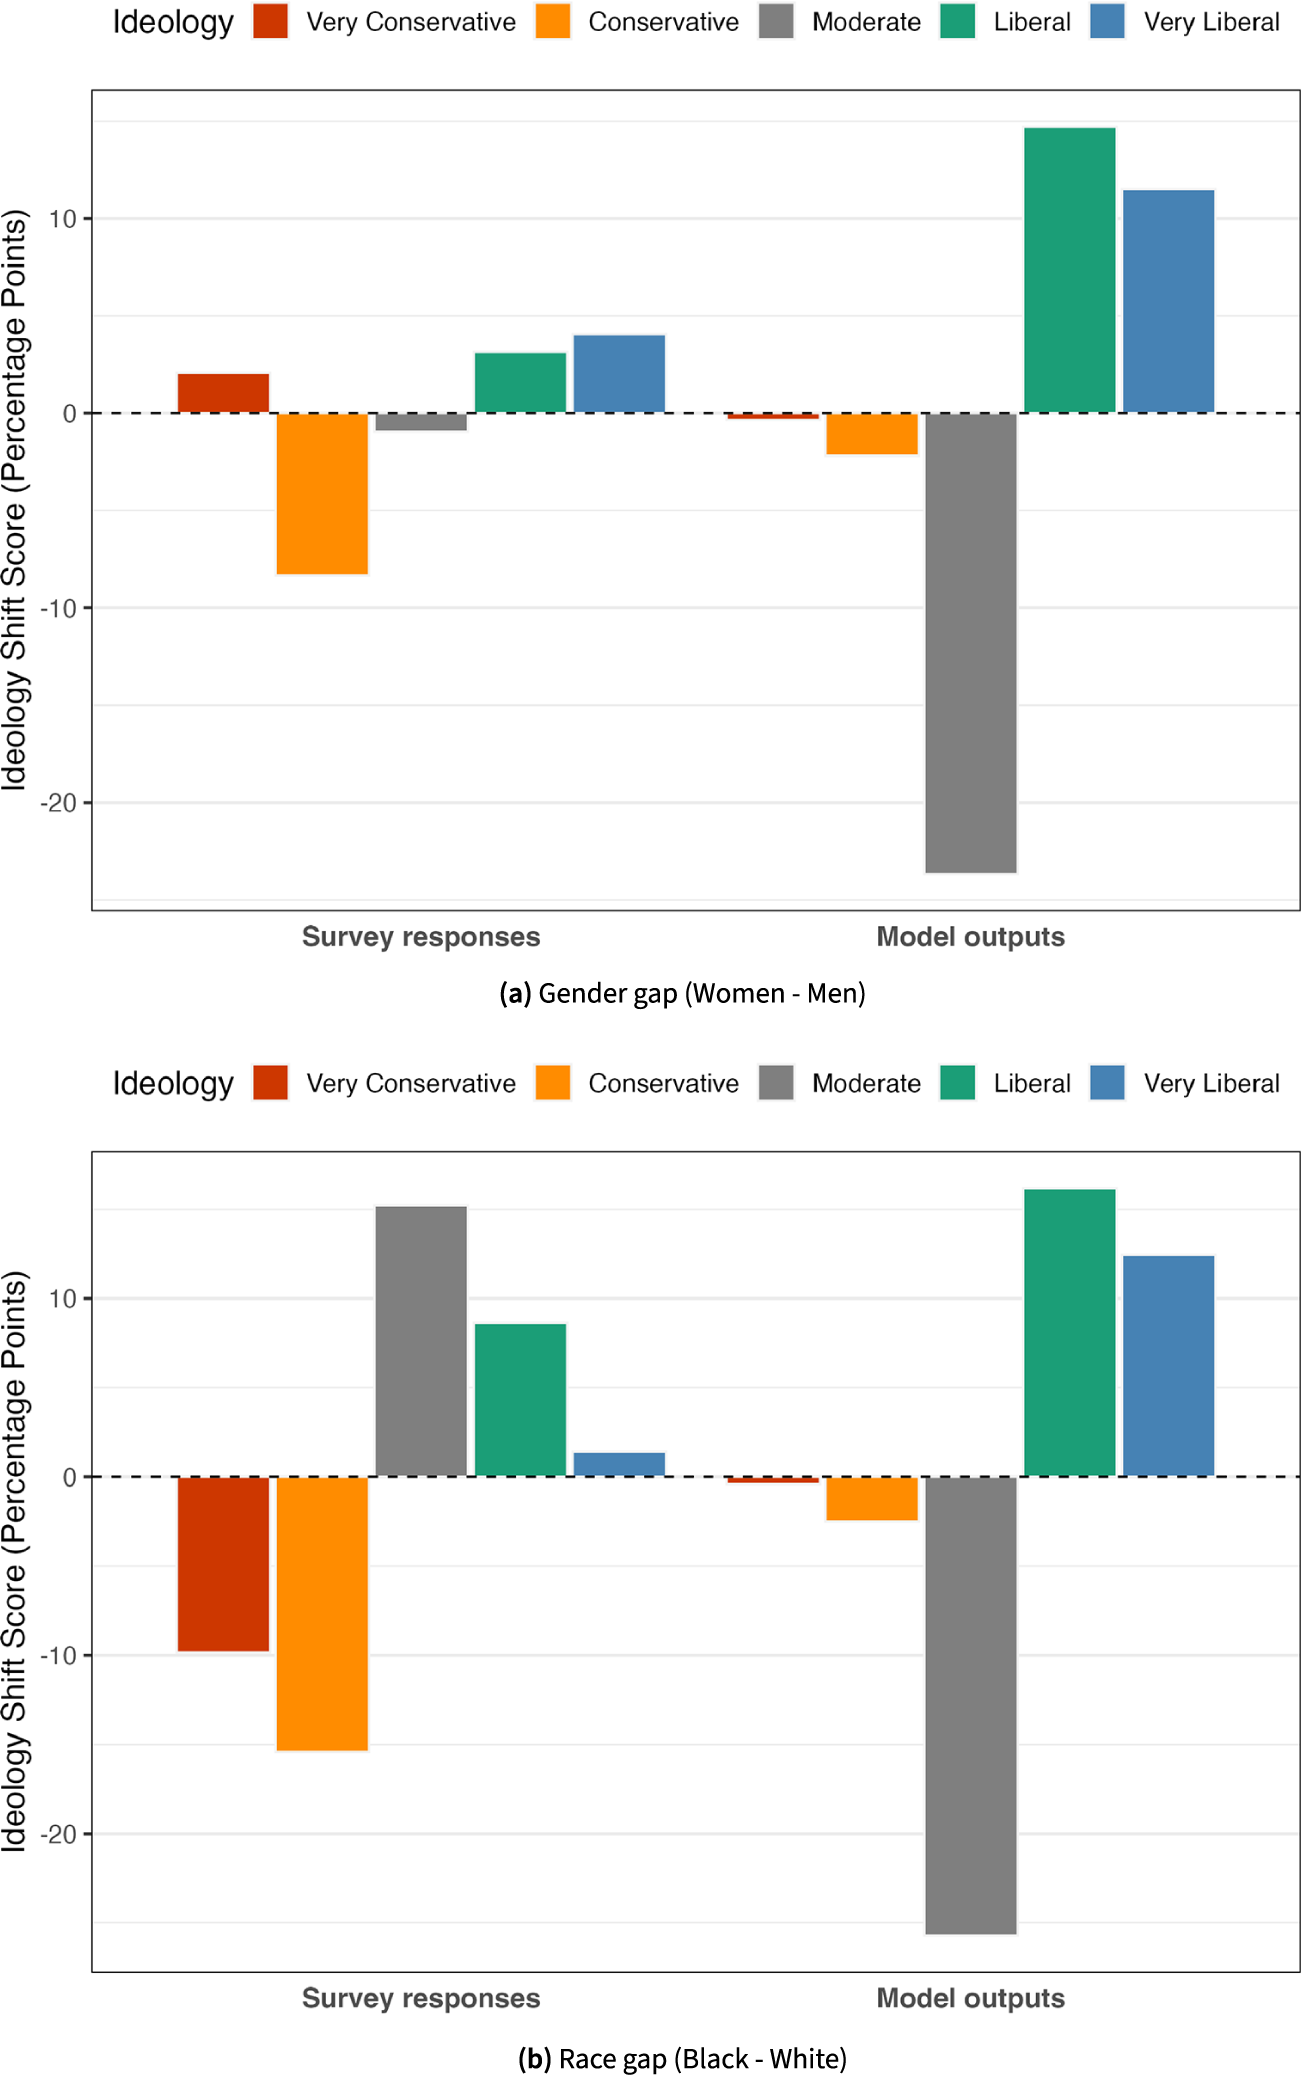
Figure 3 presents “difference-in-differences” analyses comparing demographic gaps in model attributions versus U.S. survey data. Note again that for other benchmarks, these differences are exactly zero. Panel (a) shows that while WCS data reveal modest gender differences (women are slightly more likely to identify as liberal), the model dramatically amplifies these patterns. Panel (b) reveals even more complicated racial patterns. While Black Americans do identify as more liberal than White Americans in WCS data, the model exaggerates these differences. The model fails to capture Black respondents’ lower likelihood of identifying as conservative only because it assigns conservative labels so rarely to any group. Additionally, while Black WCS respondents are more likely than Whites to identify as moderate, the model reverses this pattern substantially.
Difference-in-differences analysis comparing demographic gaps in GPT-4o-mini outputs versus WCS survey data. Positive values indicate women (panel a) or Black candidates (panel b) receive higher percentages in that ideological category than men or White candidates, respectively. The model amplifies demographic differences relative to baselines, particularly in liberal/very liberal categories, while creating new gaps (e.g., gender differences in moderate attributions) absent from survey data.

Figure 3 Long description
A two-panel bar chart. Both panels share a Y axis titled Ideology Shift Score in Percentage Points, ranging from negative 25 to positive 15, with a dashed baseline at zero. A legend at the top of each panel defines five ideology categories: Very Conservative in red, Conservative in orange, Moderate in gray, Liberal in green, and Very Liberal in blue.
Panel a, titled Gender gap Women minus Men.
* Survey responses: Shows small gaps. Very Conservative is approximately plus 2, Conservative is minus 8, Moderate is minus 1, Liberal is plus 3, and Very Liberal is plus 4.
* Model outputs: Shows extreme amplification. Very Conservative and Conservative are near zero. Moderate drops sharply to minus 24. Liberal and Very Liberal spike to plus 15 and plus 12 respectively.
Panel b, titled Race gap Black minus White.
* Survey responses: Very Conservative is minus 10, Conservative is minus 15, Moderate is plus 15, Liberal is plus 8, and Very Liberal is plus 1.
* Model outputs: Shows a shift in distribution. Very Conservative and Conservative are near zero. Moderate drops to minus 25. Liberal and Very Liberal increase to plus 17 and plus 12 respectively.
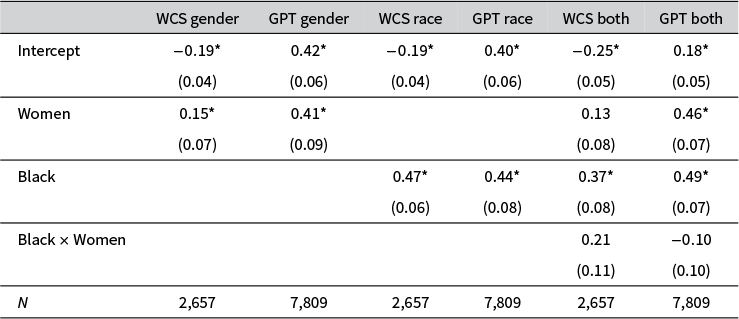
Table 1 compares demographic effects in GPT-4o-mini outputs versus WCS benchmarks using linear models. For gender, the model’s effect (
$b = 0.41$
 ,
$SE = 0.09$
 , and
$p < 0.05$
 ) is nearly three times larger than the WCS benchmark (
$b = 0.15$
 ,
$SE = 0.07$
 , and
$p < 0.05$
 ), indicating substantial relative amplification of gender-based political associations. The racial effect shows interesting convergence: while both model (
$b = 0.44$
 ,
$SE = 0.08$
 , and
$p < 0.05$
 ) and WCS (
$b = 0.47$
 ,
$SE = 0.06$
 , and
$p < 0.05$
 ) data show similar magnitudes, this masks important differences in how these effects manifest across the ideological spectrum (as shown in Figure 3). When examining intersectional effects, neither model nor WCS data show significant race-by-gender interactions, suggesting these demographic effects operate additively rather than multiplicatively. Racial prototypicality showed no significant effects in any specification (see Appendix F of the Supplementary Material).
Effect of predictors on ideology in GPT-4o-mini and WCS data.

Table 1 Long description
The table consists of seven columns. The first column lists predictors, while the remaining six are grouped into pairs for W C S and G P T models across three categories: gender, race, and both.
* Intercept row: W C S gender is minus 0.19 asterisk; G P T gender is 0.42 asterisk; W C S race is minus 0.19 asterisk; G P T race is 0.40 asterisk; W C S both is minus 0.25 asterisk; G P T both is 0.18 asterisk. Standard errors range from 0.04 to 0.06.
* Women row: W C S gender is 0.15 asterisk; G P T gender is 0.41 asterisk; W C S both is 0.13; G P T both is 0.46 asterisk. Standard errors range from 0.07 to 0.09.
* Black row: W C S race is 0.47 asterisk; G P T race is 0.44 asterisk; W C S both is 0.37 asterisk; G P T both is 0.49 asterisk. Standard errors range from 0.06 to 0.08.
* Black times Women row: W C S both is 0.21 with standard error 0.11; G P T both is minus 0.10 with standard error 0.10.
* N row (Sample Size): W C S columns all show 2,657; G P T columns all show 7,809.
Note: Asterisks denote statistical significance at p less than 0.05. Standard errors are provided in parentheses below each coefficient.
Note: Standard errors in parentheses. An asterisk denotes statistical significance at
$p < 0.05$
 . We used image random effects for GPT and robust standard errors for WCS models.
3.2 Robustness Analyses
Our replication across GPT-4o and LLaVA revealed both consistencies and important differences in how models link demographics to political ideology. All three models showed systematic liberal overattribution relative to baselines and consistent gender effects: women received more liberal attributions than men across all architectures (see Table 1 and Appendix G of the Supplementary Material). However, racial associations varied by model. While GPT-4o-mini showed strong racial effects (Black candidates received 0.44 points more liberal on our scale), these effects attenuated in GPT-4o (0.18 points) and disappeared in LLaVA, where racial differences failed to reach statistical significance. This model-dependent pattern suggests that while gender-ideology associations appear robust across vision-language architectures, racial associations are contingent on specific model implementations.
Table 2 presents ablation studies examining the robustness of demographic-ideology associations in GPT-4o-mini across various conditions. In the Debias condition, we instructed the model to disregard demographic characteristics when inferring political ideology. While this instruction reduced the association, it did not eliminate it; women and Black candidates were still significantly more likely to be labeled as liberal. Similarly, in the Order condition, we reversed the sequence of ideological options presented in the prompt. This change, aimed at testing for ordering effects, also attenuated the associations but failed to remove them. We also tested the model’s consistency across various temperature settings (0, 0.3, and 0.6), which control output randomness. The demographic associations remained remarkably stable.
Liberal attribution effects across GPT-4o-mini ablation conditions.

Table 2 Long description
The table consists of eight columns and two data rows. The columns are labeled: Effect, Main, W C S, Debias, Order, Temp 0, Temp 0.3, and Temp 0.6.
* The first data row for Women shows the following values: Main 0.41 0.09, W C S 0.15 0.07, Debias 0.30 0.07, Order 0.26 0.05, Temp 0 0.28 0.10, Temp 0.3 0.34 0.08, and Temp 0.6 0.39 0.08.
* The second data row for Black shows the following values: Main 0.44 0.08, W C S 0.47 0.06, Debias 0.35 0.06, Order 0.24 0.06, Temp 0 0.46 0.09, Temp 0.3 0.37 0.08, and Temp 0.6 0.37 0.08.
Values in parentheses represent standard errors. All results are significant at P < 0.05. Effects indicate an increase in liberal attribution for women versus men and Black versus White individuals.
Note: All results are significant at
$p < 0.05$
 . We used robust standard errors for the WCS survey data. Standard errors in parentheses. Effects show an increase in liberal attribution for women vs. men and Black vs. White. Main = original results; WCS = survey benchmark; Debias = prompt to ignore demographics; Order = reversed options; Temp = temperature settings. Full model results are shown in Appendix H of the Supplementary Material.
4 Discussion and Implications
VLMs (sometimes) link demographics to political ideologies, even when analyzing ideologically neutral content. Persistent gender associations exceeded real-world benchmarks, whereas racial effects were model-dependent: strong in GPT-4o-mini, attenuated in GPT-4o, and insignificant in LLaVA. For GPT-4o-mini, where effects were most pronounced, demographic associations persisted even with explicit debiasing instructions, suggesting these patterns can be resistant to simple prompt-based interventions (although more successful debiasing variations surely exist).
Limitations include the use of 40 images, three models, and one political concept (ideology). Although we collected 8,000 responses for each model, we may not have sufficient power to detect small interaction effects between race and prototypicality. Perhaps more concerning, the variation we observed across models—with racial associations strong in GPT-4o-mini, attenuated in GPT-4o, and absent in LLaVA—reveals how demographic-political associations can vary unpredictably across architectures. This instability means researchers cannot know ex ante whether their chosen model will exhibit such associations, particularly for proprietary models where training data and architectural choices remain opaque. Future work should expand to more images, additional models, and other political outputs. As we used only English prompts and American framing of ideology, these results would also benefit from replications across cultures.
Despite limitations, our findings have important implications. Using VLMs for political content analysis may unknowingly introduce model-specific demographic confounds. To avoid this, we recommend excluding images from inputs unless appearance is central to the research question. If images are necessary, researchers should benchmark their chosen model’s performance beforehand. The open-source LLaVA model displayed the weakest racial bias, which suggests it may work as a reasonable default. However, this finding must be interpreted cautiously given its notably high refusal rate, which suggests a potential trade-off between reduced bias and model usability. As VLM architectures evolve, ongoing validation and monitoring of demographic effects will be essential.
More broadly, as VLMs integrate into our political information infrastructure, these associations risk reshaping political communication in subtle but consequential ways. Search engines using AI-generated summaries might systematically mischaracterize candidates’ ideologies based on appearance alone, while automated journalism tools could inject these patterns into political coverage. As AI becomes more fully embedded in how we create, distribute, and consume political information, researchers and practitioners must carefully attend to how these systems encode associations between visual demographic characteristics and political attributes.
Supplementary Material
For supplementary material accompanying this paper, please visit https://doi.org/10.1017/pan.2026.10038.
Data Availability Statement
Replication code for this article has been published in the Harvard Dataverse at https://doi.org/10.7910/DVN/2JMT9J (Jeon et al. Reference Jeon, Lee, Montgomery and Lai2026).
Acknowledgements
The authors thank three anonymous reviewers and Michael Strawbridge for helpful comments. The authors used AI tools (ChatGPT, Claude, and Gemini) during writing, revision, and coding tasks. These tools were accessed in 2024 and 2025 and used with/without modification. The authors reviewed and verified all outputs. All errors are our own.
Funding Statement
The authors declare that no specific funding has been received for this article.
Competing Interests
The authors declare none.





 Open access

