INTRODUCTION
Water stress is arguably the most limiting factor affecting cereal productivity in the world (Farooq et al., Reference Farooq, Hussain and Siddique2014). The limiting factor is likely to increase in the future as climate change is expected to decrease precipitation and increase evapotranspiration. Water stress effects will be exacerbated by the projected increase in temperatures. Rising temperatures and high evapotranspiration rates will increase reliance on irrigation to meet food demand, thus putting more pressure on water resources. It is therefore imperative to have a wide-ranging understanding of water stress effects on crop physiological processes so as to better manage, improve and adapt crops for future climates.
Triticale (x. Triticosecale Wittmack), a hybrid of wheat (Triticum spp.) and rye (Secale spp.), is a robust and utility crop with great potential for food and feed production in future environments. It inherited the high yielding potential of wheat together with the resistance to pathogens and adaptability to marginal growing conditions such as drought, extreme temperature, salinity, extreme pH etc. of rye (Mergoum and Macpherson, Reference Mergoum and Macpherson2004). In addition, triticale is also suitable for low-input farming systems due to its tolerance to pests and diseases and its extensive root system that can efficiently absorb nutrients under poor soil fertility (Mergoum and Macpherson, Reference Mergoum and Macpherson2004). Triticale is a relatively new crop but its production has more than tripled in the past two decades from 4.5 million tonnes in 1990 to 14.5 million tonnes in 2013 (FAO, 2015). The production is concentrated in Europe with Poland being the highest producer having produced more than 3 million tonnes in 2013 (FAO, 2015). Triticale is however less known in Africa, and is only produced by a few countries mostly Tunisia and South Africa.
Triticale is used mainly as livestock feed but has potential in bread making and bioethanol production (McGoverin et al., Reference McGoverin, Snyders, Muller, Botes, Fox and Manley2011). The importance of triticale continues to grow due to the versatility of its utilization as it can be used in all its forms as grain, forage, whole plant silage, hay and straw (McGoverin et al., Reference McGoverin, Snyders, Muller, Botes, Fox and Manley2011; Motzo et al., Reference Motzo, Pruneddu and Giunta2013). In South Africa, spring triticale produces grain yields of up to 40% higher than wheat in low potential soils (Botes and Saul, Reference Botes and Saul2009). Cultivar improvements in the country are targeted at its value-added end use as livestock feed and improving its productivity in the winter rain fed (Mediterranean type) of the Western Cape Province (McGoverin et al., Reference McGoverin, Snyders, Muller, Botes, Fox and Manley2011). However, the stress tolerance and utility of triticale as livestock feed would be more suitable to the dry winter areas (Steppe, arid) of Limpopo and Eastern Cape provinces, which have low crop potential but are more suitable for livestock production. These areas experience poor livestock condition due to low quantity and quality of available forages during the winter dry season.
Based on vernalisation requirements, varieties of triticale can be classified into spring, winter and facultative types. This variation in vernalisation requirement is largely determined by Vrn genes. Spring types have limited vernalisation requirements to go from vegetative to reproductive stages while winter types require a period of several weeks with temperatures between -1 °C and 8 °C. Vernalisation speeds up development in case of facultative types. The major challenge of producing triticale in semi-arid (dry winter and hot, wet summer) environments is the availability of water (no winter rainfall) and heat stress that may occur during the reproductive stages of triticale. The combined effect of heat and water stress on yield is stronger than the effects of each stress type alone (Lipiec et al., Reference Lipiec, Doussan, Nosalewicz and Kondracka2013). Yield losses under water stress are essentially due to reduction in CO2 assimilation, hindrance to the export of assimilated carbon (Sevanto, Reference Sevanto2014), suppressed leaf growth (Blum, Reference Blum2011) and accelerated leaf senescence (Farooq et al., Reference Farooq, Hussain and Siddique2014).
In recent years, remote sensing has become important in monitoring crop water status, nutrient deficiencies and predicting crop characteristics like grain yield and aboveground biomass (Gao, Reference Gao1996). The NDVI is currently the most common spectral reflectance index used in such applications. For example, some farmers use NDVI through simple instruments like the Green Seeker Handheld Crop Sensor (Trimble, USA) to monitor crop vigour. However, according to Chen et al. (Reference Chen, Huang and Jackson2005), the index has limited success when used to estimate crop water status. NDVI is a greenness-based index which is more responsive to changes in chlorophyll. The use of water-based indices like NDWI (Gao, Reference Gao1996) and WI (Peñuelas et al., Reference Peñuelas, Pinol, Ogaya and Filella1997), which respond to changes in vegetation water content, could provide more information. Water stress can also be monitored by physically measuring soil and leaf water content but these methods are usually destructive, tedious and difficult at large scale. Hence, precise spectral reflectance characterisation at leaf level would allow for improved determination and management of water stress in field crops.
Though triticale is known for its competitiveness in stress environments, its performance, just like of any other crop, is influenced by environmental factors. Therefore, research efforts are still needed to improve current genotypes. A better understanding of yield performance, carbon fixation and spectral response of triticale to water stress is critical for improving its adaptation to water limited environments, management practices and adoption by farmers. It is against this background that this study was carried out to investigate the effect of water stress on the following: (1) flag leaf CO2 assimilation and flag leaf carbon content; (2) the utility of flag leaf spectral reflectance, not only as a tool to sense leaf water status but also as an indicator of biomass and grain yield in triticale; and (3) biomass and grain yield performance of four spring triticale genotypes in a dry winter environment (steppe, arid climate) characterised by high post anthesis temperatures.
MATERIALS AND METHODS
Study site and experimental design
The study was carried out at the University of Limpopo experimental farm, Syferkuil (23o50′ S; 029o41′ E), Limpopo Province, South Africa during two winter seasons; June to October in 2013 and July to November in 2014. The area receives rainfall, ranging from 400 to 600 mm per annum, 85% falling in summer, between November and March. Average minimum and maximum temperatures are respectively; 4 to 20 °C in winter and 17 to 27 °C in summer (calculated six year average; 2008 to 2013). According to the Köppen–Geiger climate classification, the climate falls under BSh (arid, steppe, hot).
The experimental design was a randomised complete block design with four replications in factorial arrangement of moisture levels and genotypes. The four moisture levels were as described below and the amounts are shown in Table 1.
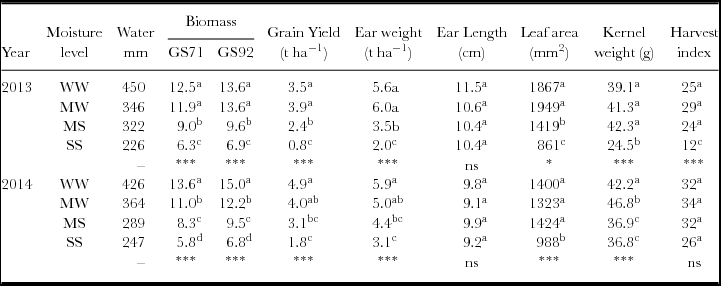
Aboveground biomass at GS71; and GS92, grain yield, ear weight, ear length, leaf area, 1000 kernel weight, harvest index and the amount of water applied under four irrigation levels.

Letters (a, b, c) represent significant differences. Significance levels: *p < 0.05, ***p < 0.001. ns = not significant; WW = well-watered; MW = moderately well-watered; MS = moderate stress; SS = severe stress.
-
• Well watered (WW): 25% soil moisture depletion before recharging to field capacity (FC).
-
• Moderately well watered (MW): 50% soil moisture depletion before recharging to FC.
-
• Moderate stress (MS): 75% soil moisture depletion before recharging to 50% of FC.
-
• Severe stress (SS): moisture was allowed to dry out from detectable first node, with 40 mm supplementary irrigation being applied later in the season.
In most parts of this report, the simple notation of WW, MW, MS and SS will be used to describe the moisture levels. The moisture levels were applied after crop establishment corresponding to Zadoks Growth Stage 31 (GS31) (Zadoks et al., Reference Zadoks, Chang and Konzak1974). Under SS, 40 mm of supplementary irrigation was applied later in the season to avoid permanent wilting of the crop. Soil moisture was measured regularly using Diviner 2000 (Campbell Scientific, Australia) from access tubes installed at the centre of each plot. Irrigation was applied when half of the plots under the same irrigation level reached the threshold value. The study was carried out in the dry winter season June to November where moisture levels were easily controlled without rainfall interference.
A preliminary study was carried out in 2012 with eight spring-type genotypes and three moisture levels (MW, MS and SS). Four commercial genotypes from Plant Breeding Unit at Stellenbosch University, South Africa: Agbeacon, Bacchus, Rex and US2007 were selected based on aboveground biomass yield. Rex and Bacchus were selected from CIMMYT breeding pool while Agbeacon and US2007 are from the breeding pool of Stellenbosch. Triticale was planted in rows, 25 cm apart using a tractor drawn planter at a density of 200 plants m−2. The plot sizes were 10 m × 10 m and irrigation was by Rain bird sprinklers (Rain Bird, USA), fitted with Arad M20 water metres (Arad, Israel) to record amount of water applied. In addition, rain gauges were installed at the centre of each plot.
The soil was classified as Chromic Luvisol (Hypereutric). The soil depth ranges from 60 to 70 cm, with sandy clay loams overlaying sandy clays and available water capacity (AWC) of 80 mm. The AWC was estimated using the hydraulics properties calculator (Saxton and Rawls, Reference Saxton and Rawls2006). Fertilization was adapted to local practice: Nitrogen (N) was applied at a rate of 50 kg N ha−1, phosphorus (21 kg P ha−1) and potassium (12 kg K ha−1) in both seasons.
Agronomic measurements
Aboveground biomass was measured at milking stage (GS71) and harvest maturity (GS92). Sampling was done from two, 1.7 m long middle rows, covering an area of 0.85 m2 (170 plants). Plants were cut at 10 cm aboveground and dried to constant weight at 65 °C. Leaf area was measured using AM300 Leaf area meter (ADC BioScientific, UK). Harvest index (HI) was calculated as percentage of grain yield of total aboveground biomass at GS92. Growing degree days (GDD) were calculated as (Tmax + Tmin)/2 – Tb, where Tb is base temperature, taken as 0 °C.
Carbon assimilation
CO2 assimilation was measured using LCi-SD Ultra Compact Photosynthesis System (ADC BioScientific, UK), on clear sunny days between 11h00 to 13h00. Measurements were taken on the mid part on the abaxial side of flag leaves.
Drought tolerance indices
Three indices were calculated to give a measure of the drought resistance of the genotypes. The indices were as follows: Yield Reduction (YR), Stress Tolerance Index (STI), Stress Susceptibility Index (SSI) and Yield Stability Index (YSI). YR = 100(Yp − Ys)/Yp; STI = (Yp × Ys)/Ӯp2 (Fernandez, Reference Fernandez and Kuo1993); SSI = 1 − (Ys/Yp)/1 − (Ӯs/Ӯp)(Fischer and Maurer, Reference Fischer and Maurer1978); and YSI = Ys/Yp, where Yp is yield of genotype under WW; Ys = yield of genotype under SS conditions; Ӯs is the mean yield of all four genotypes under SS; and Ӯp is the mean yield of all four genotypes under WW. YR was also calculated to give a measure of grain yield decrease due to 25% (WW – MW, YR25), 50% (WW – MS, YR50) and 75% (WW – SS, YR75) decrease in soil moisture from optimal.
Hyperspectral reflectance data
The hyperspectral reflectance of flag leaves was measured using a portable Analytical Spectral Device (ASD) Spectroradiometer (ASD, USA) that detects reflectance in the 350 to 2500 nm spectral region. The spectral reflectance data was measured twice, at GS31 and GS71. Four vegetation indices were calculated: NDVI (Rouse et al., Reference Rouse, Haas, Schell, Deering and Harlan1974); NDWI (Gao, Reference Gao1996); WI (Peñuelas et al., Reference Peñuelas, Pinol, Ogaya and Filella1997); and Nitrogen Reflectance Index (NRI) (Schleicher et al., Reference Schleicher, Bausch, Delgado and Ayers2001).
STATISTICAL ANALYSES
Analysis of variance was performed to calculate the effects of soil moisture reduction and genotype on the studied parameters. Mean comparisons were done using least significance difference (LSD) and where denoted by *, ** or *** for significance levels p ≤ 0.05, p ≤ 0.01 and p ≤ 0.001, respectively. All data were analysed using the SPSS 17.0 statistical package (SPSS, USA).
RESULTS
Weather condition and irrigation levels during growing seasons
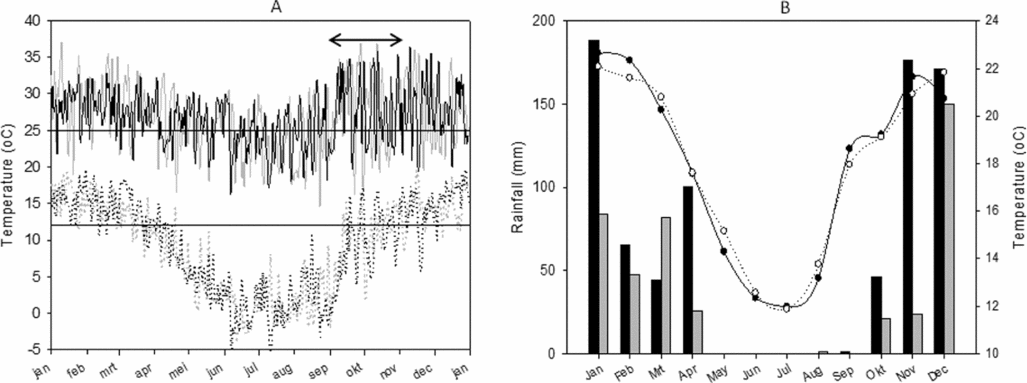
Figure 1A shows the daily maximum and minimum temperatures recorded on station at Syferkuil in 2013 and 2014 growing seasons. Daily maximum temperatures during the reproductive months (September to November) of triticale reached as high as 35 °C in both years (Figure 1A, double arrow). The same Figure 1A also shows an upper control temperature of 25 °C and lower control temperature of 12 °C representing optimum temperatures for spring crops. The mean maximum and minimum temperatures on Figure 1B show that mean temperatures were slightly higher in 2013 compared to 2014 during the reproductive stages of the crop. Mean monthly temperatures were within the optimum range of 12 to 25 °C. Monthly total rainfalls for the two years are shown in Figure 1B. The total amount of rainfall received during the whole of 2013 growing season (June to October) was only 10.9 mm while 35 mm were received in 2014 (July to November).
(A) Daily maximum and minimum temperatures in the two seasons (2013 maximum = solid grey; 2013 minimum = dashed grey; 2014 maximum = black solid; and 2014 minimum = dashed black). The double arrow shows the reproductive growth period. (B) Mean monthly temperatures for Syferkuil in 2013 (black shaded circles and line) and 2014 (open circles and dashed line). Figure 1B also shows monthly total rainfall for 2013 (black bars) and 2014 (gray bars).

Aboveground biomass, grain yield and yield components
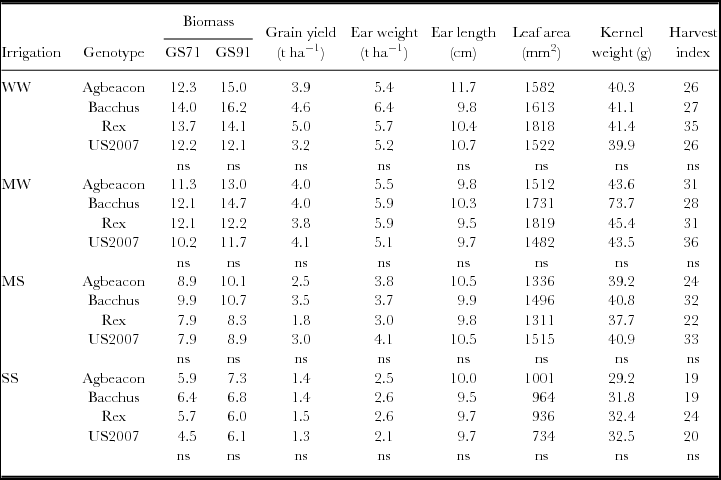
Soil moisture had a strong influence on biomass accumulation, grain yield, leaf area, 1000 kernel weight and HI but had no influence on ear length in both seasons (Table 1). Neither genotypic differences nor interaction effects were observed (p > 0.05) in the measured parameters though Bacchus showed a tendency of performing better than the other genotypes (Table 2). SS reduced grain yield by more than 75% in both seasons with grain yield ranging from 0.8 to 3.9 t ha−1 in 2013 and 1.8 to 4.9 t ha−1 in 2014. In 2013, biomass was not significantly different between WW and MW conditions but was significantly different between MS and SS conditions (Table 1). Also, WW and MW were significantly different to both MS and SS. In 2014, biomass was different for all moisture levels. Grain yield and ear weight were not significant between WW and MW in both seasons but were significantly different to grain yield observed under MS and SS conditions. In 2013, differences in grain yield and ear weight were observed between MS and SS conditions but these differences were not observed in 2014. Leaf area did not differ under higher moisture levels (WW and MW) but was significantly lower under MS and SS in 2013. In 2014, WW, MW and MS had similar leaf areas which differed from SS. In the first season (2013), kernel weight and HI were similar under WW, MW and MS conditions. Only under SS were kernel weight and HI significantly lower. In the second season (2014), HI did not show any differences across all the four moisture levels.
The total amount of water received (including rainfall) by the crop for the different moisture levels in the two seasons are shown in Table 1. The amount of water received under SS was almost half of that received under WW in both seasons.
Growing season effect
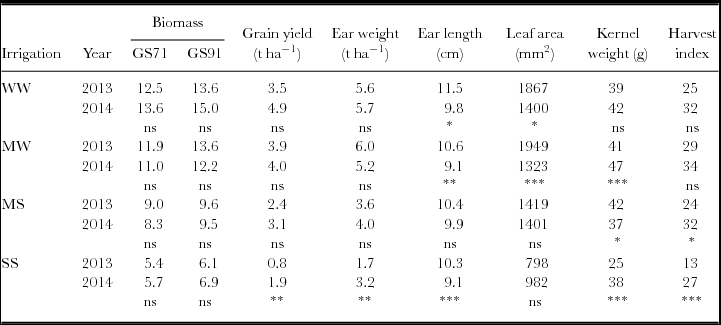
No growing season effect was observed on the amount of biomass accumulated at GS71 and GS91 for all four moisture levels (Table 3). The effect of growing season on grain yield and kernel weight was observed only under SS where both grain yield and ear weight were higher in 2014 compared to 2013. The ears were longer in 2013 compared to 2014 under WW, MW and SS conditions but were not different under MS conditions. Leaf area under WW and MW conditions was higher in 2013 compared to 2014 but no season effect was observed under MW and SS conditions. No growing season effect was observed for kernel weight under WW conditions but it was significant for the other three moisture levels. HI tended to be higher in 2014 compared to 2013 but was only significant under MS and SS conditions. When grown under WW conditions, triticale required 1962 and 2027 GDD to reach physiological maturity in 2013 and 2014, respectively. Fewer GDD were required for the other three moisture levels as the crop matured earlier. For instance, under SS, the crop reached physiological maturity after 1767 and 1812 GDD in 2013 and 2014, respectively.
Aboveground biomass (at GS71 and GS92), grain yield, ear weight, ear length, leaf area, 1000 kernel weight, and harvest index of the four genotypes under four moisture levels averaged for the two seasons.

ns = not significant; WW = well watered; MW = moderately well watered; MS = moderate stress; SS = severe stress.
Growing season effect on biomass, grain yield, ear weight, ear length, leaf area, 1000 kernel weight, and harvest index.

Significance levels: *p < 0.05, **p < 0.01, ***p < 0.001. ns = not significant.
CO2 assimilation and flag leaf carbon content
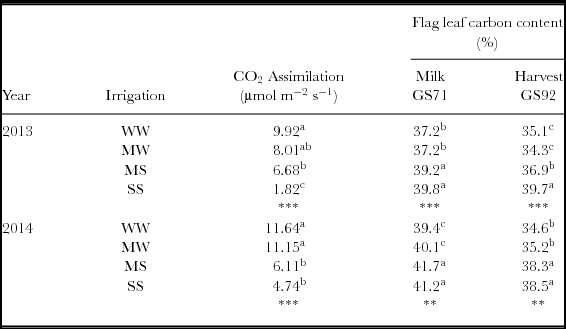
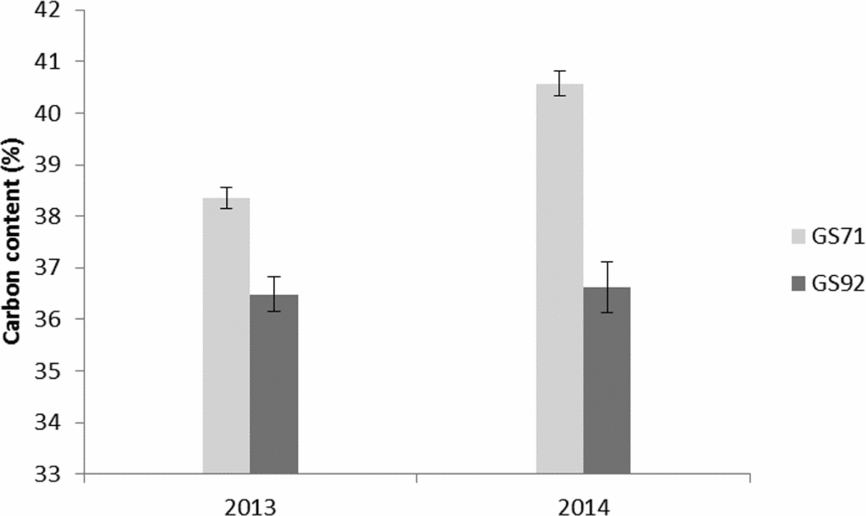
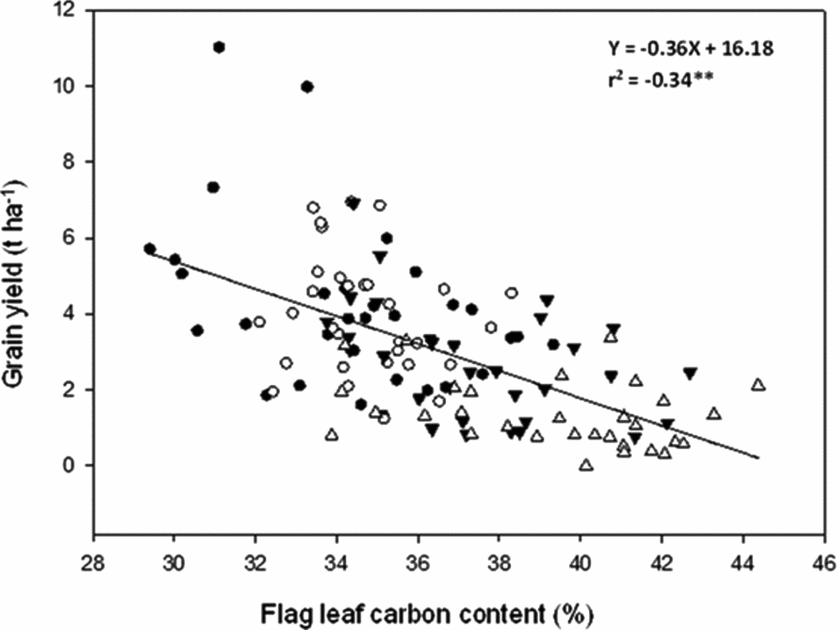
Flag leaf CO2 assimilation rate and flag leaf carbon content were significantly influenced by soil moisture content (Table 4). CO2 assimilation rate decreased with decreasing soil moisture level. In contrast, flag leaf carbon content increased with decreasing soil moisture level. CO2 assimilation rates were not different under WW and MW conditions but were higher than the rates observed under MS and SS conditions. In 2013, CO2 assimilation rates were different between MS and SS but were not different in 2014. Flag leaf carbon content did not differ between WW and MW conditions and also between MS and SS except for GS92 in 2013 where carbon content under SS was significantly higher than under MS conditions. Mean flag leaf carbon content at GS71 was significantly higher than the mean flag leaf carbon content at GS92 in both seasons (Figure 2). Mean lag leaf carbon content was highest at GS71 in 2014 and no seasonal differences were observed in flag leaf carbon content at GS92. Also, a significant negative relationship (−0.34**) was observed between flag leaf carbon content and grain yield (Figure 3). The relationship on Figure 3 is for combined data of the two seasons measured at GS92.
Flag leaf CO2 assimilation rate and carbon content at GS71 and GS92.

Letters (a, b, c) represent significant differences. Significance levels: **p < 0.01; ***p < 0.001. WW = well watered; MW = moderately well watered; MS = moderate stress; SS = severe stress.
Average flag leaf carbon percentage at GS71 and GS92 for 2013 and 2014 growing seasons.

Regression between grain yield and flag leaf carbon content at GS92. WW (solid circles); MW (open circles); MS (solid triangles); and SS (open triangles).

Yield reduction and drought tolerance indices
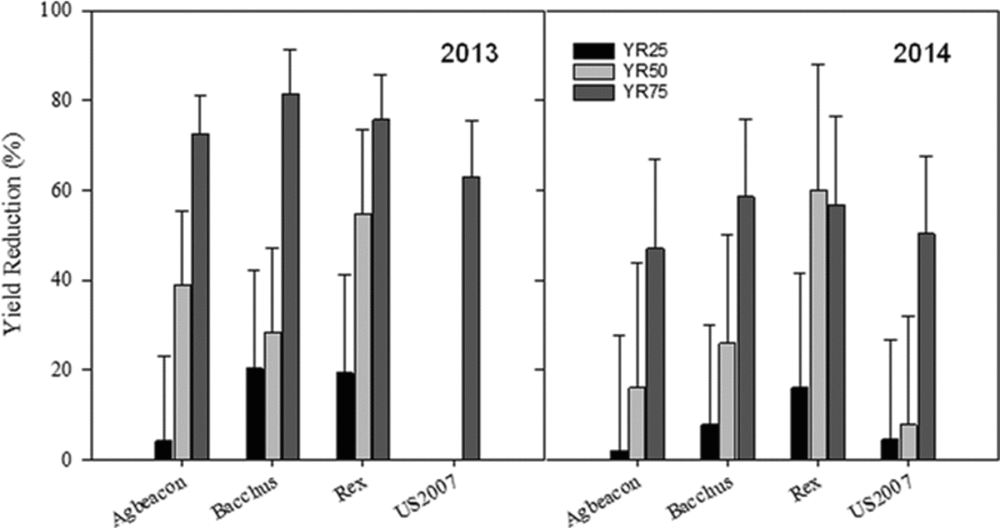
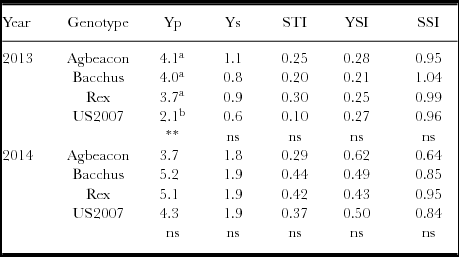
Figure 4 shows grain YR percentages resulting from 25% (WW vs. MW, YR25), 50% (WW vs. MS, YR50) and 75% (WW vs. SS, YR75) decrease in soil moisture. The percentage grain yield loss corresponded with the percentage decrease in soil moisture. For instance, 25% decrease in soil moisture resulted in less than 20% decrease in grain yield for all genotypes in the two growing seasons. A 75% moisture decrease resulted in almost similar decrease in grain yield in 2013. In 2014, 75% decrease in soil moisture resulted in about 60% decrease in grain yield. In 2013, US2007 had very low grain yield under WW conditions (2.1 t ha−1, Table 5) which resulted in negative reduction percentages which were not computed. Though not significant, Agbeacon had the lowest YR percentage at 25% moisture decrease. Bacchus and Rex were the two genotypes most affected by SS compared to Agbeacon and US2007.
Yield reduction of four triticale genotypes when moisture level is reduced by 25% (WW vs. MW, YR25), 50% (WW vs. MS, YR50) and 75% (WW vs. SS, YR75) for the two seasons (2013 and 2014). The missing data on US2007 is due to the extremely low grain yields observed under WW conditions that resulted in negative yield losses.

Stress Tolerance Index (STI), Yield Stability Index (YSI), and Stress Susceptibility Index of four triticale genotypes calculated using potential yield (Yp) and water stressed yield (Ys).

Yp = grain yield under optimal and Ys = grain yield under severe stress. Letters (a, b, c) represent significant difference. **p < 0.01; ns = not significant.
The performance of the four triticale genotypes for potential yield (Yp) and yield under SS conditions (Ys) is shown in Table 5. Table 5 also shows the STI, YSI and SSI of the genotypes in the two seasons. Genotypes did not differ significantly in the indices measured over the two seasons except in 2013, where US2007 had significantly lower potential yield relative to the other genotypes. As expected, potential grain yield was higher compared to grain yield under water stress. Even though genotypes did not differ in YSI and SSI, Agbeacon had the highest YSI and the lowest SSI in the two seasons corresponding to a lower YR observed in Figure 4. STI was not consistent in the two seasons with Rex having the highest STI in 2013 and Bacchus in 2014.
Spectral reflectance indices
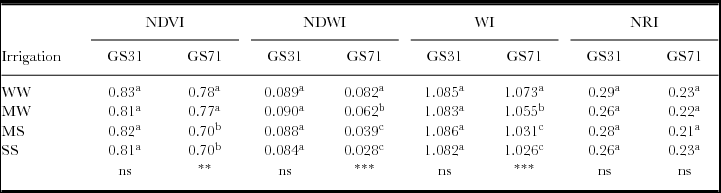
Four regions on the reflectance curve showed differences in the reflectance of the flag leaves as affected by the moisture levels. The regions were as follows: 533 to 660 nm; 758 to 1270 nm; 1430 to 1850 nm and 1913 to 2500 nm. At GS31, the stage at which the moisture levels were introduced, soil moisture effect was not significant for all four indices. The indices however had higher values at this stage compared to those measured later at GS71. NDVI, NDWI and WI were strongly influenced by moisture level at GS71 (Table 6) with higher values being observed under high moisture levels compared to low moisture levels. All indices did not show significant differences between MS and SS conditions. Differences in NDWI and WI were mainly found among optimal, suboptimal and the two lowest moisture levels (MS and SS) while for NDVI differences were only found between the two groups: well-watered conditions (WW and MW) and water stressed conditions (MS and SS). Thus, NDVI could not separate between WW and MW conditions. NRI was not affected by moisture level at GS31 and GS71.
Normalised Difference Vegetation Index (NDVI), Normalised Difference Water Index (NDWI), Water Index (WI) and Nitrogen Reflectance Index (NRI) calculated from reflectance measured at GS31 and GS71 in 2014.

Letters (a, b, c) represent significant differences. Significance levels: *p < 0.05; **p < 0.01; ***p < 0.001. ns = not significant; WW = well watered; MW = moderately well watered; MS = moderate stress; SS = severe stress.
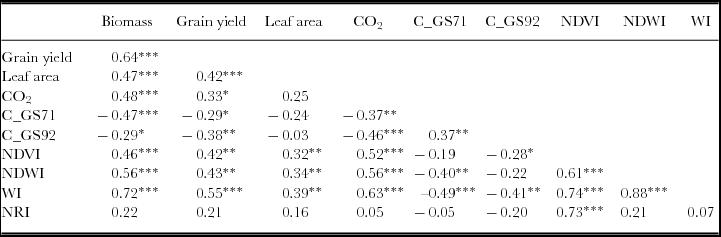
CO2 assimilation rate was significantly correlated to NDVI, NDWI and WI (Table 7) but the correlation was stronger with WI (0.63***). Flag leaves with higher water content at GS71 also had higher CO2 assimilation rates. The three indices (NDVI, NDWI and WI) were also significantly correlated with biomass and grain yield and again WI had stronger correlations with biomass (0.72***) and grain yield (0.46***) than any other index. Flag leaf carbon content (both at GS71 and GS92) were inversely related to the other parameters.
Bivariate correlations of biomass (GS71), grain yield, leaf area, CO2 (CO2 assimilation), C_GS71 (flag leaf carbon content at GS71), C_GS92 (flag leaf carbon content at GS92), NDVI, NDWI, WI and NRI.

Significance levels: *p < 0.05; **p < 0.01; ***p < 0.001. NDVI = normalized difference vegetation index; NDWI = normalized difference water index; WI = water index; NRI = nitrogen reflectance index.
DISCUSSION
Aboveground biomass, grain yield and yield components of triticale
The average grain yield (3.9 t ha−1 in 2013 and 4.9 t ha−1 in 2014) obtained under well-watered conditions, are relatively low compared to those obtained in other studies (Dogan et al., Reference Dogan, Kacar, Coplu and Azkan2009; Estrada-Campuzano et al., Reference Estrada-Campuzano, Slafer and Miralles2012). Dogan et al. (Reference Dogan, Kacar, Coplu and Azkan2009) reported yields above 6 t ha−1 in Turkey. A plausible reason for the relatively low yields under well-watered conditions (WW and MW) is the low plant density and N fertilizer applied. Grain cereals respond positively to N fertilization and in this study only 50 kg N ha−1 was applied compared to the recommended rates of 80 to 100 kg N ha−1 or even higher rates as reported in some studies (Motzo et al., Reference Motzo, Pruneddu and Giunta2013). A low plant density of 200 plants m−2 was used compared to higher plant densities of more than 300 plants m−2 used in other studies (Estrada-Campuzano et al., Reference Estrada-Campuzano, Slafer and Miralles2012; Motzo et al., Reference Motzo, Pruneddu and Giunta2013). Lower N rates were used because triticale is known to perform well even under low soil fertility (Mergoum and Macpherson, Reference Mergoum and Macpherson2004) and also because poor farmers in Limpopo do not have financial resources to apply high fertilizer doses. Low densities were used to improve water use by the crop as it is recommended to use lower plant densities under water-limiting conditions.
While the yield may look small compared to the above-mentioned yields, they are level with the world average of 3.8 t ha−1 in 2013 and higher than the 2.3 t ha−1 reported in Tunisia (FAO, 2015). Tunisia is one African country that consistently produces triticale. The grain yield observed under SS conditions (0.8 t ha−1 in 2013 and 1.8 t ha−1 in 2014) were low when compared to 3.6 t ha−1 reported by Schittenhelm et al. (Reference Schittenhelm, Kraft and Wittich2014) under similar moisture conditions, albeit under fully humid, warm temperate climate. In this study, under steppe (arid) climate, an extra 40 mm of water were required to avoid total desiccation of the crop under SS. This shows that it is virtually impossible to grow a spring crop to maturity on residual moisture in a steppe (arid) environment due to the amount of water that is lost through evapotranspiration. The relatively lower biomass and grain yield can also be attributed to shortened grain filling stage resulting from terminal heat stress experienced during the reproductive and grain filling stages (Figure 1A)(Day and Atkin, Reference Day and Atkin1984; Dias and Lidon, Reference Dias and Lidon2009). High temperatures negatively affect CO2 assimilation (Farooq et al., Reference Farooq, Bramley, Palta and Siddique2011) even under WW conditions. Low yields observed under water-limited conditions (MS and SS) may have been due to accelerated leaf senescence and/or kernel abortion caused by either water stress, heat stress or a combination of the two. In this study, grain filling occurred in between October and November where daily maximum temperatures exceeded 30°C reaching highs of 35 °C (Figure 1A), well above 25°C considered to be the optimum (Farooq et al., Reference Farooq, Bramley, Palta and Siddique2011). Supra-optimal temperatures occurring post anthesis are known to reduce kernel cytokinin levels, a hormone that promotes endosperm cell proliferation (Banowetz et al., Reference Banowetz, Ammar and Chen1999) resulting in lower kernel weight. Also, plants under water stress produce abscisic acid (ABA), which in turn inhibits endosperm cell division (Cheikh and Jones, Reference Cheikh and Jones1994). However, it suffices to say that the grain yield levels observed in this study show a good thermo tolerance of the triticale cultivars.
The HI and kernel weight are important parameters that determine yield in grain crops. Higher yields are realized in crops that convert a significant amount of accumulated assimilates into grain. The HI observed under SS was extremely low in 2013 (12%) but in 2014 (26%) it was relatively high and agreed with those reported by Estrada-Campuzano et al. (Reference Estrada-Campuzano, Slafer and Miralles2012). The kernel weights observed in both seasons fell within the expected range for triticale of 35 to 55 g (Manley et al., Reference Manley, Snyders, McGoverin, Fox, Muller, Kidd and Botes2011) except under SS in 2013. A common response of plants to water stress is reducing leaf area to restrict water loss (Chaves et al., Reference Chaves, Pereira, Maroco, Rodrigues, Ricardo, Osorio, Carvalho, Faria and Pinheiro2002). Smaller flag leaves were observed under SS indicating that low soil moisture levels affected leaf growth, reducing photosynthesising area and subsequently the biomass accumulated. Leaf expansion is known to decline under limited soil moisture due to a decrease in turgor pressure of newly formed leaf cells (Bacon, Reference Bacon1999). Table 7 shows strong significant correlations between leaf area and grain yield and with biomass, which is consistent with literature where dry matter production linearly increases with the amount of solar radiation intercepted by the leaf area (Bacon, Reference Bacon1999).
The lack of genotypic differences under well-watered conditions could be because the genotypes could not express themselves as much as they would due to the heat stress experienced. Under water stress, the lack of genotypic differences maybe because the genotypic diversity for drought tolerance was too small as shown by the lack of differences in STI and YSI. The consistence of Agbeacon to show relatively low SSI over the two seasons means that the cultivar is relatively less susceptible to stress compared to the other three cultivars. According to (Nazari and Pakniyat, Reference Nazari and Pakniyat2010), STI is more suitable for selecting cultivars under both water stress and well-watered conditions while SSI is more suitable for selection under water stress. The general lack of distinct genetic diversity in grain yield in triticale genotypes was also reported by Dogan et al. (Reference Dogan, Kacar, Coplu and Azkan2009). Blum (Reference Blum2014), stated that “Any given triticale cultivar or selection cannot be taken a priori as being stress resistant’’.
Growing season effect
The lack of differences in biomass accumulation between 2013 and 2014 for both GS71 and GS92 could be an indication of the similarities in environmental conditions in both seasons. Grain yield and kernel weight tended to be higher in 2014 compared to 2013 and was significant under SS. This can be attributed to the differences in assimilate partitioning as reflected by HI, kernel weight and GDD. More assimilates were portioned to the grain in 2014 compared to 2013 as shown by higher HI and kernel weight. It was also observed that average flag leaf carbon content at GS71 in 2014 was significantly higher than at GS71 in 2013. The flag leaf carbon content at GS92 was however similar in both years. This shows that more assimilates were exported to the grains in 2014. According to Khaliq et al. (Reference Khaliq, Irshad and Ahsan2008), flag leaves are a major contributor of assimilates for grain filling. Also, the grain filling stage in 2014 was relatively longer due to the relatively lower temperatures in 2014 (Figure 1). The temperature dependence of the grain filling stage is given by the formula:
 $$\displaystyle\frac{1}{D} = 0.0016T - 0.0096$$
(Day and Atkin, Reference Day and Atkin1984), where D is the duration of grain filling and T is mean temperature.
Flag leaf CO2 assimilation and carbon content
According to Blum (Reference Blum2011), cereal grain filling depends on two main carbon sources which are current assimilates from post-anthesis photosynthesis and reserve carbohydrates stored mainly in the stems. Grain filling under water- limited condition such as the SS treatment would be expected to depend on stored assimilates from vegetative stage while assimilates for grain filling under well-watered conditions (WW and SS) would be expected to come from current photosynthesis assimilates (Plaut et al., Reference Plaut, Butow, Blumenthal and Wrigley2004). In this study, there was on average 70% reduction in grain yield (77% in 2013 and 63% in 2014; Table 1 and Figure 4) between WW and SS conditions which corresponded well with an average of 70% reduction in CO2 assimilation rate (81% in 2013 and 59% in 2014; Table 4). The low CO2 assimilation rate observed under SS conditions suggests that assimilates for grain filling may have come from reserves rather than from current photosynthesis. Blum (Reference Blum2011) reported increased utilization of stored assimilates for grain filling, if photosynthesis is diminished by stress. However, as alluded to earlier the shortened grain filling period resulting from high temperatures could have resulted in more assimilates staying in the stems instead. The decreasing CO2 assimilation rate with soil moisture may have resulted from decreased stomatal conductance. As soil moisture decreases, roots produce ABA which signals stomata closure thus reducing CO2 diffusion into the leaf resulting in less carbon fixation. Intuitively, high flag leaf CO2 assimilation rate would be expected to correspond to high carbon content in the flag leaves but the reverse was true in this study. This is mainly because under favourable conditions up to 80% of assimilated carbon by mature leaves is exported to sinks (Lemoine et al., Reference Lemoine, La Camera, Atanassova, Dédaldéchamp, Allario, Pourtau, Bonnemain, Laloi, Coutos-Thévenot and Maurousset2013). However, sugars may also accumulate in leaves in case of growth limitation (Hummel et al., Reference Hummel, Pantin, Sulpice, Piques, Rolland, Dauzat, Christophe, Pervent, Bouteillé and Stitt2010) and hindrance to assimilate export. These results reveal that flag leaf carbon content is influenced more by the export capacity of the flag leaves than on CO2 assimilation rate.
Spectral reflectance indices
Spectral reflectance indices were more effective at detecting leaf water status at wavelengths between 758 and 1270 nm. When soil moisture was constantly available, spectral reflectance values were higher; an indication of good crop vigour but water stress reduced the values and the vigour also. Similar findings have been reported (Schittenhelm et al., Reference Schittenhelm, Kraft and Wittich2014). The strength of the relationship between the indices (NDVI, NDWI and WI) with grain yield and biomass followed the order WI > NDWI > NDVI, showing the superiority of WI in monitoring leaf water status in triticale. Accordingly, the results concur with the findings of Gutierrez et al. (Reference Gutierrez, Reynolds and Klatt2010). Even though water stress results in loss of leaf greenness, NDVI could not separate the moisture levels better than NDWI and WI. WI also showed great predictive capacity for CO2 assimilation rate in triticale flag leaves as shown by the correlation (0.63***) in Table 7. This correlation is of great ecological significance as it gives a measure of the photosynthetic activity of plants. WI has potential to be used in estimating CO2 sequestration especially in forests were direct physical measurement is a challenge. Other studies on WI which are related to photosynthetic activity have focused mainly on its correlation to leaf area index (Roberts et al., Reference Roberts, Brown, Green, Ustin and Hinckley1998). According to Diker and Bausch (Reference Diker and Bausch2003), NRI can be used to estimate N status in plants and its spatial variability in soils. In this study, no differences in NRI were observed both at GS31 and GS71 showing that there was no variability in N status in the field. Hence, the differences observed particularly in the greenness-based NDVI were solely due to moisture treatments. The advantages of using spectral reflectance indices in monitoring water stress is not only that they are rapid and non-destructive but can be quantitative for example, significant correlations have been found between these spectral reflectance indices and leaf water potential (Ramoelo et al., Reference Ramoelo, Dzikiti, van Deventer, Maherry, Cho and Gush2015). Leaf water potential is a measure of leaf water content. The lack of genotypic differences in spectral response to soil moisture alludes to the earlier notion that the four genotypes used in this study may not have been screened for drought tolerance because drought tolerant genotypes are characterised by a stay green flag leaf (Foulkes et al., Reference Foulkes, Sylvester-Bradley, Weightman and Snape2007) which would have given higher NDVI on tolerant genotypes compared to the susceptible ones.
CONCLUSION
The local spring triticale cultivars showed good adaptability to the steppe (arid) environment of Limpopo. They particularly showed tolerance to post anthesis high temperatures by producing reasonable yields even when maximum temperatures were above optimal. Even though the study showed that triticale cannot be grown to maturity on residual moisture alone, it performed reasonably well under MS conditions. At this moisture level, livestock farmers can successfully grow triticale for whole plant silage by harvesting it at milk stage and should expect aboveground dry biomass yields of more than 8 t ha−1. The study also revealed the superiority of water-based indices, particularly the WI over green-based NDVI in monitoring leaf water status in triticale. WI also showed potential in predicting photosynthetic activity in triticale.