
I. INTRODUCTION
Duplex stainless steels (DSSs) are a class of stainless steels with wide applications in different industries. DSSs are comprised of δ-ferrite and austenite with comparable volume fractions. Since δ-ferrite is more stable at higher temperatures, its content increases with increasing temperature and microstructure becomes fully ferritic at temperatures over 1200 °C. Reference Keshmiri, Momeni, Dehghani, Ebrahimi and Heidari1–Reference Duprez, De Cooman and Akdut3 Hence, in the hot working temperature range of 900–1200 °C, most of DSSs have a duplex microstructure. The coexistence of austenite and ferrite with different deformation and restoration mechanisms makes it difficult to easily interpret the flow behavior of DSSs through hot or cold working. This complexity has been the motive force for a number of investigations in the past decades. Reference Balancin, Hoffmann and Jonas4–Reference Han, Zou, Chen, Fan and Zhang7
The major source of complexity in the hot deformation behavior of DSSs is that ferrite and austenite have different specific strengths and are softened by different mechanisms. While ferrite undergoes dynamic recovery (DRV), Reference Mao, Yang and Su8–Reference Cizek and Wynne10 austenite tends to soften by dynamic recrystallization (DRX). Reference Momeni, Ebrahimi, Jahazi and Bocher11–Reference Lin, Wu, Chen, Chen, Wen, Zhang and Li14 The major difference in the softening behaviors of ferrite and austenite makes it difficult to find a simple model for the flow curves. In other words, the phenomenological and physical-based models, which have been so far developed for single-phase ferritic or austenitic steels, cannot be used to predict the flow behavior of DSSs.
In the past decades, some researchers have tried old constitutive equations such as the hyperbolic sine function for modeling the flow curves of DSSs. Reference Momeni and Dehghani15–Reference Momeni, Dehghani and Zhang17 Other researchers tried to develop new constitutive equations based on the law of mixture rule and the individual behaviors of ferrite and austenite. Reference Spigarelli, El Mehtedi, Cabibbo, Gabrielli and Ciccarelli18,Reference Momeni, Dehghani and Poletti19 Given the efforts devoted to the issue, the hot deformation behavior of DSSs needs further investigations with the focus on the microstructural evolution and flow curve modeling. Hence, the present investigation aimed at moving forward the current knowledge of the hot deformation behavior of DSSs. In this investigation hot compression tests over a wide range of temperatures and strain rates have been carried out to investigate the microstructural evolution during hot working of 2304 DSS. Moreover, a new constitutive equation has been developed to predict the flow stress at different temperatures and strain rates.
II. MATERIAL AND METHODS
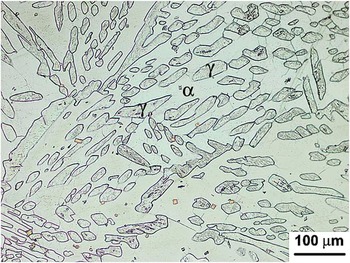
The material used in this study was 2304 DSS with 0.06% C, 21.03% Cr, 4.8% Ni, 0.17% Mo, 0.71% Si, 0.65% Mn, 0.004% S, 0.028% P, and the rest of Fe (all in wt%). The material was cast in a vacuum furnace and then homogenized at 1200 °C for 20 min and quenched to the ambient temperature. The starting microstructure of the material, shown in Fig. 1, was consisted of about 54% ferrite and 45% austenite (volume percents). In the micrograph, the matrix is ferrite, in which the austenite islands have been distributed without a specific orientation.
Starting microstructure of cast 2304 after casting and homogenization. The matrix is ferrite and the darker islands are austenite.

The cylindrical specimens with 10 mm diameter and 15 mm height were prepared from the homogenized cast ingot. Before testing, all specimens were reheated at 1200 °C, held for 5 min and then cooled down at rate of 5 °C/min to testing temperatures. Hot compression tests were performed at temperatures of 850–1150 °C and strain rates of 0.001–1 s−1 up to the true strain of 0.5. The Zwick-Roell testing machine used in this investigation was equipped with a computer-controlled furnace with the accuracy of ±5 °C. The load–displacement data were recorded by the unit software and then transformed into true stress–strain data by the standard equations. The load cell accuracy was about ±1%. After testing, the hot deformed specimens were quenched within 1–3 s to preserve the microstructures. Graphite powder was applied on both contacting specimen/anvil surfaces to reduce friction coefficient.
For microstructural investigations the hot deformed specimens were cut along their longitudinal axis and the tangential sections were prepared by the standard metallographic techniques. After common grinding and polishing steps, the samples were electrolytically etched in a 40 pct solution of HNO3 and then characterized by an optical microscope.
III. RESULTS AND DISCUSSION
A. Flow curves and constitutive analysis
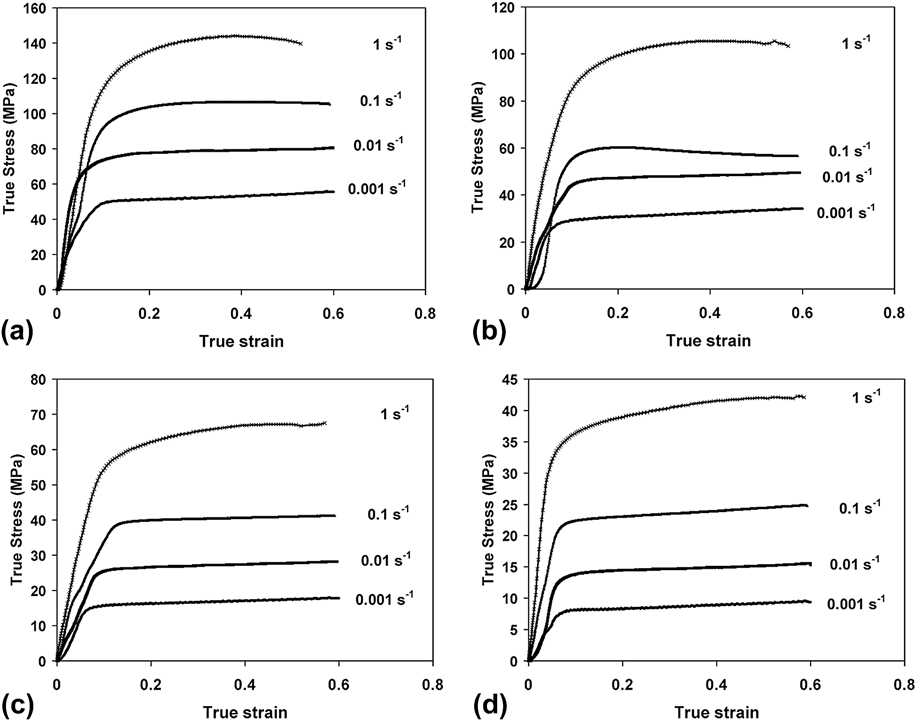
Figure 2 demonstrates typical flow curves plotted based on load-stroke data obtained at different deformation conditions. The stress–strain curves clearly indicate the profound effects of temperature and strain rate on the flow behavior. Obviously, at low temperatures and high strain rates, e.g., 850 and 950 °C and strain rates of 0.1 and 1 s−1, flow curves exhibit a moderate work hardening up to a faint peak, which is followed by a gradual flow softening. In the opposite conditions, i.e., high temperatures and low strain rates such as 1050 and 1150 °C and strain rates of 0.001 and 0.01 s−1, the flow curves are characterized by a plateau after work hardening. Such behavior which is typical of DRV indicates that at high temperatures and low strain rates, the material behaves as if only ferrite is present. However, in contrast, at high strain rates and low temperatures, the contribution of austenite is deduced from the peak, which is associated with the start of DRX. Reference Liu, Ning, Yao, Li, Zhang and Fu20
True stress–true strain curves obtained at different strain rates and temperatures: (a) 850 °C, (b) 950 °C, (c) 1050 °C, and (d) 1150 °C.

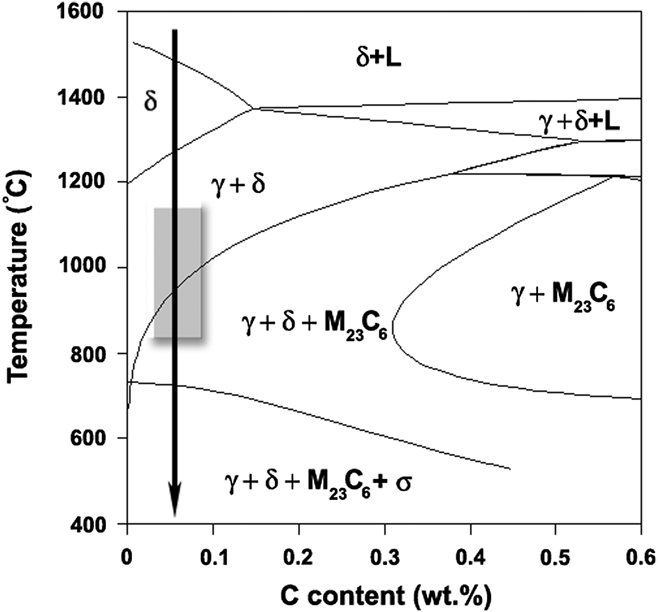
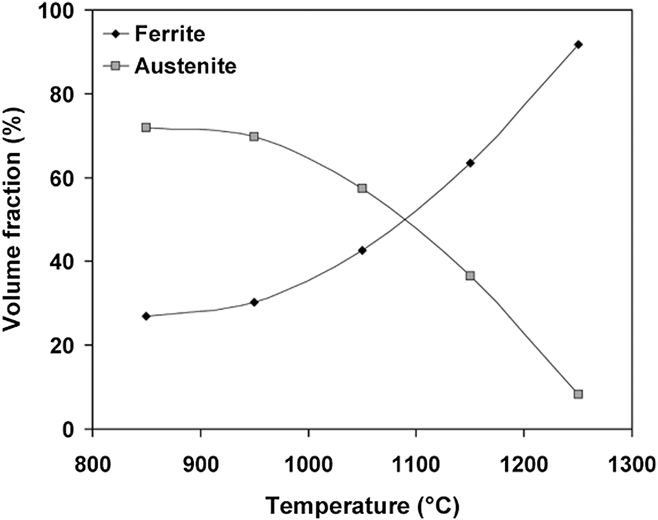
These observations can be simply accounted for by considering the variation of ferrite and austenite volume fractions at different deformation temperatures. According to the phase diagram calculated by the Thermocalc software in Fig. 3, ferrite, austenite (γ and δ), and M23C6 carbides are the microstructural constituents of 2304 (% C = 0.06) in the hot working range (dark rectangle). It should be noted that M23C6 carbide is often formed by aging within the same temperature range Reference Zucato, Moreira, Machado and Giampietri Lebrão21 and is therefore absent in the present material. The phase diagram also shows that the material becomes fully ferritic at temperatures beyond 1300 °C. Figure 4 indicates a rough calculation of austenite and ferrite volume fractions in the hot working range. It is observed that as temperature rises, the volume fraction of ferrite increases and that of austenite decreases vice versa. Hence, it is easy to understand that why the material behaves as if it is fully ferritic when is deformed at 1050 and 1150 °C.
Phase diagram of the studied alloy calculated by the Thermocalc software, representing the position of the studied alloy by the arrow and the studied hot working range of temperature as a dashed region.

Variation of ferrite and austenite volume fractions with temperature calculated based on the phase diagram of Fig. 3.

At low temperatures, especially below 1050 °C, a faint peak appears, representing the initiation of DRX in austenite. It is evident that the peak is more pronounced at high strain rates. Indeed, high strain rates stimulate austenite to take a greater contribution to plastic deformation of DSS. Some works on the individual flow behaviors of ferrite and austenite have shown that there is a considerable difference between the strength levels of these constituents at hot working temperatures. Reference Spigarelli, El Mehtedi, Cabibbo, Gabrielli and Ciccarelli18,Reference Momeni, Dehghani and Poletti19 As ferrite is the softer phase, it accommodates more strain than austenite. Duprez et al. Reference Duprez, De Cooman and Akdut3 showed that strain is primarily accommodated by ferrite and then transfers to austenite. The strain transfer is a complicated process which depends on temperature and strain rate. At high temperatures and low strain rates, when ferrite can simply convey large strains due to its expeditious DRV, strain transfer is postponed and austenite can only take a small portion of the total strain. This is clearly understood from the flow curves of Fig. 2 at such conditions. The small strains in austenite do not increase the dislocation density to the critical point for DRX, and therefore the peak is absent. This is why the material behaves as if it is only consisted of ferrite. In contrast, when strain rate rises or temperature decreases, DRV in ferrite degrades and therefore the strain transfer occurs sooner. This gives rise to more accumulation of strain into austenite which finally triggers DRX at the peak.
As the flow stress is not very sensitive to strain, its variation with temperature and strain rate can be described by the familiar hyperbolic sine constitutive equation, given as follows Reference Farnoush, Momeni, Dehghani, Aghazadeh Mohandesi and Keshmiri5 :
 $$Z = \dot \varepsilon \exp \left( {{Q \over {RT}}} \right) = A{\rm{\ }}{\left[ {\sinh (\alpha \cdot \sigma )} \right]^n}\quad ,$$
where Z stands for the Zener–Hollomon parameter, which incorporates the effects of strain rate and temperature, Q is the apparent activation energy and A, α, and n are the material constants. The materials constants can be determined using the logarithmic form of Eq. (1), given by:
 $$\ln \dot \varepsilon {\rm{\ }} + {Q \over {RT}} = \ln \,A{\rm{\ }} + n\,\ln \left[ {\sinh (\alpha \cdot \sigma )} \right]\quad .$$
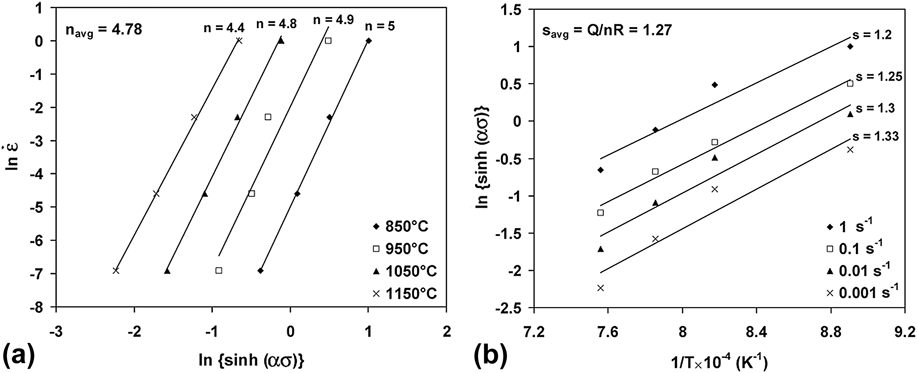
The stress exponent, n, can be determined from the plot of strain rate versus the hyperbolic sine of flow stress (e.g., at ε = 0.4) in a logarithmic scale [Eq. (2)], as illustrated in Fig. 5(a). Similarly, in the plot of ln[sinh(α·σ)] versus 1/T [Fig. 5(b)], Q/nR is the average slope whereby the apparent activation energy can be determined. Based on the adopted method the value of Q is calculated about 508 kJ/mol. It has been proposed that the value of Q for DSSs is often between those of single-phase ferritic and austenitic stainless steels (SSs). Reference Farnoush, Momeni, Dehghani, Aghazadeh Mohandesi and Keshmiri5 This means that the deformation resistance of DSSs is higher than that of ferritic SSs and lower than that of austenitic SSs. On the other words, the high value of Q indicates that flow stress in the studied DSS is highly temperature-dependent.
Variation of the flow stress with (a) strain rate and (b) reciprocal of temperature, in the frame of the hyperbolic sine constitutive equation.

B. Microstructural observations
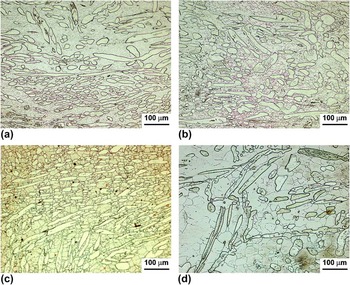
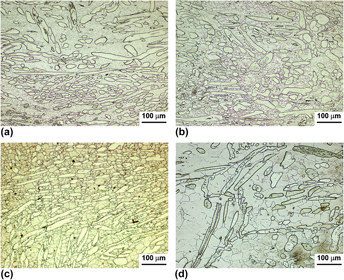
As mentioned, the hot deformation behavior of DSSs is complex due to the coexistence of ferrite and austenite. For this reason, the observation of hot deformed microstructures is a key tool to verify and interpret the mechanical testing results which were presented in Sec. II. The influence of deformation temperature on the microstructures deformed at the typical strain rate of 0.1 s−1 is observed in Fig. 6. It is observed that the volume fraction of austenite islands has decreased with increase in temperature. This actually decreases the contribution of austenite in the deformation at high temperatures. The observation of none-flattened globular austenite islands is another reason for the low contribution of austenite in the deformed material. In addition, even at 1150 °C, there is no sign of DRX within the austenite islands. It seems that the morphology of austenite may restrict its contribution to the applied strain and therefore its tendency for DRX. It is clear that there are not enough grain boundaries inside the γ islands and the sessile δ/γ phase boundary cannot take part in the nucleation of DRX. In contrast to austenite, the evolutions in ferrite are considerable. The average size of the ferrite grains has clearly increased from about 10 to 15 μm at 850 °C to about 50 μm at 1150 °C. Moreover, the ferrite grains have become sharper at 1050 °C and 1150 °C, which indicates the evolution of the boundaries through the grain growth process. A mechanism such as continuous DRX may be suggested to lead a gradual increase in the misorientation along the boundaries and therefore making them well defined under the microscope.
Micrographs of the hot deformed samples at strain rate of 0.1 s−1 and various temperatures: (a) 850 °C, (b) 950 °C, (c) 1050 °C, and (d) 1150 °C.

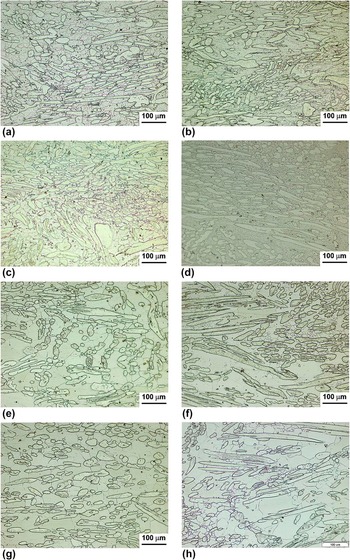
Figure 7 indicates the effect of strain rate on the microstructures obtained at various deformation temperatures. At all studied temperatures, it is obvious that increasing strain rate from 0.001 to 1 s−1 has decreased the average size of the ferrite grains. This is more remarkable at higher temperatures of 1050 and 1150 °C, where the material is subjected to fast grain growth. Indeed, increasing strain rate decreases the deformation time that a sample is subjected to and the finer grain size is r rational result. Another important point is the presence of equiaxed grains in the matrix at all deformation conditions. Based on these observations, it is easily deduced that DRV in ferrite is the major microstructural evolution through the hot deformation of DSSs. Opposite to the evolutions in the matrix, the microstructure of austenite seems to be nearly stable. As mentioned earlier, the major part of the applied strain is accommodated by ferrite and therefore the strain which is carried by the austenite is not enough to propel DRX in this phase. This is nearly the same for all temperatures and strain rates. However, increasing temperature, due to its effect on decreasing the required strain for DRX in austenite, and increasing strain rate, due to increasing the rate of dislocations accumulation, would lead to partial DRX in the austenite. Reference Chen, Lin and Ma22 The electron back-scattered diffraction (EBSD) observations carried out by Momeni et al. Reference Momeni, Dehghani and Zhang17,Reference Momeni, Kazemi and Bahrani23 supports this idea; however, the amount of DRX was reported as low as 10%. The micrographs of Figs. 7(f) and 7(h) illustrate some signs of DRX inside the islands which are absent at lower temperatures.
Micrographs of the hot deformed samples at (a) 850 °C-0.001 s−1, (b) 850 °C-1 s−1, (c) 950 °C-0.001 s−1, (d) 950 °C-1 s−1, (e) 1050 °C-0.001 s−1, (f) 1050 °C-1 s−1, (g) 1150 °C-0.001 s−1, and (h) 1150 °C-1 s−1.

C. A new constitutive equation for modeling the flow curves
As shown in the previous sections, the complexity in DSSs originates from the coexistence of ferrite and austenite with different deformation mechanisms. And this makes it difficult to establish a simple model for predicting the flow curves. Through decades, different constitutive equations have been used to model the flow behavior of single-phase ferritic or austenitic microstructures. The adopted approaches have been divided into two major categories of phenomenological or physics-based models. Reference Lin and Chen24 Some well-known models in each category have been widely investigated for different alloys. Reference Johnson and Cook25–Reference Lin and Chen27 However, the models which have been used to describe σ(ε), e.g., Kocks-type models Reference Kocks26 or Avrami’s kinetics equation, Reference Jonas, Quelennec, Jiang and Martin28 cannot consider concomitant microstructural evolutions such as DRV, DRX, and work hardening in ferrite and austenite. As work hardening is the major part of the microstructural evolution in both phases, it is possible to construct the model based on the simple work hardening equations such as Ludwik’s model. Baragar Reference Baragar29 used a modified form of the Ludwik’s model to include the effect of other microstructural mechanisms such as DRV during hot working of plain carbon and HSLA steels. The equation proposed by Baragar is presented as follows Reference Baragar29 :
 $$\sigma = a + b{\varepsilon ^{0.4}} + c{\varepsilon ^{0.8}} + d{\varepsilon ^{1.2}}\quad ,$$
where a, b, c, and d are the material constants. The general form of above equation can be proposed as follows:
 $$\sigma = {a_1} + {a_2}{\varepsilon ^q} + {a_3}{\varepsilon ^{2q}} + {a_4}{\varepsilon ^{3q}}\quad ,$$
where a 1 to a 4 and q are the material constants. The most important question that may arise here is that whether Eq. (3) can be used for a duplex structure of austenite and ferrite. To answer this question, we have to verify whether Eq. (3) is capable to describe the flow behaviors of ferrite and austenite separately.
The flow behavior of ferrite in DSSs is often described by the Kocks model Reference Kocks26 which is constructed based on the dislocation evolution law during work hardening and DRV. The Kock’s model is finalized to the following description of σ(ε):
 $$\sigma = {\sigma _{\rm{s}}} + ({\sigma _{\rm{s}}} - {\sigma _0})\exp ( - r\varepsilon )\quad ,$$
where σs and σ0 are the saturated and yield stress and r is the recovery factor. Assuming σs ≫ σ0, Eq. (5) can be simplified as follows:
 $$\sigma = {\sigma _{\rm{s}}}\left[ {1 + \exp ( - r\varepsilon )} \right]\quad .$$
By using the Taylor series for the exponential function (1 + x + x 2/2! + x 3/3! + …), Eq. (6) can be rewritten as:
 $$\sigma = {\sigma _{\rm{s}}}\left[ {2 - r\varepsilon + {1 \over 2}{{\left( {r\varepsilon } \right)}^2} - {1 \over 6}{{(r\varepsilon )}^3}} \right]\quad .$$
It is obvious that Eq. (7) is a version of Eq. (4) with q = 1. It is therefore concluded that Eq. (4) in its general form is able to consider the flow behavior of ferrite in a DSS. To establish a formulation for the flow behavior of austenite, we can start with the equation proposed by Cingara and McQueen Reference Cingara and McQueen30 as follows:
 $${\sigma \over {{\sigma _{\rm{p}}}}} = {\left[ {\left( {{\varepsilon \mathord{\left/ {\vphantom {\varepsilon {{\varepsilon _{\rm{p}}}}}} \right. \kern-\nulldelimiterspace} {{\varepsilon _{\rm{p}}}}}} \right)\exp \left( {1 - {\varepsilon \mathord{\left/ {\vphantom {\varepsilon {{\varepsilon _{\rm{p}}}}}} \right. \kern-\nulldelimiterspace} {{\varepsilon _{\rm{p}}}}}} \right)} \right]^C}\quad ,$$
where C is a material constant and σp and εp denotes the peak stress and strain of a typical DRX flow curve. This equation can satisfactorily model the flow curve of austenite even up to the early stages of DRX. Yazdani et al. Reference Yazdani, Abbasi, Karimi Taheri and Momeni31 showed that the value of c determines the rate of work hardening and can vary between 0.2 and 0.85. Using the Taylor series for the exponential function and doing some algebraic operations, Eq. (8) can be simplified as follows:
 $${\sigma \over {{\sigma _{\rm{p}}}}} = {\left[ {2.5\left( {{\varepsilon \over {{\varepsilon _{\rm{p}}}}}} \right) - 2{{\left( {{\varepsilon \over {{\varepsilon _{\rm{p}}}}}} \right)}^2} + 0.5{{\left( {{\varepsilon \over {{\varepsilon _{\rm{p}}}}}} \right)}^3}} \right]^C}\quad .$$
The final step in this sequence is to calculate the flow stress of the DSS using the law of mixture rule, which has been applied for different two-phase alloys such as leaded brasses or stainless steels Reference Momeni32 :
 $${\sigma _{{\rm{DSS}}}} = {f_\gamma }{\sigma _\gamma } + {f_\alpha }{\sigma _\delta }\quad ,$$
where f stands for the volume fraction and subscripts γ and δ refer to austenite and ferrite, respectively. If Eqs. (7), (9), and (10) are combined; the flow stress of a DSS can be proposed as follows:
 $${\sigma _{{\rm{DSS}}}} =\; {f_\gamma }{\sigma _{\rm{p}}}{\left[ {2.5\left( {{\varepsilon \over {{\varepsilon _{\rm{p}}}}}} \right) - 2{{\left( {{\varepsilon \over {{\varepsilon _{\rm{p}}}}}} \right)}^2} + 0.5{{\left( {{\varepsilon \over {{\varepsilon _{\rm{p}}}}}} \right)}^3}} \right]^C} + {f_\alpha }{\sigma _{\rm{s}}}\left[ {2 - r\varepsilon + {1 \over 2}{{\left( {r\varepsilon } \right)}^2} - {1 \over 6}{{\left( {r\varepsilon } \right)}^3}} \right]\quad .$$
It is obvious that Eq. (11) can be simplified to the general form of Baragars’s equation, given by Eq. (3). This approach proves that the Baragars’s equation is capable to take both the flow cures of ferrite and austenite into consideration and incorporate them into a single simple equation for any DSS. Equations (3) and (11) show that a, b, c, and d are the material constants which are functions of σp and εp (for austenite), σs and r (for ferrite), f γ and f δ.
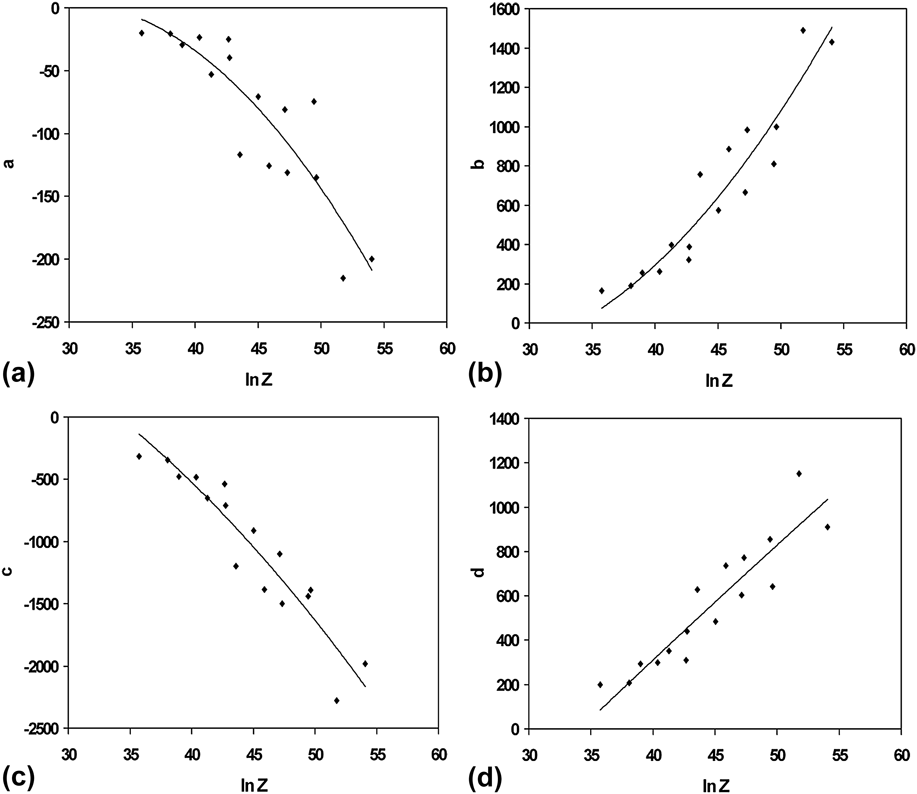
Based on Eq. (3), by taking p equal to 0.4, the least square fitting method can be used to calculate the material constants a, b, and c at different deformation conditions. As mentioned, the material constants a, b, and c are functions of σp and εp (for austenite), σs and r (for ferrite), f γ and f δ and they can be related to the deformation temperature and strain rate or the Z parameter. Figure 8 shows the variations of a, b, c, and d with the Z parameter.
Materials constants a, b, c, and d [in Eq. (4)] as functions of the Zener–Hollomon parameter. The curves give the polynomial fitting of experimental data.

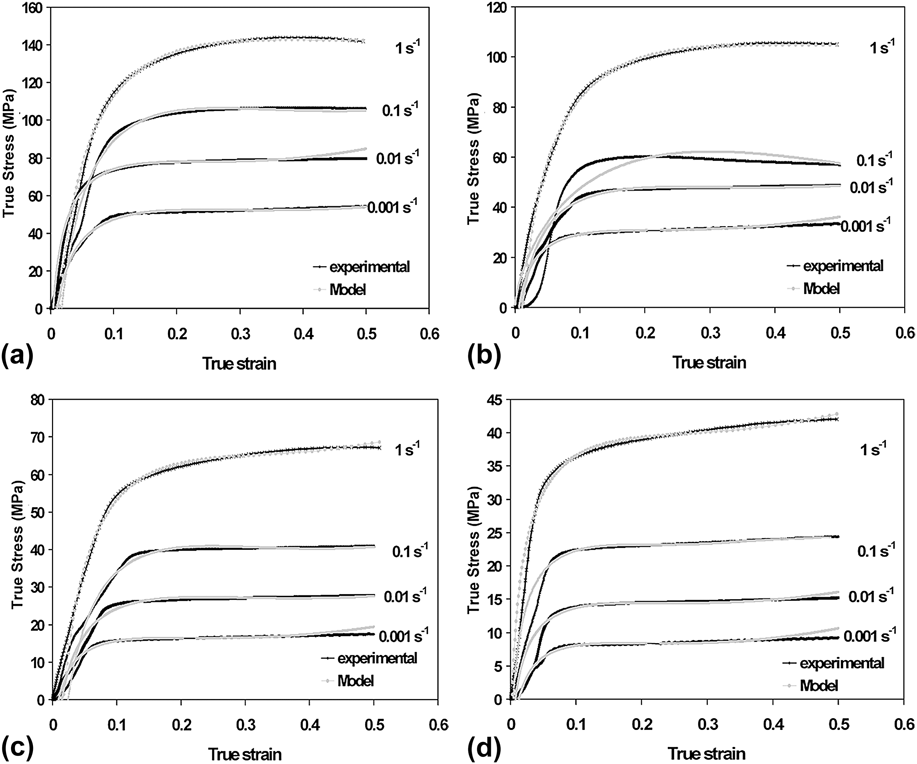
The values of Z were determined using the method described in Sec. III. A. It is observed that polynomial curves well define the relationship between the constants and Z. By using the predicted values of the constants and replacing into Eq. (11) the modeled curves were calculated and superimposed on the experimental ones in Fig. 9. It is manifest that the model developed based on the Baragar’s equation can satisfactorily predict the experimental flow curves.
Comparison of the experimental flow curves and those calculated using the established constitutive equation in Eq. (12): (a) 850 °C, (b) 950 °C, (c) 1050 °C, and (d) 1150 °C.

IV. CONCLUSIONS
The hot deformation characteristics of cast 2304 DSS were analyzed by the constitutive equations and microstructural observations. The major results are listed below:
-
(1) The flow curves at low temperatures and high strain rates are characterized by moderate work hardening up to a faint peak followed by a moderate work softening. All these were attributed to the sluggish DRV in ferrite and partial DRX in austenite.
-
(2) At high temperatures and low strain rates, the flow curves were characterized by a long plateau after primary work hardening, representing the expeditious DRV in ferrite.
-
(3) The hyperbolic sine constitutive equation was used to establish a relationship between flow stress and the Zener–Hollomon parameter. The value of apparent activation energy was calculated as 508 kJ/mol.
-
(4) The microstructural observations confirmed that DRV in ferrite occurs at all temperatures and strain rates. However, the DRX in austenite partly occurs at high temperatures and high strain rates.
-
(5) A new constitutive equation was proposed based on the flow behaviors of ferrite and austenite and the law of mixture rule. The proposed equation was constructed based on the Baragar’s model to consider work hardening and DRV in the constituent phases. The proposed model satisfactorily predicts the flow curves at different deformation regimes.