Introduction
The emerald ash borer (EAB), Agrilus planipennis Fairmaire (Coleoptera: Buprestidae), is a phloem-feeding insect native to Asia, which was accidentally introduced into North America. It was first detected near Detroit, Michigan, United States of America and in Windsor, Ontario, Canada in 2002 (Cappaert et al. Reference Cappaert, McCullough, Poland and Siegert2005; Poland and McCullough Reference Poland and McCullough2006). Populations of this devastating insect have now been identified in 21 additional states in the United States of America and the province of Québec in Canada (Emerald Ash Borer Information 2014). This invasive species has caused significant mortality to ash trees (Fraxinus Linnaeus, Oleaceae) in North America, killing tens of millions of trees. Indeed, more than 99% of ash trees are typically killed by EAB within six years of its initial detection in an area (Knight et al. Reference Knight, Brown and Long2013). Early detection of EAB infestations was, and continues to be, extremely difficult due to its cryptic larval feeding and lack of obvious signs or symptoms during initial stages of infestation. Although EAB was first detected in 2002, dendrochronological analysis has since demonstrated that populations of this insect were established at least 10 years before its discovery (Siegert et al. Reference Siegert, McCullough, Liebhold and Telewski2014). Moreover, initially there was no information on sampling tools or techniques for detection and/or monitoring of its populations.
Detection and delimitation are critical components of an integrated pest management response plan. Considerable research has been conducted into different sampling methods to detect and quantify infestations of this invasive pest. Research areas have included: (1) relating visual signs and symptoms to the presence of EAB infestations; (2) use of girdled trap-trees to increase captures of adults and subsequent larval densities; (3) sub-sampling protocols to detect galleries under the bark based on where they are distributed within the tree; (4) traps attractive to A. planipennis that are baited with pheromones, host volatiles or both; (5) biosurveillance using buprestid-hunting wasps; and (6) remote sensing techniques to detect damage caused by EAB. In addition, research has been conducted to model patterns of infestation at the landscape scale, thus providing information that can be used to inform detection and delimitation sampling programmes.
Sampling tools and techniques
Visual signs and symptoms of infestation
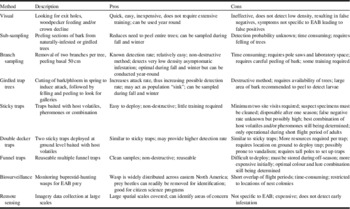
One survey technique is to inspect trees for signs and symptoms of EAB infestation. Signs include exit holes and galleries observed through cracks in the bark (de Groot et al. Reference de Groot, Biggs, Lyons, Scarr, Czwerwinski and Evans2006; Lyons et al. Reference Lyons, Caister, de Groot, Hamilton, Marchant and Scarr2007). Symptoms can include woodpecker feeding, canopy thinning and decline, and production of epicormic shoots. Two studies quantified relationships among crown decline and thinning and the number of EAB exit holes and woodpecker attacks (Anulewicz et al. Reference Anulewicz, McCullough and Cappaert2007; Smitley et al. Reference Smitley, Davis and Rebek2008). In one of the studies, the number of EAB exit holes explained approximately half of the variation in canopy thinning (Smitley et al. Reference Smitley, Davis and Rebek2008). Peters et al. (Reference Peters, Iverson and Sydnor2009) developed a rating system to classify tree health based on per cent light transmission, the number of epicormic shoots, and the number of exit holes on affected trees. In another study, as the density of EAB galleries increased so did the amount of a heavier carbon isotope in the foliage, indicative of the stress caused by the infestation (Flower et al. Reference Flower, Knight, Rebbeck and Gonzalez-Meler2013). Thus, it is possible to relate visual signs and symptoms to the presence of EAB infestation, with some indication of EAB density within a given tree (Table 1).
Description of sampling tools and techniques for emerald ash borer (EAB), Agrilus planipennis.

Counting of exit holes and rating crown condition may be easy and relatively inexpensive, however there are significant drawbacks with relying on visual signs and symptoms to detect EAB. First, signs and symptoms are typically not apparent until infestations are moderate to high in intensity. In some cases, numerous exit holes were present on ash trees with little or no apparent dieback (Anulewicz et al. Reference Anulewicz, McCullough and Cappaert2007). Similarly, in Peters et al. (Reference Peters, Iverson and Sydnor2009), moderate to high populations of EAB occurred before epicormic shoots were apparent. Knight et al. (Reference Knight, Brown and Long2013) reported that the first EAB exit holes would not be detected until a minimum of two years after initial infestation. We have also observed numerous trees displaying no signs or symptoms that were subsequently determined to be infested (Ryall et al. Reference Ryall, Fidgen and Turgeon2011). An additional concern is that EAB infestation levels may have been underestimated in previous work because exit holes were counted only on the main stem (Smitley et al. Reference Smitley, Davis and Rebek2008; Peters et al. Reference Peters, Iverson and Sydnor2009; Knight et al. Reference Knight, Brown and Long2013); this approach would fail to detect early infestation, which typically begins in the crown of larger trees (Haack et al. Reference Haack, Jendek, Liu, Marchant, Petrice and Poland2002; Herms et al. Reference Herms, McCullough and Smitley2004; Cappaert et al. Reference Cappaert, McCullough, Poland and Siegert2005; Ryall et al. Reference Ryall, Fidgen and Turgeon2011). Finally, in Flower et al. (Reference Flower, Knight, Rebbeck and Gonzalez-Meler2013), carbon isotope composition did not change significantly until EAB density was high. Moreover, sampling of carbon isotope composition is too time consuming and expensive to be feasible as a survey method. Another major problem is that ash trees can exhibit symptoms of stress that are not related to EAB. For instance, both Anulewicz et al. (Reference Anulewicz, McCullough and Cappaert2007) and Smitley et al. (Reference Smitley, Davis and Rebek2008) reported trees with few or no EAB exit holes but with high levels of dieback from other causes. Thus, in the absence of a sign of EAB (exit hole, adult, larva, or gallery), it is not possible to confirm EAB infestation based on visual symptoms. Therefore, currently available methods based on visual signs and symptoms alone are both inadequate for early detection and not necessarily diagnostic of EAB.
Use of girdled trap trees
Girdling is a process where ash trees are intentionally damaged to artificially induce stress and thus increase their attractiveness to adult EAB. Several studies demonstrated that girdled trees attract more adults, or have higher larval densities, or both, as compared with trees subjected to other treatments (e.g., wounded, stressed with methyl jasmonate, treated with herbicide, cutting into trap logs, or untreated) (McCullough et al. Reference McCullough, Poland, Anulewicz and Cappaert2009a, Reference McCullough, Poland and Cappaert2009b, Reference McCullough, Siegert, Poland, Pierce and Ahn2011; Tluczek et al. Reference Tluczek, McCullough and Poland2011; Fierke et al. Reference Fierke, Whitmore, Foelker, Vandenberg and Carlson2013). Girdling can thus potentially increase the likelihood of detecting EAB infestation (Table 1). Girdled trap trees have been deployed in systematic grids to delimit EAB populations and within-tree larval densities have been used to quantify the spatial distribution of the infestation (Fierke et al. Reference Fierke, Whitmore, Foelker, Vandenberg and Carlson2013; Mercader et al. Reference Mercader, McCullough and Bedford2013). Mercader et al. (Reference Mercader, McCullough and Bedford2013) also reported that girdled trap trees were more likely to detect EAB populations than artificial traps (discussed below). Girdling of trees is, however, a destructive sampling method, requiring trees to be felled and then peeled after girdling. Deployment of this method into a detection or delimitation survey is reliant on the availability of ash trees of the appropriate size, age, and location. Moreover, cost-benefit analysis based on detection rates and the resources required to implement a girdling or trap-tree programme have not been conducted.
Sub-sampling protocols
Direct sampling of wood-boring insects is labour-intensive, therefore it is important to develop sub-sampling protocols, which focus sampling efforts on portions of the tree to maximise detection rates or optimise density estimates. To develop such protocols, it is necessary to first determine where infestations begin within a given tree (Speight Reference Speight2005). Knowledge of the distribution of EAB larvae within ash trees, especially during the initial stages of infestation, is therefore critical for developing sub-sampling techniques for early detection. A number of studies reported that most of the EAB galleries occurred in regions of the stem ~7–12 cm in diameter, either within naturally infested trees (Timms et al. Reference Timms, Smith and de Groot2006; Tluczek et al. Reference Tluczek, McCullough and Poland2011) or on trees which had been girdled to induce EAB attack (Marshall et al. Reference Marshall, Storer, Fraser, Beachy and Mastro2009, Reference Marshall, Storer, Fraser and Mastro2010a; Tluczek et al. Reference Tluczek, McCullough and Poland2011). In a fourth study on girdled trees, sampling from an intermediate diameter of 17 cm was recommended to maximise probability of detection (Foelker et al. Reference Foelker, Vandenberg, Whitmore and Fierke2013); however, trees in that study were slightly larger (15–25 cm diameter at breast height (DBH)) than those sampled in the other studies (<15–20 cm DBH). Based on these studies of within-tree distribution of larval galleries, sub-sampling approaches have been suggested (Table 1). For example, by targeting sampling efforts on the 8–12 cm diameter size range of a tree, Marshall et al. (Reference Marshall, Storer, Fraser and Mastro2010a) found it would be necessary to peel <45% of the tree to detect >50% of the larvae. Moreover, if the objective of a sampling programme was the detection per se of EAB infestation, then peeling of bark could stop after the first discovery of a larval gallery, thus further reducing sampling effort.
Anecdotal evidence from earlier studies suggested that EAB infestation begins in the crown of larger trees (Haack et al. Reference Haack, Jendek, Liu, Marchant, Petrice and Poland2002; Herms et al. Reference Herms, McCullough and Smitley2004; Cappaert et al. Reference Cappaert, McCullough, Poland and Siegert2005). Ryall et al. (Reference Ryall, Fidgen and Turgeon2011) found that early infestation in trees 20–40 cm DBH was often detected in branches 6–10 cm in diameter, corresponding with the size range previously reported from smaller trees (Timms et al. Reference Timms, Smith and de Groot2006; Marshall et al. Reference Marshall, Storer, Fraser, Beachy and Mastro2009, Reference Marshall, Storer, Fraser and Mastro2010a; Tluczek et al. Reference Tluczek, McCullough and Poland2011). Based on that finding, they developed a technique to sample branches from the crown of mature open-grown ash trees. This technique provides a high rate of detection (74%) of low-density asymptomatic infestations and does not require felling of the tree. Next, Legg et al. (Reference Legg, Fidgen and Ryall2014) developed random resampling models to estimate the number of trees necessary to sample using branch sampling to provide a high probability of detecting EAB, based on sampling for infestations of varying sizes (e.g., 1% of trees infested); this enables detection surveys to be conducted with a known probability of detection. However, while the branch sampling method is simple, it is considered to be labour-intensive by some managers (K.R., personal observation). Moreover, sampling protocols for trees outside the size range studied by Ryall et al. (Reference Ryall, Fidgen and Turgeon2011) (i.e., >20–40 cm in diameter) do not exist nor do protocols for trees without large-enough branches to sample. It is also necessary to develop methods to accurately estimate EAB density within infested trees to inform management decisions. Only two studies have attempted to quantify within-tree EAB density: Marshall et al. (Reference Marshall, Storer, Fraser and Mastro2010a) reported that EAB larval density in the 8–12 cm diameter region of the stem was related to density within the whole tree. In contrast, Foelker et al. (Reference Foelker, Vandenberg, Whitmore and Fierke2013) recommended a 1 m sub-sample be taken from 1 to 2 m height on the bole to provide a good prediction of whole-tree larval density. More research is clearly needed to develop a sampling protocol that minimises sampling effort while maximising detection rates and providing reasonable estimates of density.
Development of artificial traps and attractant lures
Species-specific traps are an important sampling tool for detection and delimitation of insect pests. Extensive research has been conducted with the objective of developing an effective trap and lure combination for attracting and capturing flying EAB adults (Table 1). Much of the literature on EAB trapping has been summarised in three other reviews (Crook and Mastro Reference Crook and Mastro2010; Herms and McCullough Reference Herms and McCullough2014; Silk and Ryall Reference Silk and Ryall2014). A separate review would be necessary to provide a synthesis of results of all trapping studies due to the large number of trap, colour, and lure combinations. Only brief overview of research investigating trapping tools and techniques is provided here.
Three different types of traps have been developed for sampling of EAB adults: (1) a sticky prism canopy trap (Francese et al. Reference Francese, Mastro, Oliver, Lance, Youssef and Lavallee2005, Reference Francese, Oliver, Fraser, Lance, Youssef and Sawyer2008, Reference Francese, Crook, Fraser, Lance, Sawyer and Mastro2010a, Reference Francese, Fraser, Rietz, Crook, Lance and Mastro2010b, Reference Francese, Rietz, Crook, Fraser, Lance and Mastro2013a, Reference Francese, Rietz and Mastro2013b; Crook et al. Reference Crook, Francese, Zylstra, Fraser, Sawyer and Bartels2009); (2) a double-decker trap (McCullough et al. Reference McCullough, Siegert, Poland, Pierce and Ahn2011; Poland et al. Reference Poland, McCullough and Anulewicz2011; Poland and McCullough Reference Poland and McCullough2014); and (3) a multiple-funnel trap (Francese et al. Reference Francese, Fraser, Lance and Mastro2011, Reference Francese, Rietz, Crook, Fraser, Lance and Mastro2013a, Reference Francese, Rietz and Mastro2013b). Trap colour is clearly important in terms of eliciting trap captures, with green and purple tending to capture the highest number of beetles (Francese et al. Reference Francese, Mastro, Oliver, Lance, Youssef and Lavallee2005, Reference Francese, Oliver, Fraser, Lance, Youssef and Sawyer2008, Reference Francese, Crook, Fraser, Lance, Sawyer and Mastro2010a, Reference Francese, Fraser, Rietz, Crook, Lance and Mastro2010b, Reference Francese, Rietz, Crook, Fraser, Lance and Mastro2013a, Reference Francese, Rietz and Mastro2013b; Crook et al. Reference Crook, Francese, Zylstra, Fraser, Sawyer and Bartels2009). Two types of host volatiles attractive to EAB have been identified and subsequently tested: bark sesquiterpenes (Crook et al. Reference Crook, Khrimian, Francese, Fraser, Poland and Sawyer2008; Crook and Mastro Reference Crook and Mastro2010) and green leaf volatiles, in particular (3Z)-hexenol (de Groot et al. Reference de Groot, Grant, Poland, Scharbach, Buchan and Nott2008; Crook and Mastro Reference Crook and Mastro2010; Grant et al. Reference Grant, Ryall, Lyons and Abou-Zaid2010, Reference Grant, Poland, Ciaramitaro, Lyons and Jones2011; Crook et al. Reference Crook, Khrimian, Cossé, Fraser and Mastro2012). A female-produced pheromone has also been discovered (Bartelt et al. Reference Bartelt, Cossé, Zilkowski and Fraser2007) and demonstrated to increase trap captures and detection rates (Silk et al. Reference Silk, Ryall, Mayo, Lemay, Grant and Crook2011; Ryall et al. Reference Ryall, Silk, Mayo, Crook, Khrimian and Cossé2012, Reference Ryall, Fidgen, Silk and Scarr2013; Silk and Ryall Reference Silk and Ryall2014). Other research has investigated incorporating visual cues into traps, demonstrating increased attraction of male EABs to traps with a dead or “model” EAB pinned onto ash leaflets (Lelito et al. Reference Lelito, Fraser, Mastro, Tumlinson and Baker2008; Domingue et al. Reference Domingue, Lelito, Fraser, Mastro, Tumlinson and Baker2013, Reference Domingue, Lakhtakia, Pulsifer, Hall, Badding and Bischof2014). Finally, the location in the tree where traps are placed is also known to be important. Higher trap captures are made in the mid canopy compared with the lower canopy, particularly for green traps (Francese et al. Reference Francese, Oliver, Fraser, Lance, Youssef and Sawyer2008, Reference Francese, Crook, Fraser, Lance, Sawyer and Mastro2010a, Reference Francese, Fraser, Rietz, Crook, Lance and Mastro2010b; Crook et al. Reference Crook, Francese, Zylstra, Fraser, Sawyer and Bartels2009; Ryall et al. Reference Ryall, Silk, Mayo, Crook, Khrimian and Cossé2012) and in sunny, exposed edges of stands compared with shaded interiors of stands (Francese et al. Reference Francese, Oliver, Fraser, Lance, Youssef and Sawyer2008; McCullough et al. Reference McCullough, Poland, Anulewicz and Cappaert2009a, Reference McCullough, Poland and Cappaert2009b; Marshall et al. Reference Marshall, Storer, Fraser and Mastro2010b). Finally, higher detection rates and trap captures have been reported when traps are deployed on either larger or dominant trees (Marshall et al. Reference Marshall, Storer, Fraser, Beachy and Mastro2009, Reference Marshall, Storer, Fraser and Mastro2010b).
Selection of a trap-lure combination for EAB surveys will depend on detection rates, costs, and ease of trap installation and maintenance, among other factors. The results of studies on detection rates of various trap-lure options have been complex, often contradictory and difficult to compare directly, with no one combination consistently out-performing all other options (e.g., see results of Marshall et al. Reference Marshall, Storer, Fraser, Beachy and Mastro2009, Reference Marshall, Storer, Fraser and Mastro2010b, Reference Marshall, Smith, Mech and Storer2013; McCullough et al. Reference McCullough, Siegert, Poland, Pierce and Ahn2011; Poland et al. Reference Poland, McCullough and Anulewicz2011; Fierke et al. Reference Fierke, Whitmore, Foelker, Vandenberg and Carlson2013; Mercader et al. Reference Mercader, McCullough and Bedford2013; Francese et al. Reference Francese, Rietz, Crook, Fraser, Lance and Mastro2013a; Poland and McCullough Reference Poland and McCullough2014). Most studies have assumed that higher trap captures will translate into higher detection rates when deployed in low-density sites. This may not be true. Indeed, very few studies have provided detection rates per se. Interactions between trap colour, lure combination, trap placement within and among trees, ash host tree density, and varying EAB population density among sites could all be influencing mean trap captures and detection rates.
At present, purple and green canopy prism traps (variously baited) are widely used in operational detection and monitoring surveys, in part because they are simple to install. However, prism traps are sticky, messy to handle, and disposed of after one season. Double decker traps, a variation of the canopy prism trap that is mounted on a fixed pole, may provide higher detection rates in low-density populations (McCullough et al. Reference McCullough, Siegert, Poland, Pierce and Ahn2011; Poland et al. Reference Poland, McCullough and Anulewicz2011; Poland and McCullough Reference Poland and McCullough2014). However, double decker traps use twice the number of prism traps and lures, therefore managers must decide if they want to invest more resources at fewer sites with a greater probability of detection or sample at a greater number of sites but with a lower probability of detection. Multiple funnel traps are a non-sticky and reuseable option to replace prism traps, but they are more expensive to purchase, more difficult to install because of their greater size and weight, and must be stored in the off-season.
Further research is required relating to all trap types on a number of topics including: quantifying timing of initial detection with respect to the duration of infestation, determining false-negative rates of traps, determining the effective trapping radius of various trap-lure combinations, relating trap captures to infestation densities, determining cost/benefits of the different options, and further improving our understanding of host and mate attraction in EAB. Finally, regardless of trap type, the capture of adults on baited traps does not indicate which trees are infested, or to what extent. Capture of an EAB adult on a trap should trigger delimitation surveys, using a variety of methods (traps, visual surveys, branch sampling, girdled trees) to determine the spatial extent of the infestation.
Detection using Cerceris fumipennis
Another potential option that could be implemented into detection surveys for EAB is to monitor predatory wasps that hunt specifically for buprestid beetles. “Biosurveillance” by the buprestid-hunting wasp, C. fumipennis Say (Hymenoptera: Crabronidae), has been investigated in recent research (Careless et al. Reference Careless, Marshall, Gill, Appleton, Favrin and Kimoto2009; Reference Careless, Marshall and Gill2014; Rutledge et al. Reference Rutledge, Fierke, Careless and Worthley2013; Swink et al. Reference Swink, Paiero and Nalepa2013). Beetle prey collected by female wasps can be monitored as the females return to their nest; suspected EAB adults can be taken from the wasp for identification. Indeed, the first detection of EAB in Connecticut was achieved using this method (Rutledge et al. Reference Rutledge, Fierke, Careless and Worthley2013). This wasp collects a high diversity of buprestid species, is geographically distributed across eastern North America, and monitoring of its populations could be incorporated into citizen science programmes. However, flight periods of the wasp only overlap with EAB for a short duration, and use of this method requires finding and time-consuming monitoring of nest colonies.
Remote sensing studies
Remote sensing is the collecting of imagery or other information from a distance, using sensors located on airplanes or satellites to collect data on patterns of energy being reflected from the earth. Research has investigated use of this approach to characterise the distribution of urban ash trees (Souci et al. Reference Souci, Hanou and Puchalski2009), information that is important when developing EAB surveys. Researchers have also attempted to use hyperspectral remote sensing technologies to map ash decline associated with EAB infestation (Pontius et al. Reference Pontius, Martin, Plourde and Hallett2008; Souci et al. Reference Souci, Hanou and Puchalski2009; Zhang et al. Reference Zhang, Hu and Robinson2014). While some studies were able to accurately predict ash decline, it was not specific to EAB and could be an indicator of any number of stressors. In addition, by the time ash decline was detectable, signs and symptoms of EAB were already evident, indicative that moderate to high populations were already present (Pontius et al. Reference Pontius, Martin, Plourde and Hallett2008) and thus limiting the value of this approach for early detection. Moreover, this technology is expensive, not specific to EAB infestation, and not readily available to forest managers.
Modelling spatial distribution of infestations at the landscape scale
Development of efficient sampling plans for detection or delimitation surveys requires knowledge of the spatial distribution of infestations across a landscape, including whether the infestation is aggregated or uniformly spread across the landscape, what proportion of trees are infested, and at what density (Leather and Watt Reference Leather and Watt2005). Several studies have attempted to quantify the spatial distribution of EAB across the landscape. Mercader et al. (Reference Mercader, Siegert, Liebhold and McCullough2009) and Fierke et al. (Reference Fierke, Whitmore, Foelker, Vandenberg and Carlson2013) found very clumped or aggregated patterns of infestation, which greatly increases the difficulty of early detection across large spatial scales. Prasad et al. (Reference Prasad, Iverson, Peters, Bossenbroek, Matthews and Sydnor2010) reported a higher risk of infestation in areas close to known EAB infestations, as well as near higher human populations, closer to roads, and in areas with a greater density of roads. Next, Mercader et al. (Reference Mercader, Siegert, Liebhold and McCullough2011) determined that both the distribution of the ash resource and female dispersal behaviour influenced the radius of infestation over time, which affected the probability of detection. The probability of detection also increased with time since infestation and the number of trees sampled, but decreased with distance from infestation (Mercader et al. Reference Mercader, Siegert and McCullough2012). Furthermore, they demonstrated that very significant increases in the efficiency of a detection tool are necessary to improve detection rates at very low densities. These studies highlight the extreme difficulty in detection of incipient outbreaks, due to the large sample areas, low EAB densities, aggregated populations, and low detection probabilities of all current sampling methods.
Finally, the information on the spatial distribution patterns of EAB infestation can also be used in the development of delimitation programmes that can be conducted using a variety of methods (e.g., McCullough and Mercader Reference McCullough and Mercader2012; Fierke et al. Reference Fierke, Whitmore, Foelker, Vandenberg and Carlson2013; Siegert et al. Reference Siegert, McCullough, Liebhold and Telewski2014). However, specific recommendations regarding delimitation protocols are currently unavailable, in terms of specific grid size and number of trees to sample or traps to deploy per grid point.
Conclusions
Considerable progress has been made in the development of tools and techniques for detection, delimitation, and monitoring of EAB since the insect was discovered in North America (Table 1). Despite the apparent shortcomings, visual surveys are still being conducted, often to identify areas of concern for follow-up sampling. Visual detection by the general public or landowners is also often the way new infestations are first reported, thus triggering follow-up sampling efforts. The study of within-tree distribution of larval galleries has enabled the development of sub-sampling techniques that can provide a known probability of detection. This has aided the development of a branch sampling protocol for use on asymptomatic open-grown urban ash trees that has been adopted across North America. However, further details on which trees are initially infested and why is required to assist in developing better surveys. Girdled trap trees may best be deployed in delimitation surveys following initial detection of EAB infestation (e.g., McCullough and Mercader Reference McCullough and Mercader2012), but this method requires the availability of appropriate ash trees and then destructive sampling of girdled trees. Extensive research has been conducted towards developing a trap-lure combination for early detection of EAB. Two of the best current options are purple and green sticky traps, baited with bark sesquiterpenes and green leaf volatiles, respectively. Green sticky traps baited with (3Z)-hexenol are currently used in surveys in Canada. Addition of synthetic lactone pheromone can further increase trap captures and detection rates on green traps baited with green leaf volatiles. Double-decker traps and reuseable plastic funnel traps may provide high detection rates than traditional canopy traps, particularly in low-density populations, but at a higher cost per trap. Regardless, all styles of baited traps still may not detect infestations in the earliest stages and more research into the key compounds eliciting primary attraction in EAB is still required. Trapping surveys are typically conducted at large spatial scales by federal agencies in both Canada and the United States of America. However, the resolution of these trapping surveys and their location may be inadequate for the needs of local agencies, such as counties or municipalities. To make up this shortfall, supplementary surveys are now also being conducted at these smaller scales to provide further detail on the location and intensity of infestation, often using baited traps and girdled trap trees. Biosurveillance by the buprestid-hunting wasp, C. fumipennis, offers another tool that can be incorporated into early detection surveys. Finally, remote sensing may be of value to stakeholders or landowners, such as federal, state or provincial agencies, to identify areas of concern at large spatial scales.
All sampling methods currently in use have their own shortcomings and no sampling method has been subjected to a cost-benefit analysis. This information is urgently needed in order to enable informed decision making and to optimise how resources are invested. Despite the lack of formal analysis, it should be apparent that no one sampling option is the most suitable for all situations. The highly aggregated distribution of infested trees and a low proportion of trees initially infested combine to make early detection extremely difficult and costly. Overall, surveys for EAB must involve multiple approaches. Forest managers must consider their objectives and resources in determining which detection and monitoring options to use. Lessons learned through working with municipalities are that infestations are often only found after being present for several years and are larger than originally thought. Early detection and quantification of density of infestations can assist forest managers in determining which response strategies to use, as well as when and where to use them. As well as an ongoing need for further improvements to early detection rates, future research needs to address improved methods to quantify density, as well as develop action thresholds for management responses.
Acknowledgements
The author acknowledges the contributions made by two anonymous reviewers in improving the quality of this review. The author also appreciates assistance from Jeff Fidgen, Jon Sweeney, and Chris MacQuarrie (Natural Resources Canada) for reviewing earlier drafts of this manuscript.