

Introduction
Blood lactate (BL) has long been used as a measure of the metabolic activity of skeletal muscle and to quantify the relative intensity of exercise. The production of lactate from pyruvate, its role as a hydrogen acceptor and its efflux from skeletal muscle to the blood have established BL as a primary indicator of the rate of anaerobic glycolysisReference Juel1–Reference Ivy, Chi, Hintz, Sherman, Hellendall and Lowry3. As the rate of glycolysis increases during incremental exercise, so does the efflux of lactate from the working muscle to the blood. Specific changes in BL, i.e. lactate threshold, can be used to identify the relative intensity at which oxygen consumption and the electron transport system cannot adequately supply the adenosine 5′-triphosphate (ATP) demands of the working muscleReference Coggan, Kohrt, Spina, Kirwan, Bier and Holloszy4–Reference Deuticke, Beyer and Forst6.
It has been well established that BL is transported in the red blood cells (RBC) as well as in the plasmaReference Poole and Halestrap7–Reference Buono and Yeager9. Most research has shown the plasma/RBC ratio at rest to be approximately 0.35, indicating that the plasma concentration is twice that of the RBCReference Buono and Yeager9–Reference Smith, Skelton, Kremer, Pascoe and Gladden13. Researchers have found conflicting changes in this ratio during exercise. Juel et al. Reference Juel, Bangsbo, Graham and Saltin11 measured the plasma/RBC ratio during isolated exhaustive knee extension exercise and found that it dropped significantly. Others, employing incremental exercise protocols to exhaustion on a stationary cycle, found no changes in the ratioReference Buono and Yeager9–Reference Smith, Skelton, Kremer, Pascoe and Gladden13. Interestingly, those studies did find significant increases in the lactate concentration ([La− ]) gradient between the plasma and the RBC; however, this increased gradient left the plasma/RBC ratio unaffected. The fact that BL is transported in both the plasma and the RBC brings into question its measurement techniques and how BL is reported in the literature. Research has compared [BL] obtained from centrifuged plasma samples, whole blood (WB) and lysed blood. Significantly higher plasma values have been consistently reportedReference Harris and Dudley14–Reference Hildebrand, Lormes, Emmert, Liu, Lehmann and Steinacker16.
As in humans, BL in the equine athlete has been used as a metabolic measure of exercise intensityReference Guhl, Lindner and von Wittke17–Reference Von Wittke, Lindner, Deegen and Sommer25. During incremental exercise, BL in the horse mimics the pattern of increase found in humans, including an established lactate thresholdReference Guhl, Lindner and von Wittke17–Reference Von Wittke, Lindner, Deegen and Sommer25. The distribution of BL between the plasma and the RBC has also been established in the horseReference Rainger, Evans, Hodgson and Rose26, Reference Vaihkonen, Hyyppa and Reeta Poso27. However, the variability found between subjects in the plasma/RBC ratio is much greater in the horse than that in its human counterpartsReference Rainger, Evans, Hodgson and Rose26, Reference Vaihkonen, Hyyppa and Reeta Poso27. The large splenic reserve of the horse and its contribution during exercise to oxygen transport and therefore muscle metabolism may account for this variabilityReference Rainger, Evans, Hodgson and Rose26, Reference Vaihkonen, Hyyppa and Reeta Poso27.
Sample collection for BL in human subjects during exercise is typically performed through catheterization of either an antecubital vein or a finger stick. No significant differences in [BL] have been found between these sampling sitesReference Williams, Armstrong and Kirby15. With exercise studies involving the horse, blood samples are typically drawn from the jugular vein. The jugular vein in the horse provides an easy site for catheterization and collection of blood samples, particularly during treadmill exercise. However, sampling from the jugular vein may provide only a limited assessment of BL. Returning blood to the heart primarily from the brain, jugular samples may not accurately represent total peripheral circulation. [BL] is governed not only by the efflux of lactate from working muscles, but also by its transport across the cell membranes of both the myocardium and the brainReference Drake28, Reference Dienel and Hertz29. Exactly to what extent these two organs influence [BL] at rest and during exercise is a question that remains unanswered.
Given the interpretive weight assigned to BL values in equine exercise studies for the quantification of the metabolic response to changes in intensity, it is important to ensure the validity of collection methods. Past studies of horses have presented results from a variety of study designs. For example, Thornton et al. Reference Thornton, Essen-Gustavsson, Lindholm, McMiken, Persson, Snow, Persson and Rose30 used an incremental exercise test and measured blood [La− ] in arterial and mixed venous blood samples using the enzymatic perchloric acid method. In a later study, Miller-Graber et al. Reference Miller-Graber, Lawrence, Foreman, Smith, Bump and Kurcz31 made comparisons of the [La− ] obtained from carotid arterial, jugular vein and pulmonary arterial blood samples. However, after a walking warm-up, they only utilized one submaximal exercise intensity of 4.5 m s− 1 on an 11% grade. Marlin et al. Reference Marlin, Harris, Snow, Persson, Lindholm and Jeffcott32 utilized an incremental exercise test to examine the effects of high intensity. They did compare concentrations measured in WB versus plasma; however, they only utilized jugular blood samples. Poso et al. Reference Poso, Lampinen and Rasanen33 examined the distribution of lactate between the RBC and the plasma after exercise. However, their well-designed field study utilized samples collected from 17 Standardbred racehorses immediately and 15 min after a race and in six horses after a non-standardized training session. Ferrante et al. Reference Ferrante, Taylor, Wilson and Kronfeld34 compared plasma, WB and red blood cell [La− ] in Arabian horses subjected to a repeated sprint test. Another experiment from the same laboratory (Taylor et al. Reference Taylor, Ferrante, Wilson and Kronfeld35) used Arabian horses and the same experimental design. Their experiment was designed to examine lactate as part of the calculation of strong ion difference in plasma samples collected from arterial and venous blood. None have systematically and simultaneously compared the method of analysis (i.e. [La− ] measured in whole unlysed blood versus samples where the RBC are lysed versus plasma) within arterial versus jugular vein versus mixed central venous blood. Therefore, the purpose of the present study was twofold. First, to determine whether there is a difference in [BL] when samples are drawn from different sites, and secondly to determine differences in [BL] when the [La− ] in the collected samples is measured using three different techniques that utilized different analytical substrates (i.e. WB lactate where the RBC are unlysed versus total blood (TB) lactate where the cells are lysed versus plasma).
Materials and methods
Six clinically normal adult (two Thoroughbreds, three Standardbreds and one Quarter Horse) mares weighing between 435 and 560 kg were used in the study. A subcutaneous transposition of the left carotid artery of each mare was surgically performed from 6 to 12 months before the onset of the present study. Mares were housed individually in box stalls to prevent uncontrolled exercise, were accustomed to running on a high-speed treadmill and were otherwise unfit. Each mare was fed approximately 6 kg day− 1 of alfalfa and grass hay and approximately 3 kg day− 1 of corn (split into two feedings). Water was provided ad libitum. The University Institutional Animal Care Review Board approved all methods and procedures used in the present experiment.
Graded exercise test
This test was designed to measure blood and plasma lactate in samples collected during incremental exercise. Prior to the test the horses were weighed, and three catheters were placed using sterile techniques under local anaesthesia. One catheter was placed in the right jugular vein (Angiocath, 14 gauge; Becton Dickinson, Inc., Parsippany NJ, USA). The second catheter, a saline-filled arterial catheter (Intracath, 18 gauge; 12 in.; Deseret, Sandy, UT, USA), was inserted into the relocated carotid artery. The third catheter was an introducer catheter (7 F; Argon Medical, Athens, TX, USA) that was placed in the left jugular vein. A polyethylene tube (#240; Becton Dickinson) was passed through this introducer catheter and positioned into the pulmonary artery for the collection of central venous blood samples.
The horses were then walked onto the treadmill where they stood quietly for approximately 5 min. A pre-exercise blood sample (14 ml) was obtained at the end of this equilibrium period. During the incremental exercise tests, the animals ran on a high-speed horse treadmill (Sato I, Sweden) at a fixed 6% grade. The tests started at an initial speed of 3 m s− 1 for 1 min. Speed was then increased by 1 m s− 1 every 60 s until the horses completed the final 10 m s− 1 step. Jugular vein, pulmonary arterial and carotid arterial blood samples (14 ml) were collected at the end of the equilibration period and during the last 10 s of each speed increment of the test.
Blood chemistry
Blood samples were placed in two pre-chilled tubes containing EDTA (Vacutainer; Becton Dickinson, Inc., Franklin Lakes, NJ) and were immediately placed on ice. One tube was used for the measurement of lactate in plasma and one for the methods using blood. [La− ] was measured in duplicate using a lactate analyser (Model 23A; Yellow Springs Instruments, Yellow Springs, OH, USA). The coefficient of variability for [La− ] was 1.2%. Samples were processed in three different ways using different ‘analytical substrates’: WB [La− ], where there were no manipulations; TB [La− ], where a lysing agent (polyethylene glycol octylphenol ether 38–44%, 1,2-propylene glycol 58–64%; Catalog #1515; Yellow Springs Instruments) was used to release the lactate contained in the RBC; and plasma [La− ]. The nomenclature (‘WB’ and ‘TB’) for the methods used in the present experiment follows the definitions used in the manual for the YSI lactate analyzer. For the measurement of plasma [La− ], the blood was centrifuged in a refrigerated centrifuge (TJA-6; Beckman-Coulter; Fullerton, CA, USA) at a rate of 1500 × g and at a temperature of 4°C for a period of 10 min.
Calculations and statistical analysis
[La− ] measured at each step of the graded exercise test was plotted versus treadmill speed to determine the velocity to produce [La− ] of 4 mmol l− 1 (VLA4) and 10 mmol l− 1 (VLA10). A three-way ANOVA was used to analyse data for the main effects. Where appropriate, post hoc comparisons used the Holm–Sidak method or the Student Neuman–Keuls method to separate means. All analyses were performed with a priori level of statistical significance set at P < 0.05.
Results
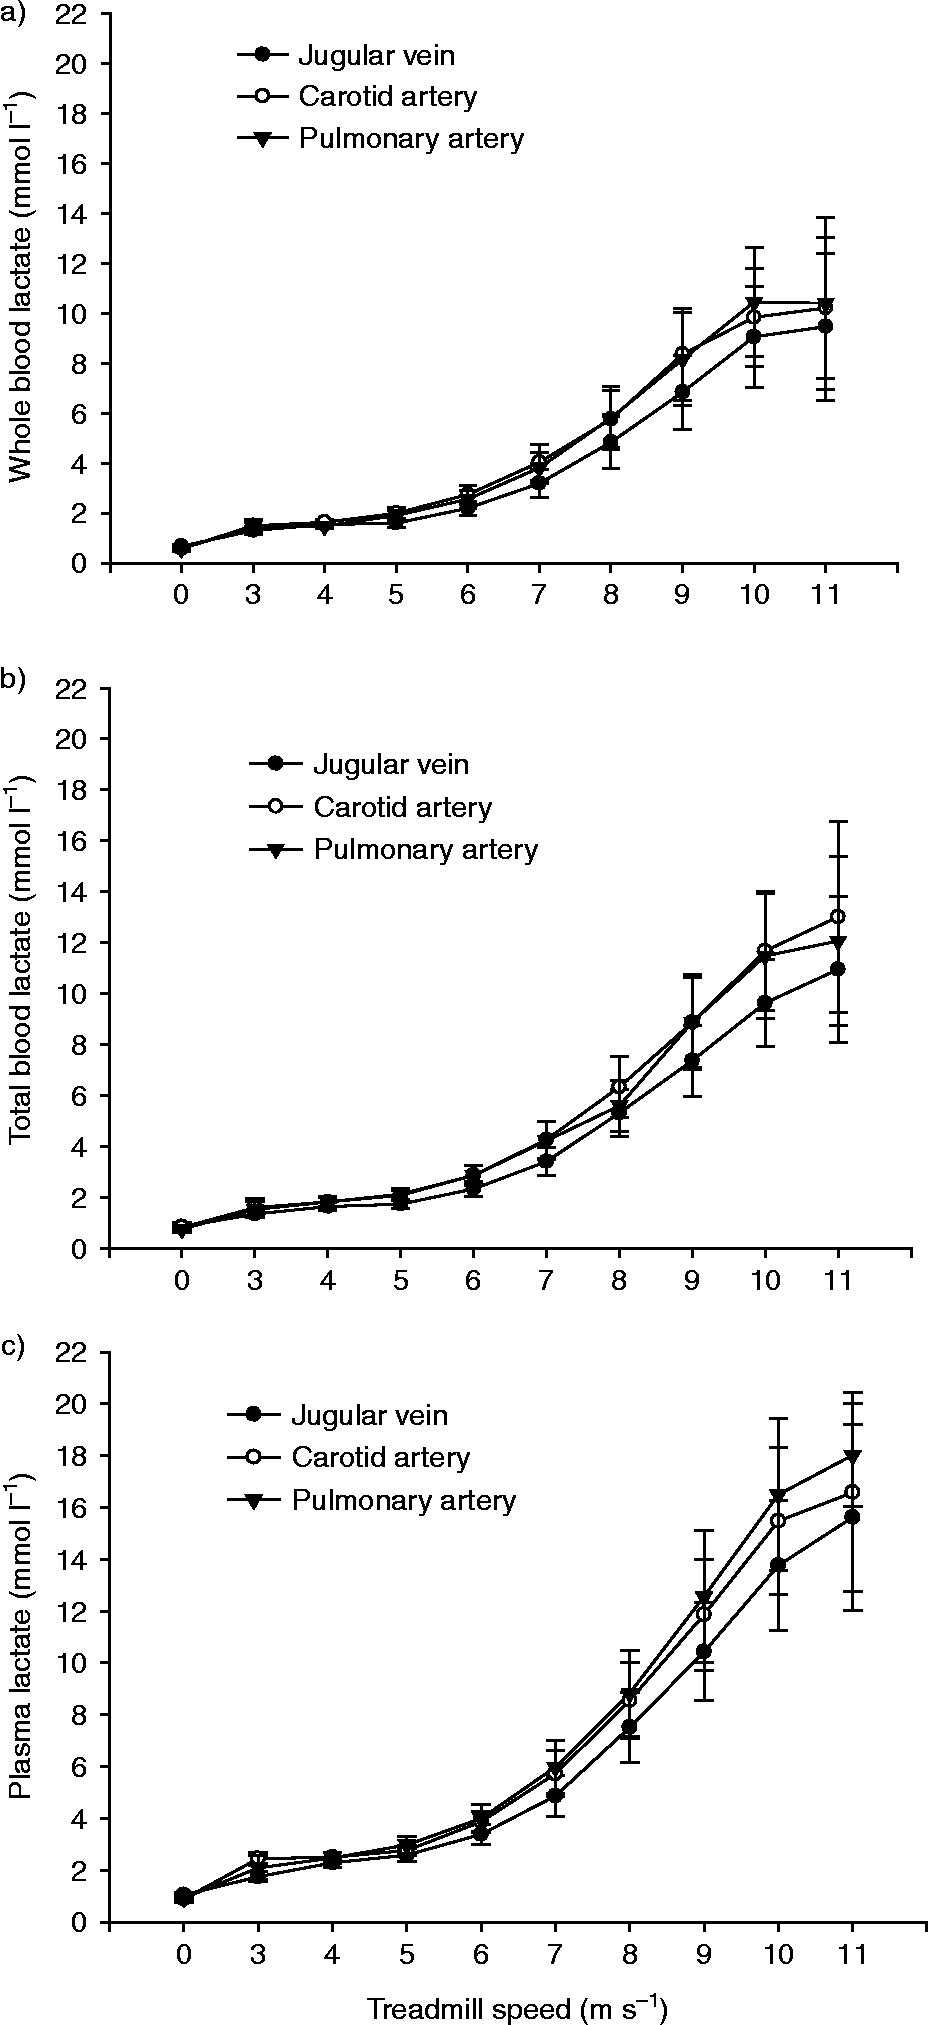
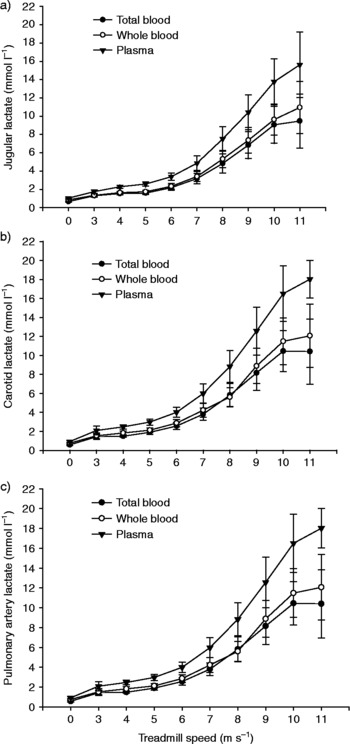
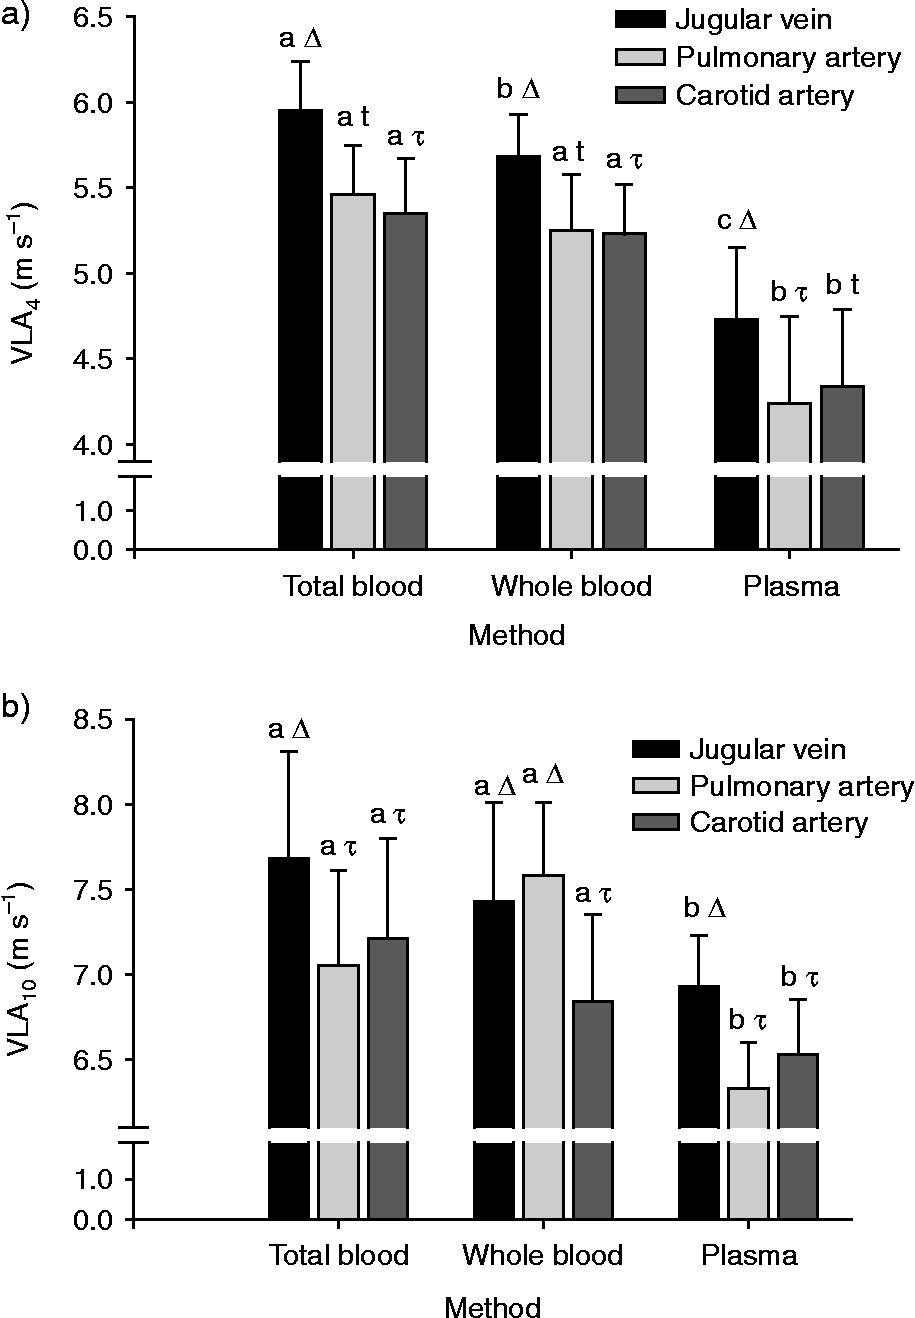
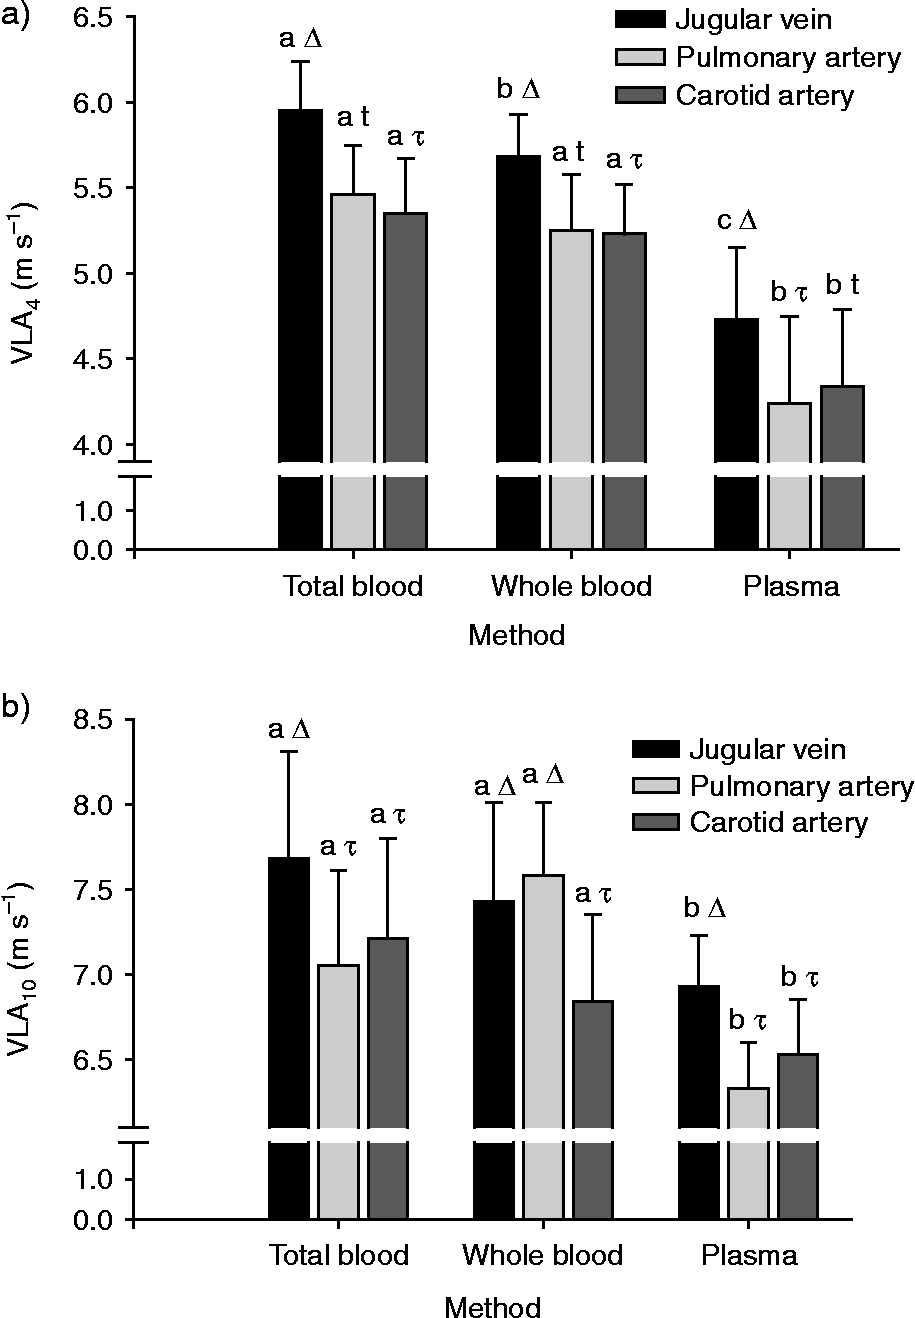
Results are expressed in a series of graphs as means ± standard error of the mean (SE). Figures 1 and 2 are provided primarily for illustrative, but not for statistical, purposes, and they present three separate graphs, one for each method (i.e. ‘analytical substrate’) versus treadmill speed: WB that was unlysed (Fig. 1a), TB that was lysed (Fig. 1b) and plasma (Fig. 1c), with plots of the three sample sites depicted within each graph. The second set of figures in Fig. 2 presents the data arranged by sample site versus treadmill speed: jugular vein (Fig. 2a); carotid artery (Fig. 2b) and pulmonary artery (Fig. 2c), with the data plots representing the response within a site for each method. There was a significant effect of exercise intensity on [La− ] for all three methods (P < 0.001), with all means during exercise significantly greater than the resting mean. Interestingly, there were differences due to the method (P < 0.001) and sample site (P = 0.043). There was also an interaction between the exercise and method (P < 0.05). Comparisons of least-squared means (LSM) within site revealed that there was a difference (P < 0.05) between jugular vein and carotid artery and between carotid and pulmonary artery. There was no difference (P>0.05) between jugular vein and pulmonary artery. Comparisons of LSM within method demonstrated that there was a difference (P < 0.05) between WB and TB and between TB and plasma, but there was no difference (P>0.05) between WB and plasma. The functional significance of the effects of sample site and/or method was examined by calculating the velocity to produce [La− ] of 4 and 10 mmol l− 1. Further analysis of the data demonstrates that both the method and the sample site influenced (P < 0.05) both the VLA4 (Fig. 3a) and the VLA10 (Fig. 3b).
Lactate response curves (mean ± SE) depicting plots for each site (jugular vein, carotid and pulmonary arteries) versus treadmill velocity within each method: whole blood (a), total blood (b) and plasma (c)

Lactate response curves (mean ± SE) depicting plots for each method (whole blood, total blood and plasma) versus treadmill velocity within each site: jugular vein (a), carotid (b) and pulmonary arteries (c)

The velocity to produce a lactate concentration of 4 mmol l− 1 (VLA4) (a) and 10 mmol l− 1 (VLA10) (b). Means within a site with a different symbol (Δ or τ) are different (P < 0.05). Means for a site with a different letter (a, b or c) are different (P < 0.05)
Discussion
The lactate response to incremental exercise as presented in Figs 1 and 2 depicts the normal curvilinear response to increasing exercise intensity in horsesReference Guhl, Lindner and von Wittke17–Reference Lindner, Mosen, Kissenbeck, Fuhrmann and Sallmann25. Graphs are presented first by site and then by method primarily to allow for a visualization of the differences due to those main experimental treatment classifications. However, the complex interactions preclude applying a series of indicators of significance. Nevertheless, as expected, the response to exercise was significant.
Another major observation in the present study was that there was a substantial difference in [La− ] due to sample site, with greater concentrations in carotid blood than in both the jugular vein and the pulmonary artery. There was no difference between the jugular vein and the pulmonary artery. The lower [lactate] values in blood returning to the heart from the brain (jugular), versus blood pumped to the brain (carotid), suggest that the brain uses lactate as fuel. These results support recent findings in exercising humans that demonstrate that lactate is a major substrate used to fuel the brain metabolismReference Drake28, Reference Dienel and Hertz29, Reference Ide, Schmalbruch, Quistorff, Horn and Secher36–Reference Van Hall, Stromstad, Rasmussen, Jans, Zaar and Gam40. The results are also similar to those of Taylor et al. Reference Taylor, Ferrante, Wilson and Kronfeld35, who documented differences in plasma [La− ] in samples collected from the carotid artery compared with mixed venous blood. In contrast, the results from the present study differ from a study by Miller-Graber et al. Reference Miller-Graber, Lawrence, Foreman, Smith, Bump and Kurcz31 that found no difference in [La− ] obtained from carotid arterial, jugular vein and pulmonary arterial blood samples. However, the difference in the results may be attributed to differing exercise protocols, as in that study they utilized only one submaximal exercise intensity of 4.5 m s− 1 on an 11% grade. The results from the present study also differ from those of Thornton et al. (1983)Reference Thornton, Essen-Gustavsson, Lindholm, McMiken, Persson, Snow, Persson and Rose30, who observed no difference in blood [La− ] in samples collected simultaneously from the carotid artery and pulmonary artery during an incremental exercise test. The only explanation that we can see for the difference in observations may be the assay methods, as their study utilized the enzymatic perchloric acid method on samples that were frozen and stored and the present study utilized samples that were analysed immediately on the YSI lactate analyzer.
Interestingly, recent studies of brain-injured humans have demonstrated increased survival rates in those individuals with the greater ability to utilize lactate as a fuel for brain metabolismReference Drake28, Reference Dienel and Hertz29, Reference Ide, Schmalbruch, Quistorff, Horn and Secher36–Reference Van Hall, Stromstad, Rasmussen, Jans, Zaar and Gam40. During high-intensity exercise, the horse, like the human, relies heavily on the glycolytic pathway for the production of ATP. The associated increase in [lactate] is handled by its following the [gradient] to the blood and further on to other tissues such as non-working muscle, the liver and the brainReference Drake28, Reference Dienel and Hertz29, Reference Ide, Schmalbruch, Quistorff, Horn and Secher36–Reference Van Hall, Stromstad, Rasmussen, Jans, Zaar and Gam40. These tissues are able to utilize the lactate to meet their own energy demands. As with other tissues, the brain's ability to utilize lactate, particularly during exercise, undoubtedly plays a role in sparing blood glucose needed by the working muscle.
The second major finding of the present study was that the method (i.e. analytical substrate) of measurement had a significant effect on [La− ] in blood sampled from horses. This observation has been made using blood obtained from other speciesReference Foxdal, Sjodin, Rudstam, Ostman, Ostman and Hedenstierna12–Reference Hildebrand, Lormes, Emmert, Liu, Lehmann and Steinacker16, Reference Kruse and Carlson41, Reference Nedeljkovic, Mirkov, Pazin and Jaric42. These observations are similar to those reported for horsesReference Poso, Lampinen and Rasanen33, Reference Ferrante, Taylor, Wilson and Kronfeld34. The present study adds to the literature, as the study by Poso et al. Reference Poso, Lampinen and Rasanen33 was a field study that utilized samples collected from 17 Standardbred racehorses immediately and 15 min after a race and in six horses after a non-standardized training session, and Ferrante et al. Reference Ferrante, Taylor, Wilson and Kronfeld34 compared plasma, WB and RBC [La− ] in Arabian horses subjected to a repeated sprint test. Therefore, the present study adds additional insight and new information about the effects of incremental exercise.
In the present study, the concentration of lactate in WB was consistently lower than the concentration of lactate in plasma, which is similar to results reported for humans and horsesReference Thornton, Essen-Gustavsson, Lindholm, McMiken, Persson, Snow, Persson and Rose30–Reference Taylor, Ferrante, Wilson and Kronfeld35, Reference Nedeljkovic, Mirkov, Pazin and Jaric42. This can be explained by the fact that some of the total lactate within the sample is sequestered within the RBC. Kruse and CarlsonReference Kruse and Carlson41 explained that the volume used in various assays reflects the volume of WB, but not just the volume of plasma. This results in a falsely lower concentration, and the underestimation is accentuated by changes in haematocrit such as that observed in the horse during exercise. In the present study, TB lactate was lower than plasma lactate. This can be explained by the fact that when a blood sample is haemolysed, the lactate contained in the plasma is ‘diluted’ by the volume of intracellular fluid from the red blood cell. This causes the TB [La− ] to be lower than the concentration measured in the plasma. An additional effect would be induced by the addition of RBC from the splenic reserve. Furthermore, while the splenic reserve is one factor, the lactate transporters and the effect of the duration of exercise and its intensity may have also played a key role in the distribution between the RBC and the plasmaReference Vaihkonen, Hyyppa and Reeta Poso27.
The third major finding of the present study was that both the method (i.e. analytical substrate) and the sample site influenced the VLA4 and the VLA10. This has an implication for those using the lactate–speed relationship to assess performanceReference Trilk, Lindner, Greene, Alberghina and Wickler22–Reference Von Wittke, Lindner, Deegen and Sommer25. While the VLA4 and the VLA10 utilize the lactate–speed relationship as a predictor of performance, each marker gives a different view of lactate tolerance, one associated with endurance capacity and the other associated with anaerobic power.
The VLA4 occurs at around 80–85% of maximal aerobic capacity and is a point where there is a rapid onset of BL accumulation (OBLA)Reference Guhl, Lindner and von Wittke17–Reference Von Wittke, Lindner, Deegen and Sommer25, Reference Bentley, Newell and Bishop43–Reference Bosquet, Léger and Legros46. In some sources, the OBLA is referred as anaerobic thresholdReference Bentley, Newell and Bishop43–Reference Bosquet, Léger and Legros46. However, this should not be confused with the lactate threshold which, by definition, is the point where [La− ] is 1 mmol l− 1 greater than the concentration measured at restReference Bentley, Newell and Bishop43–Reference Bosquet, Léger and Legros46. The latter is the point where lactate production exceeds lactate utilization. The VLA4 occurs at an approximate point where lactate accumulation increases rapidly as aerobic metabolic pathways begin to approach their maximal levelsReference Bentley, Newell and Bishop43–Reference Bosquet, Léger and Legros46. Substantial changes in blood pH also occur at this point in exercise and in humans, the subsequent hyperventilatory response serves to ‘blow off’ carbon dioxide in an effort to use respiratory mechanisms to correct the metabolic acidosis associated with increasing exercise intensityReference Bentley, Newell and Bishop43–Reference Bosquet, Léger and Legros46. This ‘ventilatory threshold’ is something that does not occur in horses, as most studies indicate that the horse does not hyperventilate during exertion. However, despite those species-related differences in respiration, human and equine studies suggest that the VLA4 is a better marker of endurance capacity rather than anaerobic powerReference Bentley, Newell and Bishop43–Reference Bosquet, Léger and Legros46. The basis for this classification of the VLA4 as a marker of endurance performance is the observation that endurance athletes appear to selectively run at a speed at or near to the VLA4Reference Bentley, Newell and Bishop43–Reference Bosquet, Léger and Legros46.
Those observations regarding the VLA4 have led some equine researchers to suggest that the VLA10 is a more appropriate marker of anaerobic powerReference Trilk, Lindner, Greene, Alberghina and Wickler22, Reference Von Wittke, Lindner, Deegen and Sommer25. Anaerobic power is very closely related to the ability to perform greater levels of ballistic or sprint-type work. To that end, the rationale for the VLA10 is that the ability to tolerate a greater [La− ] means one is tolerating a greater amount of anaerobic work. Thus, a greater [La− ] is viewed as a positive marker of performance when a horse is competing in a race requiring high speed and anaerobic power. Reliance on a single-point measurement is not ideal, but it is utilized to assess performance in equine athletes because tests to measure anaerobic power are difficult or impossible to perform in horses. In humans, several tests have been designed to assess anaerobic power, including the Margaria staircase test, the sergeant jump test, the Wingate test and the running-based anaerobic sprint test (RAST), to name a fewReference Zagatto, Beck and Gobatto47, Reference Popadic Gacesa, Barak and Grujic48. The first two tests cannot be adapted to horses for obvious reasons. The Wingate test requires equipment not utilized in horses and is more appropriate for cyclists and athletes in sports requiring ballistic powerReference Zagatto, Beck and Gobatto47, Reference Popadic Gacesa, Barak and Grujic48. The RAST is a test that is used to assess anaerobic power in human runnersReference Zagatto, Beck and Gobatto47, Reference Popadic Gacesa, Barak and Grujic48. It is similar to the Wingate test in that it is a test of anaerobic power that gives coaches measurements associated with power as well as a fatigue indexReference Zagatto, Beck and Gobatto47, Reference Popadic Gacesa, Barak and Grujic48. Equine researchers have utilized the VLA4 and the VLA10 as well as more recent tests such as field tests designed to measure the lactate steady stateReference Lindner18. The VLA4 and the VLA10 are the calculated parameters that are widely reported, and the present study demonstrates that both of these markers of performance are affected by the sample method and the site. This information should serve to guide researchers making comparisons between studies that may have featured variations in methodology. The information presented in the present paper also has clinical significance, as [La− ] is utilized as a tool in the physiological approach to assess alterations in acid–base balanceReference Constable49. The data also have implications for researchers and clinicians using hand-held lactate analysers, as some of those instruments utilize WB and some use plasma.
Acknowledgements
Support was provided in part by the Ohio Thoroughbred and Standardbred Research Fund and the New Jersey State Initiative on Equine and the New Jersey Agricultural Experiment Station. None of the authors of the present paper has a financial or personal relationship with other people or organizations that could inappropriately influence or bias the content of the paper.