

In these four addresses, I have been assessing the causes and some consequences of Britain's transition to mass education at both secondary and tertiary levels since the Second World War. Against the run of the literature, which has focused on elite, expert and activist discourses (politicians, psychological and sociological critics of selection, economists, teachers, campaigning groups), I have attributed the rush to mass education to the rising aspiration among the majority of parents and children for more and better education that was apparent across the developed (and now the developing) world throughout the second half of the twentieth century. In Britain's specifically democratic and welfarist context, the demand for a high-quality education for all, that is, a democratic discourse of education, parallel to the demand for high-quality health care, overwhelmed a relatively new and fragile meritocratic discourse which focused energies and resources on an elite. To put it another way, mass demand elicited mass supply. In plumbing the consequences of mass education, I have also tried to give voice to parents and children, making use of economists’ and sociologists’ data to track their behaviours and experiences whether or not these were articulated in popular discourse. Thus, in my third address I placed, alongside the limited evidence we have about ordinary citizens’ aspirations for social mobility, the vast body of sometimes inscrutable data that testifies to the impact that educational opportunity had – or did not have – on the realities of social mobility. In this final address, I turn to the impact of mass participation on the content of education – what in the technical literature is called ‘subject choice’. Just as access to education had a lot more to do with demand for it than expert discourse would suggest, so the content of education was very largely determined by shifting demand for particular subjects, probably more so in Britain than many of its comparators because of the lack of central curricular control, and the wide range of choices facing parents and children at points as early as age 13 and continuing past compulsory education to ages 16 and 18.
For this purpose, I have assembled from educational statistics data about subject uptake at O-Level and GCSE, A-Level and undergraduate degree level from the 1950s to the present, and once again I have turned to data, argument and theory supplied by the social sciences to seek to augment and interpret these statistics and to explain changes in subject choice over time. Once again, I encounter the familiar problem that each of these social-scientific disciplines is siloed in its own favoured data series and corresponding explanatory framework. Empirical studies of subject choice based on student surveys invariably find a mix of factors – interest, enjoyment, ability, earnings potential, career choice – but are relatively uninquisitive about what might generate these evaluations and how and why they change over time. Driven as they often are by the interests of guidance counsellors, they tend to conclude with homilies about the need for more information and better guidance.Footnote 1 Psychologists pin subject choice to personality type; in one famous study of the 1960s, dividing ‘clever schoolboys’ into conformist ‘convergers’ who favoured Physics and Classics and dissenting ‘divergers’ who leant towards the Arts and Biology.Footnote 2 Sociologists, especially in their stern 1970s phase, have tended to see subject choice as a myth, given the determinative role of the habitus in sorting children by gender and social class, a role they give a twist by identifying teachers as the agents who steer children into their socially specified paths.Footnote 3 Economists for their part tend to attribute subject choice to rational behaviours based on future earnings.Footnote 4 Historians, insofar as they are tempted to address subject choice at all, have their own favoured cultural and political explanations – favoured in part because anthropologists and political scientists are not competing in this field, but also because these explanations draw on the evidence and actors with which we are most comfortable; this is what causes us to tend towards elite, expert and activist explanations, for which the evidence is textual and archival. We should, of course, try to combine all of these sources and their accompanying explanatory frameworks – giving due weight to the otherwise muted majority of our fellow-citizens who speak mostly through surveys and quantitative data, however rebarbative we find those sources of evidence – and that is what I will try to do.
One further interpretive wrinkle is worth ironing out at the outset. Insofar as there is an articulated public discourse about subject choice, it has been almost entirely – again – an elite, politicians’ and policymakers’ discourse, in all parties, about the choice for science. Especially from the late 1950s, when economists and industrialists began to bear down on educational policy, the public discourse about subject choice has been dominated by the alleged insufficiency of science (or what we now call STEM) and policy has been aimed almost exclusively at remedying that insufficiency. How misleading this discourse is as a guide to actual behaviours is clear from the brute fact that there has been a nearly continuous swing away from science from the early to mid-1960s up until the last few years. This you would never guess from the public discourse, which at every step of the way is always detecting (as a way of advocating for) a swing towards science, undaunted by repeated waves of evidence to the contrary. But as a result we have a great deal more writing about why students choose the sciences than about why they do not, and choose instead other subjects in the humanities and social sciences. It is not only local patriotism, therefore, that will cause me to dwell upon the choice of other subjects – with the choice of History of course always in the back of my mind – but also the need to rectify a glaring omission in the literature.Footnote 5 As in previous addresses, I will proceed chronologically, starting with the immediate post-war period, and then identifying the distinctive features of the 1960s, a period of expansion in post-compulsory education; the 1970s and 1980s, a period of almost complete stasis; and the period since the late 1980s, a period of very rapid expansion; the last few years, since the slump of 2008, may form a distinctive period of its own, though, as we historians like to say, it is too soon to tell. As this chronology suggests, what students choose to study is closely linked to the question of who the students are studying at any given point – what the social scientists might call cohort effects.
I
Despite the impression given by C. P. Snow's ‘two cultures’ controversy at the end of the 1950s, post-compulsory education in the decade or so after the war was led by the sciences – and this was very largely a cohort effect. When the Robbins Committee looked into the matter in 1963, it found that 57 per cent of full-time undergraduate students were on science, technology and medical courses against only 43 per cent in the arts, a rough division which had remained nearly unchanged since 1938, when the balance was 55 per cent to 45 per cent, although there had been a marked swing within the science subjects away from medicine and towards pure science. If there was a ‘two cultures’ problem, it was not a higher education problem in general, but rather an Oxbridge problem, where the proportion of arts students was much higher than elsewhere – more than twice as high as at London and the larger civic institutions – and indeed the ‘two cultures’ controversy took place very largely on Oxbridge ground (another example of an elite discourse fixing determinedly on an elite).Footnote 6 But in the secondary schools and universities of the nation at large, science was king. Maths and Physics were the most popular subjects at A-Level and Chemistry had as many passes as English and History, which were the leading Arts subjects.Footnote 7 At university, the ‘Arts’ were occasionally described as ‘the most popular group of subjects’ but this conclusion was reached only by treating science, medicine and technology as separate groups.Footnote 8 In reality, Britain had one of the highest proportions of science and technology graduates in Europe.Footnote 9
Why should this have been? Britain, England especially, had then a very academically focused and selective secondary education system, and also one, though Scotland less so, that channelled pupils narrowly from exams at 16 to exams at 18 to university. It was also, in common with most European systems, a post-compulsory education dominated by boys and by traditionally male occupations.Footnote 10 For grammar school leavers at 16, for example, the single most common destination was an engineering apprenticeship.Footnote 11 After 16, schooling was closely linked to the graduate labour market and that labour market was itself led by a few overwhelmingly male professions that favoured the sciences: medicine above all, but also engineering and management.Footnote 12 Law would not be a majority graduate profession until the 1960s and accountancy not until the 1970s.Footnote 13 Accordingly, a majority of boys specialised in science at A-Level, and boys with science at A-Level were the most likely of all 18-year-olds to apply to and to be accepted at university.Footnote 14 The saving grace for the arts was teaching, which was the single largest graduate recruiter – about a third of all graduates ended up in teaching – and, although of course schools required science as well as arts teachers, in fact more trained as arts teachers, especially women. As late as 1961, 80 per cent of female arts graduates ended up as teachers.Footnote 15 Although the situation was quite other at Oxbridge – 86 per cent of Oxford undergraduates in 1950 were doing arts degrees, vs. 45 per cent nationally, the kind of thing that aroused C. P. Snow's very Oxbridge-centred ire in the two cultures controversyFootnote 16 – across the country in grammar schools, independent schools and universities the tone was set by serious young men beavering away at Maths, Physics and Chemistry.
In these circumstances, it is a little surprising that government and punditry spent so much time and effort trying to produce more scientists at all levels. But in the immediate post-war period – especially from the mid-1950s when fears of ‘relative decline’ were building – all parties converged on investment in education for economic growth, and economic growth was widely held to mean technology-fuelled industry. This line of thinking took two different forms. The earlier but persisting form, associated largely but not exclusively with socialists, was manpower planning. The Attlee government explicitly set targets for the production of graduate scientists and technologists in the name of ‘national needs’ and these targets were regularly re-set and monitored by the Committee on Scientific Manpower throughout the 1950s and into the 1960s.Footnote 17 At the end of the 1950s, a vaguer but more powerful current emerged, amongst economic theorists and politicians alike, which saw education more generally as an investment in ‘human-capital’. ‘Human-capital’ theory had the attraction to Conservatives that it did not require too much government intervention – neither strong-arming the universities nor pressurising employers – and it had the attraction to all politicians that it did not require making forecasts and setting targets which were too easily foiled by events.Footnote 18 It did require throwing money at education – which the Conservative governments of the late 1950s did – and trusting to supply and demand, and the promises of human-capital theory, that such investments would yield growth.Footnote 19 Until the end of the 1950s, this policy seemed to be working – as educational participation began to extend, first at GCE and then at degree level, there was a distinct swing to science at A-Level (though less so at degree level), and it was assumed that this build-up would translate automatically into growth.Footnote 20 But then, around 1960, just when anxieties about economic decline were peaking – the two cultures controversy, which was then raging, a case in point – it stopped working. The famous ‘swing away from science’ had begun.
II
I say the ‘famous’ swing away from science, but it is not as famous as it should be; it has not been the subject of any historical research and it rarely if ever appears in histories of the 1960s, or even of education in the 1960s.Footnote 21 Yet it is one of those telling markers of great social and cultural change in ‘the Sixties’, and like other such markers – including educational expansion itself, to which it is closely linked – it is fascinatingly determined by a number of possibly independent yet simultaneous changes in the fabric of society.
The ‘swing from science’ was first brought to wide public attention by the Robbins Committee in its October 1963 report. Robbins had commissioned a number of surveys of the flow from schools to universities to labour market and had appreciated that, at the very least, the ‘gradual swing towards science’ at A-Level in the 1950s was ‘no longer in evidence’. The Robbins Report itself was moderately sanguine about this; Lionel Robbins, a Conservative economist, was no friend of manpower planning, and neither really was his left-leaning adjutant Claus Moser. ‘The majority of graduates will, we hope, be sufficiently versatile to be capable of varied employment’, they wrote mildly in the main report.Footnote 22 But the swing continued – 42 per cent of A-Level candidates followed a primarily scientific course in 1962 and only 31 per cent in 1967.Footnote 23 With the advent of C. P. Snow as minister of technology and a Labour government red-hot for science and technology, more susceptible than most to the siren song of manpower planning, in the mid-1960s the ‘swing from science’ became a major public issue and a political problem.Footnote 24 An enquiry was set afoot in 1964 with Sir Fred Dainton, chemist and vice-chancellor of Nottingham, in the chair. Just as Claus Moser had done much of the footwork for Robbins, so a student of Moser's, Celia Phillips, did much of the footwork for Dainton.Footnote 25 Dainton's final report in 1968 essentially extended the ‘two cultures controversy’ into the late 1960s by arguing for vigorous action against the swing on both economic and cultural grounds. The ‘Dainton swing’, as it was sometimes now known, gave Dainton
cause for concern not only in relation to a future supply of qualified manpower which in consequence might possibly prove inadequate to the nation's needs, but also as a symptom of a condition in which science may be losing the esteem which its importance as an element in education deserves.Footnote 26
Dainton was not so interested in the causes of his swing as in the levers to reverse it, mostly drawn from manpower planning.Footnote 27 For explanations, we have to turn elsewhere. These varied greatly depending on the vested interests but also on the disciplinary preferences of the commentators.
One explanation – the one most prevalent at the time, and Dainton's favourite – we can discard pretty readily. This attributed the swing to the English system's exceptionally early specialisation. Early specialisation had become a bugbear in the ‘two cultures’ controversy, and criticised (as ‘subject-mindedness’) in the wake of the 1959 Crowther Report on secondary education.Footnote 28 As the swing had not then begun, the argument focused on the need for a good general education in both arts and sciences at least through 18 if not beyond. Once the swing began, the same fault could be blamed for the ‘English disease’ of cultural backwardness and economic decline. But even Dainton admitted the swing was an international phenomenon of the 1960s unrelated to school specialisation.Footnote 29 The clinching evidence came from Scotland, which saw a similar swing despite its much delayed subject specialisation. In the end, Dainton could not explain why being forced to study science or maths to 16 or 18 would make pupils more likely to choose to study it at university. As Scotland showed, it did not.Footnote 30
As awareness of the transnational nature of the swing grew – with evidence from the Organisation for Economic Co-operation and Development (OECD) emerging that Britain had a relatively high level of science take-up at university, and that it was hardly alone in experiencing the swing – cultural explanations gained purchase, and these were no longer solely in the doom-laden ‘two cultures’ vein.Footnote 31 At least from the mid-1960s, a general disillusionment with science and technology amongst the young was detected, which could be put in positive as well as negative terms, as ‘a concern for people rather than things’, or, as the social psychologist G. M. Carstairs noted, a move
away from doing and towards feeling. The young seem less interested in science, factual knowledge and cognitive mastery in general – the very skills which underlie technical efficiency. Instead they seem to express a mood of irrationality; they delight in fantasy. . .the exaltation of inner freedom, of the exploration of subjective experiences, the fullest possible realisation of one's personality. Self-discovery and self-fulfilment are seen as the supreme good and anything which cramps these endeavours is deplored.
Surveys of schools in the late 1960s confirmed this vague presentiment, more prosaically.
Heads felt that some of the glamour had left science careers, whereas it was becoming known that interesting careers were available to arts graduates. Many heads had observed the attraction of the socio-economic group of subjects for an increasing number of pupils, and it is possible that there is a reaction against a society dominated by technology.Footnote 32
Most intriguingly, an A-Level General Studies examination in 1969 actually asked students (as an exam question) to ‘Try to account for the fact that the number of students wishing to study arts and social sciences is increasing more rapidly than the numbers wishing to study the natural sciences.’ The answers came back that the sciences were boring, had a bad public image and lacked opportunities for self-expression, whereas the arts, at least for girls, reflected ‘their desire to help the community directly through social action’.Footnote 33
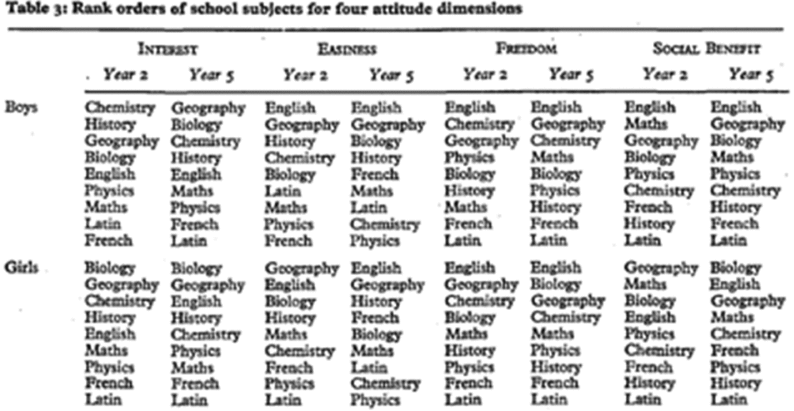
This shift in atittudes, cited by Derek Duckworth who did the most thorough studies of the ‘swing’ in the 1970s, connects to two other explanations which dovetail with and perhaps lie behind the cultural explanation. The first is a strong cohort effect. When A-Level and higher education expand rapidly, as they did in the 1960s, a new demographic comes into play. Less academically qualified pupils, from families with no previous exposure to post-compulsory education, enter the cohort. In Duckworth's sample of Lancashire grammar school pupils in the early 1970s, Maths, Physics and Chemistry were regarded as the hardest subjects (English, Geography and History were the easiest). Though the sciences did somewhat better in terms of interest, freedom and social benefit, their difficulty proved a great sticking point to new entrants (Latin and French did poorly on all scores) (Figure 1).Footnote 34 A second cohort effect, not yet so marked but progressively growing in significance, was gender.Footnote 35 Within the sciences, girls were more likely to prefer Biology to Chemistry on nearly all grounds. ‘People rather than things’ could thus favour softer sciences rather than the arts, but as a result both cohort effects had a marked effect on the swing away from Maths, Physics and Chemistry at both A-Level and degree level.Footnote 36
Attitudes to subjects among Lancashire grammar school students in the early 1970s

Another effect which dovetailed with culture and demography was the changing labour market. As we have seen, the graduate labour market in the 1950s was led by science-oriented professions, especially medicine and engineering, though teaching (which favoured the arts) was the single most common graduate destination. When the 1960s expansion took place, it not only changed the demographic makeup, it also changed the nature of the graduate labour market. A wider range of professions and employers were now fishing in a graduate pool where previously they could fish their top candidates out of school at 16 or 18.Footnote 37 There was also at the end of the 1960s the beginning of a pronounced post-industrial shift away from technologically oriented employment – the over-supply of graduate engineers was particularly obviousFootnote 38 – and towards expansion in the public sector, in the helping professions, and in retail and management.Footnote 39 It was not so much that these new graduate occupations disfavoured science – to the contrary, many science graduates were now gravitating towards managementFootnote 40 – but rather that they were more neutral as to subject choice, and thus in concert with the cultural and demographic shifts students could swing away from science without losing ground in the labour market. Evidence for this lies, for example, in the growing tendency of employers to advertise for graduates without specifying degree subject,Footnote 41 and the growing tendency of graduates to badge a wider variety of subjects (beyond science) as ‘vocational’.Footnote 42 These trends had the effect of causing the University Grants Committee to back off from ‘manpower planning’ as early as 1968.Footnote 43 They also gave the economists pause. ‘Human-capital’ arguments for investment in higher education became less targeted on science and technology and focused rather on widening participation in higher education more generally. In some circles, a new light was shed on the ‘human-capital’ value of investment in education by the ‘screening hypothesis’, which argued that employers chose graduates not for their particular skills but for general qualities of mind or behaviour (or for their class background), confident that they could train up such people on the job in whatever specific skills were needed.Footnote 44 Though governments never entirely lost their taste for manpower planning – and indeed this appetite would revive again in the 1980s under most unlikely auspices – nevertheless the whole university system went into the 1970s much more oriented to student demand, which allowed students to swing away from science unmolested, whatever the reasons that were truly driving them, interest, ability or vocation. Even Margaret Thatcher's 1972 White Paper on Education granted that widening participation entailed a wider range of motives for education and thus a wider range of subjects, providing ‘a stimulating opportunity to come to terms with themselves. . .to discover where their real interests and abilities lie’ and catering not only to vocationalism but also ‘personal and social action’.Footnote 45 (This is, perhaps, Thatcher's hippie moment.)
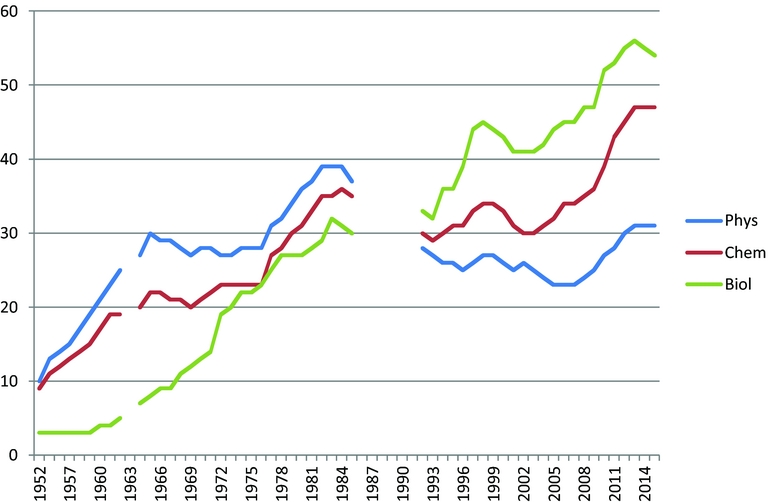
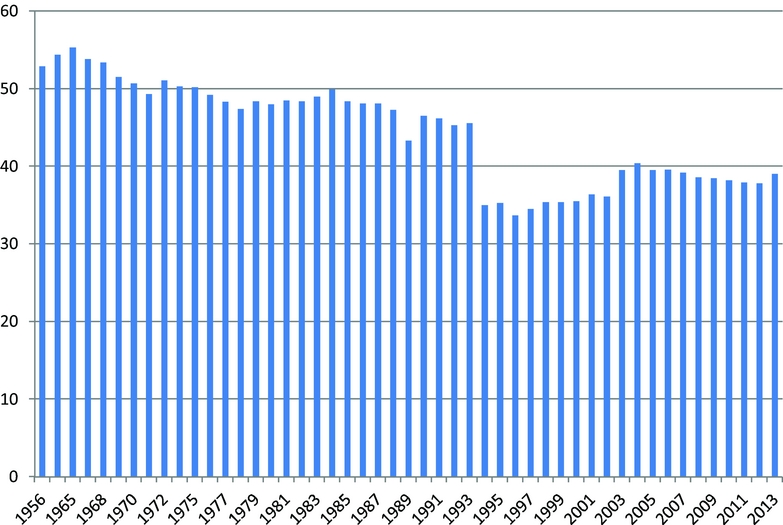
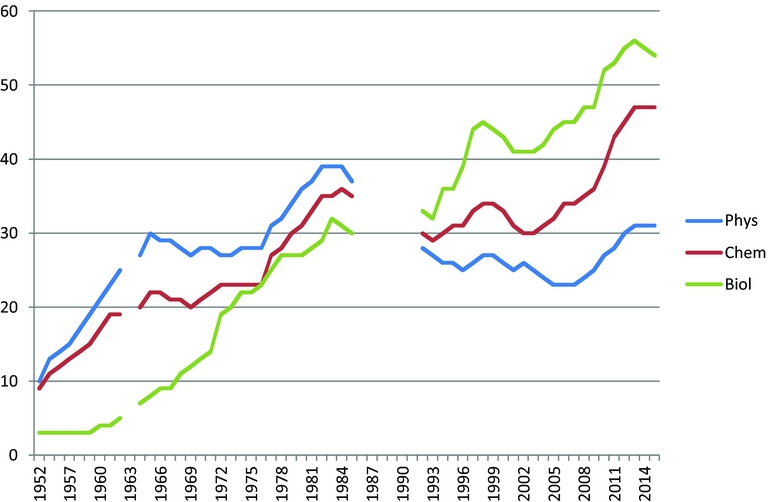
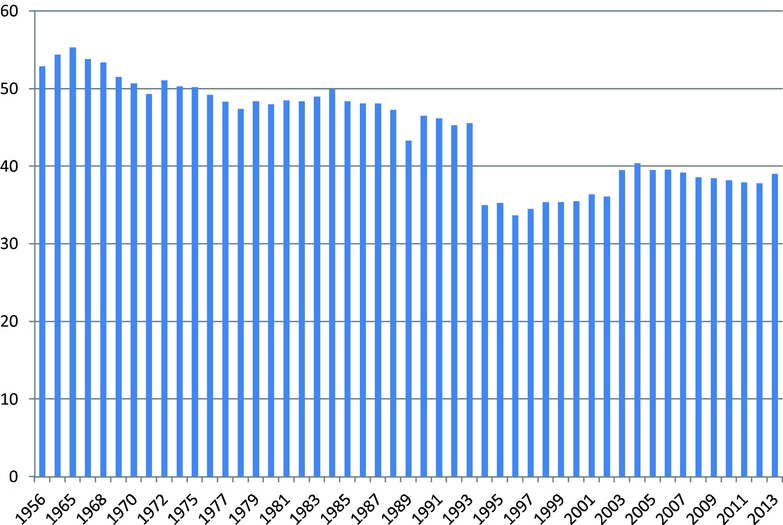
Before we consider what students were swinging to, let me just extend my analysis of the swing away from science into the 1980s, which will allow us to say something further about the causes of the swing, because the period from around 1970 to the late 1980s was a period of considerable stability in participation. Cohort effects, therefore, may have been reduced. And yet the swing away from science continued, and in certain respects accelerated. To 1976, at least, the swing away from Maths and Chemistry continued, the swing away from Physics slowed (after a very sharp early decline), while Biology surged ahead.Footnote 46 A great deal of this must have owed to the slow but remorseless rise in A-Level and degree participation amongst women. After about 1976, the swing halted. Both at A-Level and degree level, science held its share steady, even in Physics and Chemistry (Figures 2, 3).Footnote 47 Contemporaries prided themselves that this halting of the swing showed finally that pressure ‘from above’, from government, business and punditry, was telling on student demand. After 1976, the year of James Callaghan's Ruskin speech calling for a return to basics, and more particularly after 1979 with the advent of an even more furiously pro-science Conservative government, standards were seen to be holding and the ‘difficult’ subjects coming back into vogue.Footnote 48
Science A-Levels, England (in thousands)
Science degrees as percentage of all first degrees in universities, UK
But even this may have been to some degree a cohort effect. Although higher education participation rates were holding level, more students were enrolling not in universities but in the new polytechnics. The polys had been the brainchild of the 1964 Labour government and especially of Education Secretary Tony Crosland, part of the master plan to reverse the swing away from science in the name of manpower planning. The degrees they awarded through the Council for National Academic Awards (CNAA) were at first only awarded in science subjects. But as demand pressures told, the swing away from science registered in the polys too. Science's share of CNAA degrees gave way steadily throughout the 1970s to social studies and humanities courses.Footnote 49 Contemporaries decried this as ‘academic drift’, polys losing their distinctive sense of mission and apeing the older universities.Footnote 50 But the polys were much more sensitive to demand pressures than universities – their true mission was to widen participation rather than to steer new entrants towards science and technology courses in which they had no interest.Footnote 51 So these new entrants to polys in the 1970s, like the new entrants to universities in the 1960s, swung away from ‘difficult’ courses and no doubt towards the ‘self-discovery’ and ‘self-fulfilment’ held to be characteristic of the period. As polys sopped up new entrants, universities in turn could afford to become more selective, attracting more traditional students back to the sciences; thus, the swing away from science was halted in universities but continued at the polytechnics.
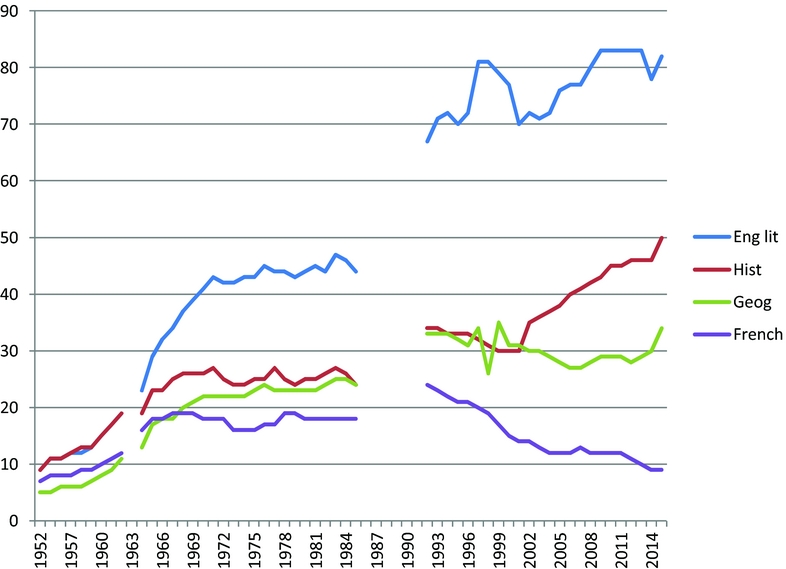
What, then, were students swinging to, in universities through the mid-1970s and in polytechnics through the mid-1980s? Initially, the swing appeared to go (and perhaps inevitably was) to what were then the only alternatives, the humanities. Although languages were already beginning their long-term tumble in the 1960s, English literature enjoyed robust growth in the 1960s – in part a gender effect, as English literature was the A-Level subject by far the most skewed to girls, 2–1 (whereas both History and Geography were mildly skewed to boys). But History and Geography both grew steadily during the most rapid phase of the swing to 1972.Footnote 52 After 1972, arts subjects including English Literature level off in absolute numbers and experience a mild decline in share at A-Level, much as the sciences do (Figure 4). This relative decline of almost all the established subjects, arts and sciences alike, marks a trend towards the introduction of new subjects at A-Level that had begun in the 1960s and developed further in the 1970s. The introduction of new subjects itself reflects a growing sensitivity to student demand and what subjects are introduced (and popular) tells us more about what demand was for.
Humanities A-Levels, England (in thousands)
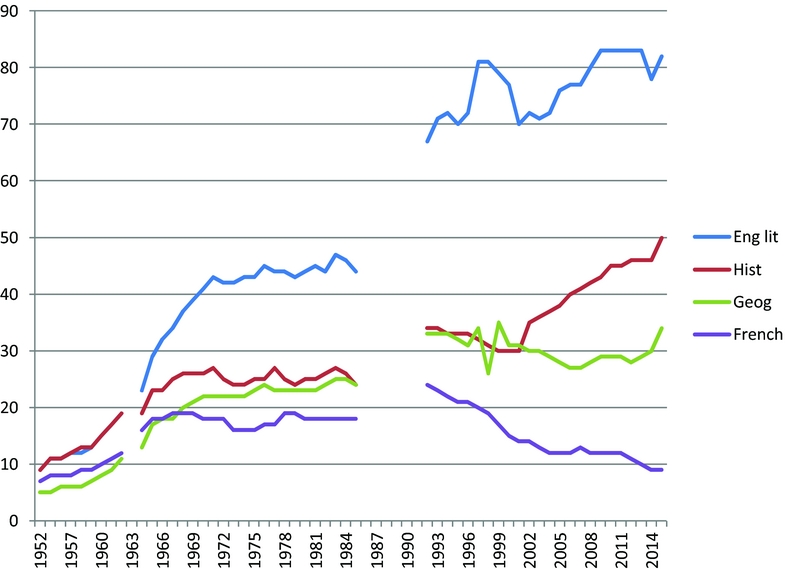
There was no popular new subject that could be counted as a scienceFootnote 53 and only one – Art – that could be counted as a humanities subject. By the 1980s, Art was a more popular subject at O-Level than History.Footnote 54 Most of the popular new subjects fell in an entirely new area, allegedly between arts and sciences, which became known as ‘social studies’, including Economics, Sociology and Business. Economics had been offered at both O- and A-Level in the 1950s but had very limited take-up (only 1,000 or 2,000 passes a year at A-Level); by 1972, it had overtaken History, with 27,000 passes. An entirely new subject, Sociology, gained growing numbers of candidates even at O-Level – where it had overtaken German by 1984.Footnote 55 A similar pattern naturally registered at university. Science and especially Engineering lost share; humanities generally retained their share (History lost a little ground); while social studies grew, with a peak share of degrees at 26 per cent in 1977. As we have seen, however, it was in the polytechnic sector that the swing away from science was benefiting the wider range of courses. At degree level in the polys, there was a big swing not only towards social studies, but also towards Creative Arts, humanities and Education (now migrating from teacher-training colleges to polytechnics as its own degree subject). By 1980, science and technology held only about the same share as social studies, 25 per cent, with Creative Arts, humanities and Education all still growing.
We can ask the same set of questions about the swing to social studies (and, to a lesser extent, to Creative Arts) that we asked about the swing away from science: what caused it, and what relative weights can we assign to the influences of interest, enjoyment, ability, earnings potential, career choice? We have already seen a number of cohort effects that help to explain this swing. A widening range of achievement and rising uptake of non-compulsory education by girls devalued Physics and Maths and favoured Geography, History, English and Biology, all seen by girls as easy and interesting. Pupils’ judgement of the freedom and social benefit afforded by the various subjects had the same effects, though less so for History. Creativity was a newly professed goal, evident in the rise of Art as an A-Level subject and, from the late 1970s, at degree level in the polytechnics. Pupils of both sexes were more explicit about seeking fulfilment and self-development through their academic studies, and girls about social service.Footnote 56
Structural effects also benefited social studies. Unlike the sciences or even the humanities, degree courses in social studies had no or few A-Level requirements, so they recruited from specialists in both.Footnote 57 The loosening of the link between school subjects, degree subjects and occupation encouraged freedom of choice. And as we have also seen, this did open up subject choice to more cultural influences, not only negative influences pushing young people away from science but also positive influences pushing them towards social studies. Girls were particularly apt to voice these positive impressions. Girls’ subject choices had always exhibited a traditional bent towards social service, which owed much to the fact that girls unlike boys had to find some selfless rationale to justify further education and vocationalism, and before the 1970s this usually ended up as a choice for teacher training. In the 1970s and 1980s, as women entered a wider variety of occupations, at a time when teacher training was being severely cut back, social studies seemed to combine social service with a number of the most popular new careers, in social work, personnel, commerce and local government.Footnote 58 Biology led to another new set of graduate professions in subjects related to medicine – pharmacy, ophthalmology, nursing – none of which expected a background in Physics or Chemistry.Footnote 59 Men, too, of course, were entering a widening array of occupations after university, notably business and management, and social studies were as useful a preparation for these careers as science. There is even some evidence that the traditional graduate premium attaching to science degrees – resulting from higher incomes for the science-based professions in medicine, engineering and industry – was receding, and that social studies degrees were producing a premium of their own.Footnote 60 Thus, cohort effects, cultural effects, changes in the labour market and employers’ growing need for graduates of any kind were all virtuously combining to favour social studies. As by 1980 social studies had become by some way the largest group of degree subjects at polytechnics, too, with Creative Arts in second place, there was even at that stage evidence that the swing away from science – and towards other subjects – was likely to continue should higher education expansion ever resume.Footnote 61
III
In the early 1980s, as I discussed in my second address, Keith Joseph, as Thatcher's education secretary, actually sought to do the reverse – to restrict higher education further, which he probably rightly thought would reverse the swing away from science and, more contentiously, make higher education better serve the needs of industry.Footnote 62 Thus, ‘manpower planning’, though Joseph fastidiously declined to name it as such, came briefly back into fashion under laissez-faire Conservative auspices; but this moment did not last long, as in the mid-1980s Joseph was suddenly replaced by Kenneth Baker and government policy just as suddenly reversed from restriction to pell-mell expansion. This anomalous early 1980s episode did have one lasting effect, which was to turn industry permanently into a lobby for science education. In the 1960s, industry had been more wary of manpower planning because of its natural suspicions of Labour and suspicions, too, that industry would have to pay the bill for workplace training, through apprenticeships, training levies and the like. In the 1980s, those suspicions dropped away, and, as Alison Wolf and Andrew Hacker have shown, in both the US and the UK industry joyfully lobbied for more training inside education that would be paid for by the taxpayer. Ever since the 1980s, therefore, employers – especially engineering employers – have been campaigning loudly and vigorously for more government subsidy of science and technology education, while all the time reducing their own training costs and often their wage bills.Footnote 63 This campaigning has figured prominently in a succession of government reports, vowing ‘to change the subject balance within higher education’ towards science and technology, though without until recently any evident effect on outcomes.Footnote 64 By 2004, one official survey could count 480 separate government initiatives aimed at boosting student numbers in STEM subjects.Footnote 65
Our historical perspective has already told us what informed commentators of the time suspected would happen when post-compulsory education was dramatically expanded, starting in the late 1980s. The new cohorts of university entrants brought with them the subject choices they were already leaning towards in the polytechnics in the 1980s – not only because the polytechnics were now universities, but also because the universities were expanding rapidly themselves and bringing in similar new entrants. The cohort of university entrants was very different from what it had been even at the previous peak of expansion in the late 1960s. Students with no family background in higher education and with fewer formal academic attainments now predominated, overwhelmingly. So, increasingly, did women – a majority of undergraduates by 1996, 56 per cent today. Although these new entrants did tend to emphasise their vocational goals in choosing subjects at university, their own families’ experience of the graduate labour market was so minimal, and the graduate labour market was changing so rapidly, that their subject choices continued to be driven by the traditional determinants of interest, enjoyment and prior attainment. And given the striking fact that the graduate premium (the additional income graduates could expect over those with fewer qualifications) remained high and stable throughout this rapid period of expansion, there was little incentive – or little knowledge of any incentive – to choose otherwise.Footnote 66
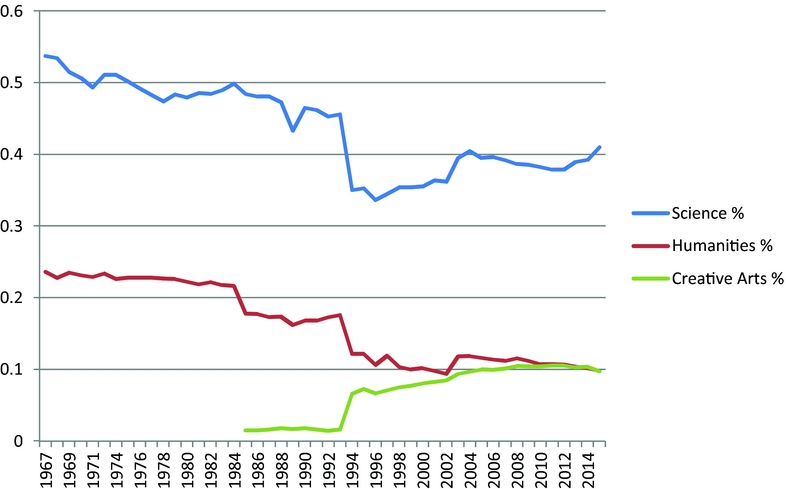
In these circumstances, it is hardly surprising that the swing away from science resumed, with a particularly sharp drop in the sciences’ total share of university degrees over the course of the 1990s when the higher education participation rate jumped from 14 per cent to over 30 per cent. From a late 1960s peak of 54 per cent of all degrees science's share fell to a nadir in 2010 of 38 per cent.Footnote 67 Within the sciences, Biology continued its inexorable rise – overtaking in terms of A-Level passes both Physics (easily) and Chemistry (less dramatically) at precisely the point of transition to mass higher education. Strikingly, the number (not merely the share) of A-Level candidates in Physics dropped continuously from 1984 to a low in 2007, losing a third of its candidates.Footnote 68
In the continuing swing away from science, ‘social studies’ remained the principal beneficiary, though within social studies the social sciences had stopped growing while business and commerce boomed, the latter overtaking the former in 1996. Other boom subjects were increasingly hard to categorise, reflecting the diversification of the disciplines, a growing tendency for candidates to take A-Levels in both science and arts subjects (encouraged by the introduction of AS-Level in 2000), and the ever-widening extension of the graduate labour market. One new subject lies on the borderland between science and social studies – Psychology – which now matches Biology in numbers of A-Level candidates, benefiting from the gender swing, presumed applicability to a wide range of jobs in the welfare and helping professions, and probably also from a cultural shift towards questions of social and personal identity. Another new subject group lies on the borderland between social studies and humanities – Communications, which includes both business-related and humanities-related subjects, including Media Studies and Cultural Studies. Education, now an all-graduate profession, with its own degrees as well as graduates in other subjects, also leans towards the humanities. And the Creative Arts, which had hardly figured at all as degree-level subjects at universities, grew robustly in share through the 2000s, reaching a peak in 2012 at 11 per cent of all degrees granted, matching the levels of the traditional humanities. Indeed, if one were to seek to measure the relative fortunes of the sciences and humanities, broadly construed, the humanities did much better in the period of rapid expansion since the late 1980s, largely because the Creative Arts did so much better than the only new science degree subjects, those subjects allied with medicine such as pharmacy and nursing (Figure 5). But even some traditional humanities subjects have benefited from expansion. Though languages have suffered a long decline, A-Level passes in History have doubled since 1985, a faster rate of growth than Biology, Business, Art or indeed any traditional subject. English, a compulsory examined subject for all secondary school pupils for the first time after GCSE was introduced in the late 1980s, benefited most; it had always been the most popular humanities subject at 16, but it was now even more so at 16 and 18. (Figure 4).
Science, Humanities and Creative Arts degrees as percentage of all first degrees in universities, UK
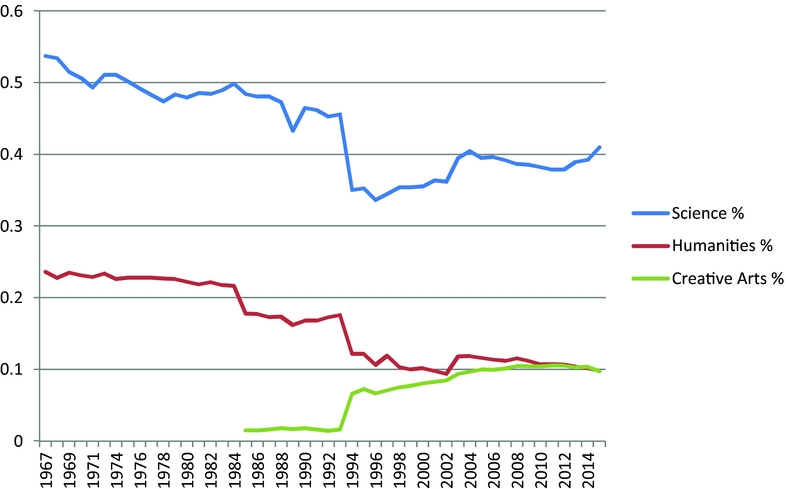
If we stand back and survey the entire trajectory from the 1950s nearly up to the present, the overall trends in subject choice are clear enough, though the multiple factors behind those trends remain hard to disentangle. Expansion of post-compulsory education meant a long and sustained swing away from science, despite repeated insistence by policymakers and industrial employers that ‘national needs’ required a swing in the other direction. Within the sciences, there is a marked swing to female-friendly subjects, principally Biology and Psychology. The greatest beneficiary of the swing was the odd ragbag of subjects that get categorised as ‘social studies’ – initially, social sciences; increasingly, Business and Commerce; but also humanities-leaning subjects such as Communications and Education. While the traditional humanities experience a swing similar to (but not as sharp as) the swing away from science, they are fortified by the recruitment of new subjects in the Creative Arts, greater than the recruitment by science of subjects allied to medicine.
I have shown that many of these trends can be traced back to the democratisation of education itself, as new entrants – women, students from less academic backgrounds or fewer academic qualifications, and latterly ethnic minorities – prefer social studies and humanities to science. These cohort effects, however, interact subtly with economic and cultural effects. Whatever industrial employers claim, the graduate labour market, as it expands, has less need for science graduates specifically and more for ‘graduateness’ unconnected to subject, thus facilitating freer choice. Employers in the growing sectors – retail, clerical and for much of our period the public sector – need supervisory skills and analytical skills, but not technical skills, and in their employing behaviours (rather than in industrial employers’ propaganda) are ‘screening’ candidates either for ‘graduateness’ or for other cognitive and behavioural characteristics, rather than seeking job-specific skills from education. Both the cohort effects and the widening of the graduate labour market chime with students’ higher prioritisation since the 1960s of self-understanding, self-development and creativity. What is interesting to consider, therefore, is the possibility that the sheer fact of democratisation – widening participation in post-compulsory education – is itself driving all these factors. A more diverse cohort necessarily brings a wider range of motivations into higher education, and as it is dominated by students with less academic background it is likely to introduce less academic considerations into subject choice. Their inexperience with the graduate labour market also suggests that they will be less purposefully vocational in their choices, even though they are more likely to badge their choices as vocational, to justify (mainly to their parents) staying on in the first place.Footnote 69 The graduate labour market then ratifies this decision by not placing very much weight on the subject of the degree. And the diversification of subject choice may even be responsible for, rather than simply reactive to, cultural values, as the average graduate – less technically oriented, more female, open to a wider range of occupations – is now more likely to appear as a ‘seeker’ than as a young, upper- or middle-class man hell bent on one of the few traditional graduate professions.Footnote 70
IV
But this story has a sting in its tail. Three factors in the last decade have (or could have) suddenly changed the calculus lying behind subject choice. Most important is probably the slump of 2008 and its aftermath, which is widely held to have disadvantaged especially the bottom end of the graduate pool, seen increasingly to be ‘overeducated’ and thus doomed to ‘graduate’ careers as baristas and shelf-stackers. In fact, the graduate premium has not shown much sign of declining – employers still favour graduates over non-graduates. Still, the slump might well have raised future earnings in the hierarchy of students’ subject-choice calculations. Then, in 2012, tuition fees were trebled to £9,000 a year. Funded primarily through income-contingent loans, high tuition fees might not have focused students’ minds further on future earnings but they have certainly focused ministers’ minds: for the first time, the lower the graduate's earnings, the higher the payout from the Treasury. Finally, as a result of both these factors as well as the well-documented politicians’ propensity to do this anyway (with as ever help from the engineering employers), a more explicit campaign is now under way to steer students towards science. Perhaps the most egregious illustration of this came in a speech (in the offices of Google, no less) by the education secretary, Nicky Morgan, in November 2014 which decried the last generation of careers advice as steering pupils towards the arts and humanities when, she claimed, ‘now we know. . .that the subjects that keep young people's options open and unlock doors to all sorts of careers are the STEM subjects’.Footnote 71 No wonder some people have taken to calling the current period ‘the age of STEM’.Footnote 72
This rhetoric, I hope you will recognise, is terribly familiar; politicians of all parties have been trying to reverse the swing away from science since it began in the early 1960s (while often also trumpeting ‘student choice’). But under the triple-whammy of slump, fees and a concerted propaganda campaign, who is to say that this time it might not work? Since 2008, the biggest growth subject at A-Level has been Maths, though the curve for other major subjects has been pretty flat (Figure 2). Since 2012, the first year of full-fees graduates, the swing away from science has for the first time in fifty years halted and gone into reverse. The humanities have not gone into sharp decline, but their historic slow decline in relative share has continued as science's has not, and for the first time the traditional humanities’ decline has not been compensated for by a growth in the Creative Arts, which have levelled off since 2011 (Figure 5).
This trend may continue; it may not; it is too soon to tell, and it is not for an historian to predict the future. Still, I want to conclude with a warning from history. The swing to STEM may be built on false promises, if students are being persuaded to choose subjects against their natural inclinations based on the prospect of higher future earnings. A recent study by a team of economists for the Institute of Fiscal Studies (IFS) has begun to track the correlation between choice of subject and subsequent earnings. It demonstrates considerable variation in mean earnings between subjects, with Creative Arts and Communications at the low end and Medicine, Economics, Engineering, Law and Physics at the high end. This would seem to confirm the rewards to many STEM subjects and the low returns for some of the fastest-growing non-STEM subjects, and to justify a swing to STEM as serving employers’ and perhaps thus national needs. The same study, however, also controls these returns for student characteristics, including age, region, prior attainment and parental income. Once you control for student characteristics, the disparities are much reduced – what appears to be a clear hierarchy at the median now dissolves into a pretty flat picture where subject choice does not seem to make that much difference to returns to education (with the clear exception of medicine). (Interestingly, choice of university seems to remain more important than choice of subject, even after controls for student characteristics are applied.)Footnote 73
From this, we might conclude, as we have concluded from some historical evidence that I have presented in my third and fourth addresses, that the economic rewards to education may not be so much rewards to specific skills or subjects as rewards to other characteristics, notably the generic analytic skills associated with ‘graduateness’ and the behavioural characteristics associated with class. Employers do not make much distinction between degree subjects, but they do make a distinction between graduates and non-graduates, and among graduates between those who share certain other characteristics – age, region, prior attainment, parental income – and those who do not. They use degree subject and institution, in other words, to screen for candidates who share more generically valued characteristics.Footnote 74
If this is true, then driving more students to STEM may have a series of perverse and unintended consequences. It may lead to more failure amongst lower-income students whose prior attainment and whose own preferences would have led them elsewhere, a result which Andrew Hacker has already documented as a result of ludicrously high Maths requirements in US high schools.Footnote 75 One government aim – more STEM students – is thus likely to frustrate another aim – widening participation. Or it may lead to an over-supply of STEM graduates, as those graduates find that their artificially generated STEM skills do not help them much in the labour market, when really employers had been using STEM skills to screen for something else, which these new STEM graduates lack – favoured background and prior attainment. It will of course please the engineering employers, who, as Hacker again suggests, will now be in a position possibly to spend less on training and certainly to spend less on wages.Footnote 76 Above all, it seems to me, seeking to override traditional student preferences for subjects that they enjoy and are good at, in favour of possibly illusory effects on the labour market and on economic growth, is likely to make education less fulfilling and more frustrating.
The degree of specificity in the IFS study about the returns to particular kinds of student, particular universities and particular subjects is only possible because of access to information about parental income and graduate income newly available from tax records and the Student Loan Company. Government has facilitated this access because it wishes itself to measure the degree of subsidy that it is providing through the student loan regime to specific courses at specific universities. That might be all to the good, if the goal is to show that courses chosen by less advantaged students – Creative Arts at post-1992 universities, for example – are being subsidised more, much as the pupil premium subsidises less advantaged students in schools. It is doubtful that that is the government's goal, however. It seems more likely that its aim will be to put pressure on the more subsidised courses as part of a broader campaign to push less advantaged students towards STEM. I have suggested some reasons why that will not work, or if it does work might have perverse consequences. The threat of new league tables based on graduate income – or the reality of a new Teaching Excellence Framework based on alleged ‘value added’ by subject – will be among the greatest challenges my successors will have to face. I hope in this address to have added some arguments to their armamentarium. And I end with confidence that they will be more than up to the task.