Introduction
The biological effects of plate tectonics have been extensively documented over the past 50 years, particularly for biogeographic processes (e.g., Jablonski et al. Reference Jablonski, Flessa and Valentine1985; Smith Reference Smith1988; Lieberman Reference Lieberman2000) and the diversity of marine systems (e.g., Valentine Reference Valentine1971; Valentine et al. Reference Valentine, Foin and Peart1978; Rich et al. Reference Rich, Johnson, Jones and Campsi1986; Sepkoski Reference Sepkoski1988; Smith Reference Smith1988; Valentine and Jablonski Reference Valentine and Jablonski1991, Reference Valentine and Jablonski2010; Miller Reference Miller1997; Alroy et al. Reference Alroy, Aberhan, Bottjer, Foote, Fürsich, Harries, Hendy, Holland, Ivany, Kiessling, Kosnik, Marshall, McGowan, Miller, Olszewski, Patzkowsky, Peters, Villier, Wagner, Bonuso, Borkow, Brenneis, Clapham, Fall, Ferguson, Hanson, Krug, Layou, Leckey, Nurnberg, Powers, Sessa, Simpson, Tomasovych and Visaggi2008; Holland Reference Holland2010). Several authors have investigated the implications of plate tectonics, specifically continental rifting and collision, for diversity via changes to the species–area relationship (e.g., Flessa and Imbrie Reference Flessa and Imbrie1973; Hallam Reference Hallam1974; Flessa and Sepkoski Reference Flessa and Sepkoski1978). Even so, a comprehensive prediction of the effects of plate tectonics on regional and global diversity of terrestrial, coastal-marine, deep-marine, and oceanic-island systems has not been developed.
Continental rifting and collision might control diversity through four main mechanisms, which operate not only for individual rifting and collision events but also for supercontinent assembly and breakup. First, rifting and collision can directly change habitable area, affecting diversity through the species–area relationship (Flessa and Imbrie Reference Flessa and Imbrie1973; Hallam Reference Hallam1974; Flessa and Sepkoski Reference Flessa and Sepkoski1978). Second, rifting and collision drive changes in eustatic sea level and dynamic topography that control flooding of continents (Gurnis Reference Gurnis1993; Rowley Reference Rowley2017), which also affects habitable area (Wyatt Reference Wyatt1987). Third, rifting and collision can change climatic and oceanographic conditions, especially the distribution of habitable regions relative to the latitudinal diversity gradient (Valentine Reference Valentine1971; Valentine and Moores Reference Valentine and Moores1972; Jablonski et al. Reference Jablonski, Flessa and Valentine1985). Fourth and finally, they can promote or limit the dispersal of species, modulating the importance of vicariance and the origination of ecologically equivalent species on different continents (Lieberman Reference Lieberman2000).
In this paper, I will focus on the first two mechanisms, ones that govern habitable area, because they are generalizable and less a function of the peculiar geographic arrangement of plates. The latter two mechanisms depend more on the specifics of how continents are configured, as well as global climate, making generalization less feasible than an analysis of specific tectonic scenarios. Neutral ecological theory (Hubbell Reference Hubbell2001) provides a dispersal-based mechanism for generating species–area relationships, and it is used here to predict the response of diversity to the plate-tectonic effects of continental collision and rifting, which also apply to supercontinent assembly and breakup. Terrestrial, coastal-marine, deep-marine, and oceanic-island settings respond differently to the rifting and collision of continents, so each is considered separately.
Methods
The Basic UNTB Model
The species–area relationship (Preston Reference Preston1960; Rosenzweig Reference Rosenzweig1995) is the primary tool for predicting the response of diversity to changes in habitable area. When habitable area changes without any changes in fragmentation, the predictions from the species–area relationship are straightforward. When changes in fragmentation occur, the effects on diversity are less intuitive, but are readily simulated with unified neutral theory of biodiversity and biogeography (UNTB), which provides a dispersal-based mechanism for generating species–area relationships (Hubbell Reference Hubbell2001; Rosindell et al. Reference Rosindell, Hubbell and Etienne2011).
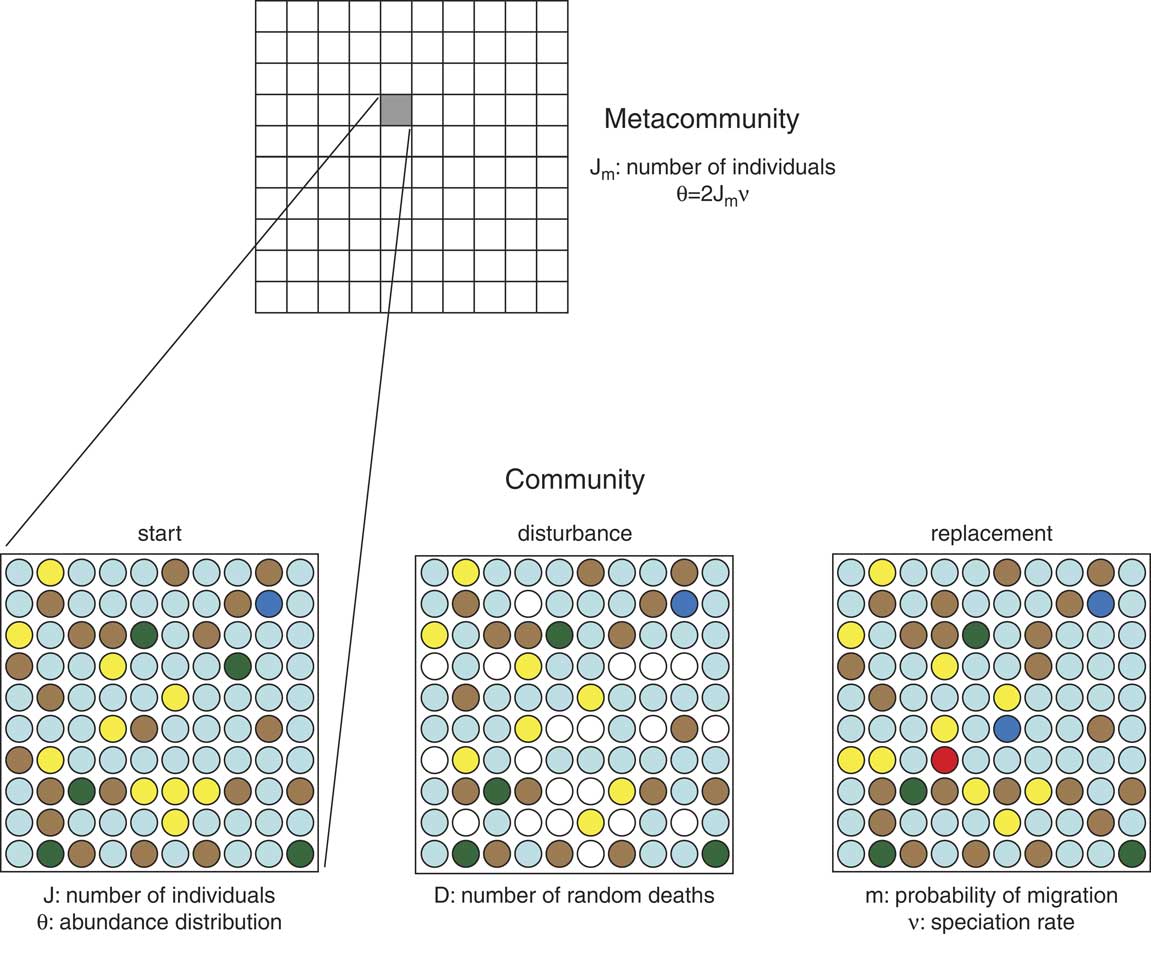
UNTB simulates diversity within a single trophic level, such as first-level consumers or carnivores. The model consists of a metacommunity, which contains multiple equally sized communities, each of which contains a fixed number of sites that are always occupied by an individual of some species (Fig. 1). Model communities within a metacommunity are arranged in a grid with finite boundaries to mimic the physical limits of actual metacommunities.
Schematic of the metacommunity simulation, in which a metacommunity (top) is composed of many communities (bottom). Each community contains a fixed number of sites (J), each occupied by one individual drawn from multiple species, indicated by shaded circles. The abundance distribution of species is controlled by the fundamental biodiversity number (θ). In each time step, a fixed number of individuals (D) in each community die (white circles) and are subsequently replaced; most are replaced from the local community pool or by immigration from surrounding communities (with probability m), and a few are speciation events (ν, circle in fourth column, seventh row). J m is the total number of individuals in a metacommunity, that is, the number of individuals in each community multiplied by the number of communities.

The diversity structure (richness, evenness, relative abundance distribution) of each community and the metacommunity is governed in UNTB by three parameters. First, metacommunity size (J m) is the combined number of individuals in all communities. The fundamental biodiversity number (θ) is a recurring constant in the derivation of the UNTB and is approximated by the metacommunity size multiplied by the per-individual probability of speciation (ν; Rosindell et al. Reference Rosindell, Hubbell and Etienne2011). Metacommunity size is typically a very large number, whereas ν is very small, resulting in observed values of θ typically in the range of 1–200 (Hubbell Reference Hubbell2001). The third parameter is the migration probability (m), which reflects the importance of dispersal of species among communities in the metacommunity.
The UNTB model is performed over a series of time steps, each containing the same actions (Fig. 1). In each time step, a fixed proportion of individuals in a community dies, creating empty sites. A small number of these empty sites are filled by newly originating species, with probability ν. Some remaining empty sites are refilled from within the community, and the probability that a site will be reoccupied by a given species is equal to the proportion of sites in the community occupied by that species. Other empty sites are refilled similarly, but based on the proportional abundance of species in the surrounding communities, that is, from adjacent grid cells in the metacommunity. The proportion of vacated sites that are filled from the metacommunity is given by m, the migration probability. Larger migration probabilities reflect greater interchange and connectivity among communities within a metacommunity, and smaller migration probabilities reflect dispersal limitation and greater isolation.
Given a per-individual probability of speciation, a migration probability, and a metacommunity composed of a fixed number of equally sized communities, the diversity structure of the metacommunity will reach a stochastic equilibrium. Large values of θ result in metacommunities and communities with higher richness and evenness than those with small values of θ. Smaller values of the migration probability (m) decrease the richness and evenness within communities and increase the beta diversity among communities (Hubbell Reference Hubbell2001).
UNTB assumes that individuals of all species are competitively equal, such that reoccupation of a vacated site depends only on the relative abundance of species within the community or neighboring communities in the metacommunity. UNTB seeks to understand metacommunity dynamics primarily through dispersal and thereby negates the role of niches in the distribution of species. This assumption is certainly false to some degree, and this is recognized as such by proponents of UNTB (Hubbell Reference Hubbell2001, Reference Hubbell2006; Rosindell et al. Reference Rosindell, Hubbell and Etienne2011, Reference Rosindell, Hubbell, He, Harmon and Etienne2012). Even so, UNTB has value in that it often successfully predicts patterns of biodiversity and biogeography, implying that although niches are important considerations in some contexts, they may not be necessary to describe other aspects of biodiversity and biogeography.
The Modified UNTB Model
The UNTB simulation is modified here to simulate plate-tectonic processes, which can change the areas of metacommunities, as well as cause metacommunities to be fragmented or joined. To simulate growth of a metacommunity, one community is added (or removed to simulate shrinkage) from the metacommunity grid per time step. When a new community is added, it is initially filled by recruitment from the neighboring communities in the metacommunity, as well as from speciation events. Simulating the fragmentation of a metacommunity into two smaller metacommunities is accomplished by splitting the metacommunity at some time step into two portions, and these are simulated separately afterward, that is, without dispersal of species between them. Joining two metacommunities is accomplished in the opposite way: beginning with two separate metacommunity grids and joining them at one time step so that dispersal between them becomes possible. In all simulations, metacommunities undergo a period of equilibration before changing their size or fragmentation, followed by a second period of equilibration after they are perturbed.
Model Parameterization
The simulations were performed in R (R Core Team 2017), and the source code is available in the Supplementary Material. Communities within the metacommunity are initially seeded with an abundance structure described by J m and θ, using the rand.neutral() function in the ‘untb’ package of R (Hankin Reference Hankin2007). During early explorations of the model, the probability of death (D) of individuals during the disturbance phase was varied from 0.33 to 0.01, reflecting average individual life spans of 1/D (3–100 years). Variations in the probability of death mainly affect the time for the model to come to equilibrium, and the simulations shown here set D to 0.1.
Although the relative abundance distribution of the metacommunity and its communities are controlled by J m, θ, and m, varying these did not change the qualitative effects of plate-tectonic changes in metacommunity size and fragmentation. For the runs shown here, J m is approximately 106 individuals (900 communities in a 30×30 grid, each with 1000 individuals), θ is 30, and m is 0.1. Because θ is approximately equal to the product of J m and ν, either ν or θ must change as J m changes. Consequently, ν was held fixed, allowing θ to vary with J m. Although larger values of J m better approximate the size of modern metacommunities (e.g., the number of first-order consumers in a coastal-marine metacommunity must be gigantic), increasing J m comes at a significant cost in computational time. For example, a single run of a metacommunity with 10,000 communities (100×100 grid) takes several days to complete, and one with 90,000 communities (300×300 grid) takes months.
Results
Plate-tectonic processes can affect metacommunities in four main ways: increasing the area of metacommunity, decreasing its area, dividing a metacommunity into two, and merging two metacommunities into one.
Changing Metacommunity Size
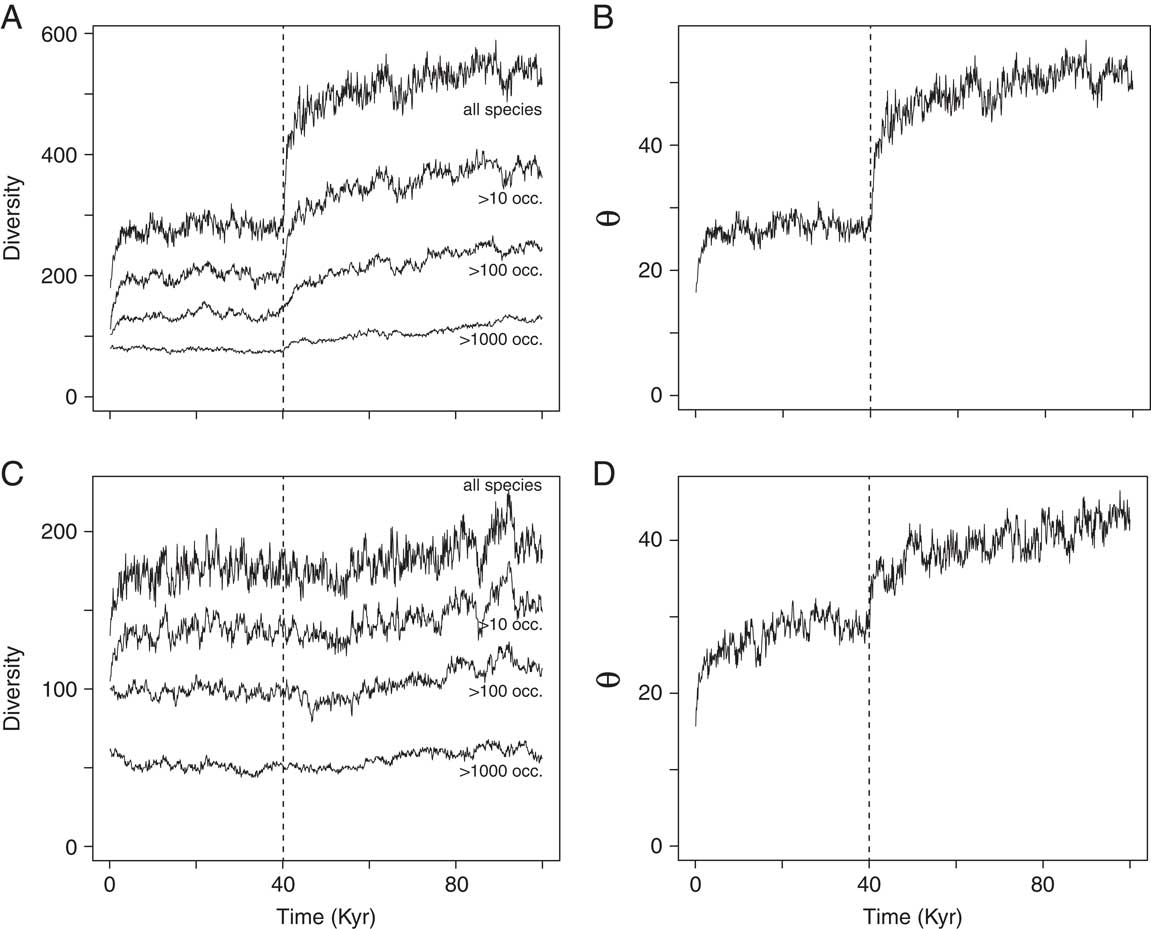
Increasing the size of a metacommunity by increasing the number of communities within it drives an increase in θ (Fig. 2). Values of θ fit to the relative abundance distribution of species increase in direct proportion to the increase in area, as expected. For example, doubling the area of the metacommunity produces the expected doubling in θ (Fig. 2B), and increasing its area by 50% generates the expected 50% increase in θ (Fig. 2D). Over short timescales, θ fluctuates stochastically from the origination and extinction of species as well as from small changes in relative abundance.
Simulation of metacommunity richness and fundamental biodiversity number (θ) during growth of metacommunity. Metacommunity is allowed to equilibrate for 40 Kyr, followed by period in which metacommunity gains one community per annual time step beginning at 40 Ka, followed by 60 Kyr of equilibration. A, B, Metacommunity grows 100% in size. C, D, Metacommunity grows 50%. Diversity curves show, from top to bottom, all species and species occurring at least 10, 100, and 1000 times (i.e., rare, common, and abundant species).

Neutral theory (Hubbell Reference Hubbell2001) predicts that richness and evenness are controlled by θ, as well as by the migration probability (m), which is held constant. As expected, diversity in the metacommunity increases as the size of the metacommunity increases (Fig. 2). The increase in diversity also mimics the proportional increase in area: doubling the area approximately doubles the diversity (Fig. 2A). Like θ, diversity changes stochastically over short timescales. Much of these changes in diversity reflect the loss or addition of rare species, and the diversity of common or abundant taxa has smaller absolute stochastic variation than the diversity of all taxa combined. Because not all species may be encountered in a modern study or in the geological record, there is a veil line beyond which rarer species may not be known (Preston Reference Preston1948; Harnik Reference Harnik2009). Diversity of species with at least 10, 100, and 1000 occurrences show similar but dampened patterns compared with total richness. These diversity trajectories, as well as θ, are highly correlated (R 2>0.9), so only values of fitted θ are shown in subsequent plots.
Diversity and θ take a protracted interval to equilibrate following the increase in metacommunity size. In these simulations, where the initial metacommunity consists of 900 communities, this equilibration time is on the order of tens of thousands of years, which is also true in simulations of metacommunities with 10,000 communities (simulations not shown). Although larger metacommunities could not be simulated owing to prohibitive run times, they are biologically realistic (e.g., marine suspension feeders or plankton), and it is possible that such gigantic metacommunities might have geologically detectable equilibration times. Such long equilibration times for gigantic metacommunities are also suggested by the observation that marine invertebrates and protists take on the order of a million years to reach their maximal geographic ranges (Foote Reference Foote2007; Foote et al. Reference Foote, Crampton, Beu, Marshall, Cooper, Maxwell and Matcham2007; Liow and Stenseth Reference Liow and Stenseth2007). Because changes in metacommunity area are likely to be geologically longer lived than simulated here, many geologically detectable changes in θ likely reflect the pace of change in metacommunity area.
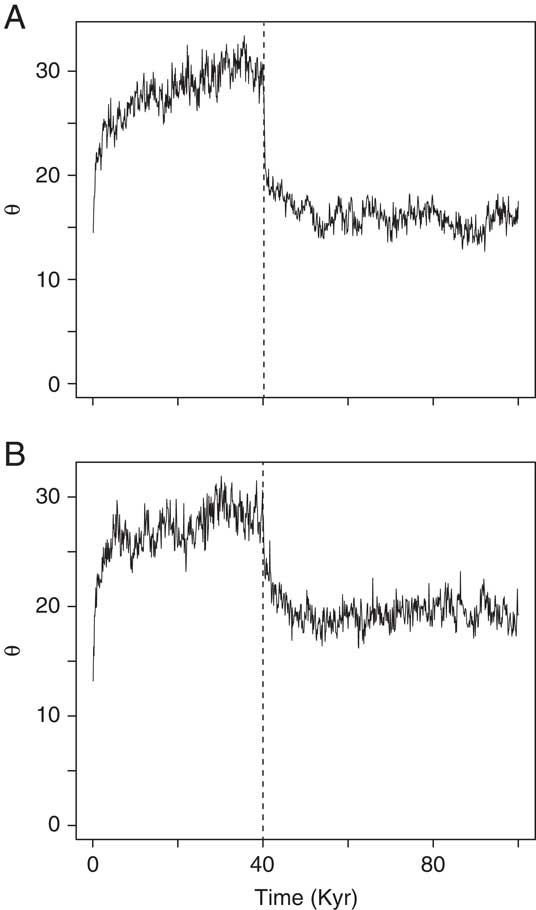
Decreasing metacommunity size produces the opposite effects of increasing metacommunity size (Fig. 3), including short-term stochastic variation in diversity and θ, as well as similar equilibration times. Diversity and θ decrease when a metacommunity is reduced in size, and they do so in proportion to the loss of metacommunity size. Thus, as a metacommunity grows or shrinks in size, it will approach and eventually equilibrate at values of θ and diversity characteristic of a metacommunity of that size.
Simulation of fundamental biodiversity number (θ) during shrinkage of metacommunity, with same equilibration intervals as in Figure 2. A, Metacommunity shrinks 50%. B, Metacommunity shrinks 33%.

Changing Metacommunity Fragmentation
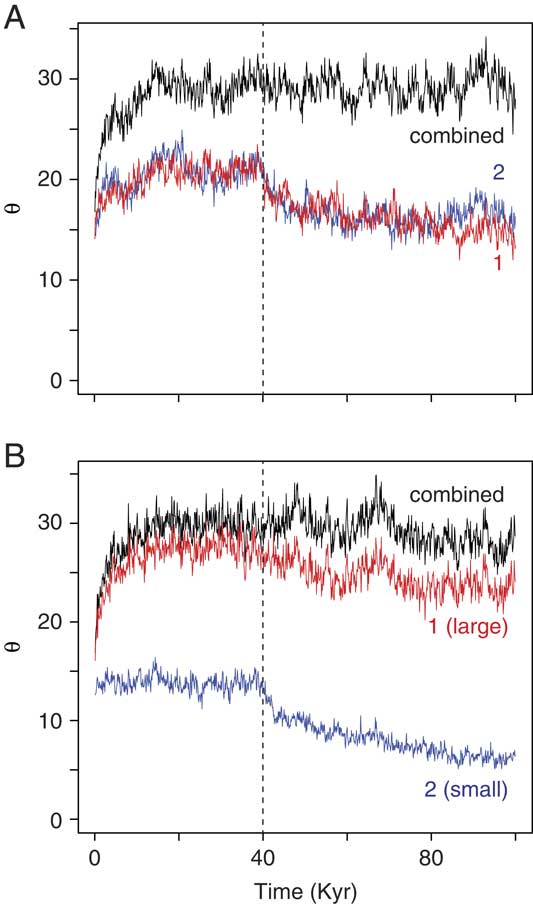
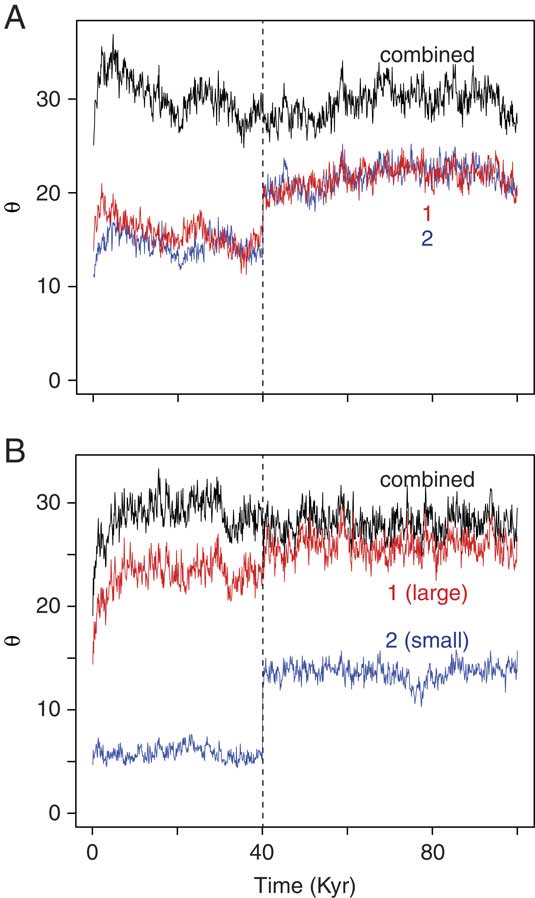
Splitting one metacommunity into two causes no change in total θ, although it does decrease θ within each of the component metacommunities (Fig. 4). For example, when a metacommunity is split evenly, total θ remains at 30, but the θ of each newly formed metacommunity approaches 15, as expected (Fig. 4A). Splitting a metacommunity unevenly (4:1 size ratio) also maintains a nearly constant total θ, with those of the divided metacommunities approximating a 4:1 ratio (Fig. 4B). This pattern of no change in total θ is robust to variations in the per-individual probability of speciation (ν), metacommunity size (J m), and the per–time step death rate (D). Because changes in θ reflect changes in richness, dividing a metacommunity does not change the total richness of the combined system. Dividing a metacommunity does increase richness in each of the new metacommunities, with the reductions inversely proportional to the sizes of the new metacommunities, and it increases beta diversity among the metacommunities.
Simulation of fundamental biodiversity number (θ) during fragmentation of metacommunity into two metacommunities that are completely isolated from one another, beginning at 40 Ka. A, Metacommunity divides into two equally sized metacommunities (1, 2). B, Metacommunity divides into two metacommunities, with the larger metacommunity (1) being four times the size of the smaller (2).

Merging previously isolated metacommunities into one connected metacommunity likewise results in no change in total θ or diversity (Fig. 5), but it increases θ and diversity within each of the original metacommunity areas. When metacommunities of similar sizes are merged, each one gains approximately the same diversity (Fig. 5A), but when metacommunities differ in size, the smaller metacommunity experiences a proportionally greater increase in diversity after the merge (Fig. 5B). In both cases, beta diversity among the original metacommunity areas decreases following merging of metacommunities.
Simulation of fundamental biodiversity number (θ) during merging of two originally isolated metacommunities into a single metacommunity, beginning at 40 Ka. A, Starting metacommunities (1, 2) are equal in size. B, Larger starting metacommunity (1) is four times the size of the smaller starting metacommunity (2).

Equilibration of metacommunity diversity following fragmentation or merging in these simulations takes a similar amount of time, as in the cases of growing or shrinking metacommunities. Because merging and fragmentation of metacommunities may be geologically protracted, in which migration between the metacommunities is progressively established or lost as barriers to dispersal are removed or created, geologically detectable changes in diversity are likely to reflect the rate at which the metacommunities became joined or separated.
The Diversity of Four Major Geographic Systems
With these models, it becomes possible to predict how the diversity of terrestrial, coastal-marine, deep-marine, and oceanic-island systems changes in response to the rifting and collision of continents. These effects are compounded during the breakup and growth of supercontinents.
Terrestrial Systems
For terrestrial systems, there are several effects to consider as continents rift and collide, including the partitioning of global area into individual continents, changes in total continental area owing to rifting and collision, and changes in continental area owing to secondary eustatic effects of rifting and collision. The changing latitudinal distribution of continental land masses and the latitudinal diversity gradient also play an important role.
Effects of Fragmentation
The models presented here suggest that the breakup and collision of continents should have no direct effect on global terrestrial diversity, although they will change diversity on individual continents, especially smaller ones. These model results match those of an analytical solution to neutral theory in which there is no dispersal among continents following rifting (Jordan et al. Reference Jordan, Barraclough and Rosindell2016).
That total diversity is not affected by fragmentation and isolation of metacommunities may seem counterintuitive, especially considering that habitat fragmentation and increasing isolation of communities today cause a loss of diversity within communities and metacommunities (Mouquet et al. Reference Mouquet, Matthiessen, Miller and Gonzalez2011). Neutral models are consistent with this observation: increasing habitat fragmentation in neutral models is generated by decreasing the migration probability (m), which causes a decrease in community and metacommunity diversity (Hubbell Reference Hubbell2001). However, increasing isolation of communities within metacommunities has a different effect from the division and isolation of metacommunities from one another, as is shown later.
The lack of change in total diversity may also seem surprising, given that rifting of a continent into three equal-sized and dispersal-isolated subcontinents was previously argued to increase the total diversity of the system by 25% (Flessa and Imbrie Reference Flessa and Imbrie1973; Hallam Reference Hallam1974). The joining of three previously isolated continents into one was similarly argued to cause a system-wide 66% diversity loss. These arguments, based on applying the Arrhenius species–area relationship to continents, were also used to estimate the predicted extinction of mammals during the establishment of the Panamanian land bridge (Flessa Reference Flessa1975).
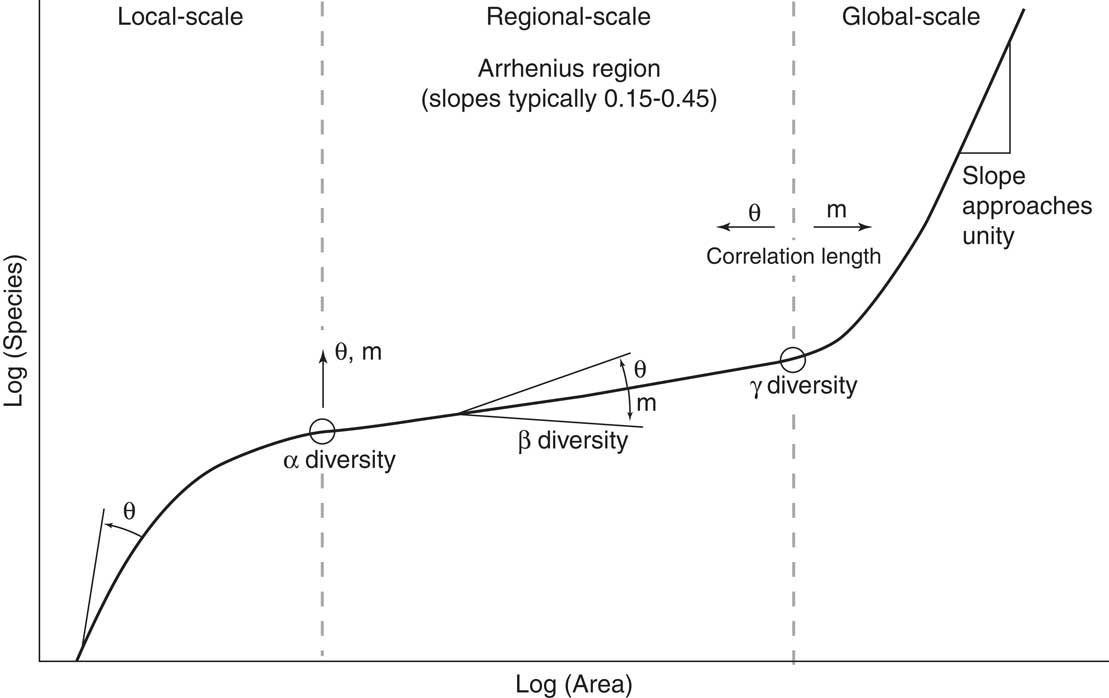
The discrepancy is clarified by understanding the different forms of the species–area relationship (Rosenzweig Reference Rosenzweig1995). When the relationship between diversity and area is built by measuring the diversity in a small area and progressively encompassing larger areas, a triphasic curve is generated (Fig. 6; Preston Reference Preston1960; Shmida and Wilson Reference Shmida and Wilson1985). An initially steep slope at the smallest scales is generated by the chance addition of species owing to patchiness. This is followed by a relatively gentle slope that corresponds to the scale of a landscape or metacommunity. A final steeper slope results from the addition of geographically isolated metacommunities and is therefore the appropriate portion to consider when trying to understand the effects of rifting and collision.
The triphasic curve of the relationship between species richness and area (based on Preston Reference Preston1960; Shmida and Wilson Reference Shmida and Wilson1985; Hubbell Reference Hubbell2001), showing how increasing θ and increasing m affect local richness (i.e., community scale), regional richness (i.e., metacommunity scale), and global richness.

The slope on the final leg of the triphasic curve converges to 1.0 as metacommunities approach total isolation from other metacommunities (Shmida and Wilson Reference Shmida and Wilson1985; Hubbell Reference Hubbell2001; Jordan et al. Reference Jordan, Barraclough and Rosindell2016). A simple example demonstrates why. If two isolated continents each have an area of 10 and a diversity of 100, such that their combined area is 20 and their combined diversity is 200, the slope of the resulting species–area relationship becomes:
 $${{{ log }\,200{\minus} log\,100} \over {log\, 20{\minus}log\, 10}}\, {\equals}\, 1.0.$$
This relationship can be generalized for multiple continents that differ in area and diversity:
 $${{log\, D_{t} {\minus}log\, D_{m} } \over {log\, A_{t} {\minus}log\, A_{m} }}\, {\equals}\, 1.0,$$
where D t and A t are the total diversity and area of the combined continents, and D m and A m are the mean diversity and area of the individual continents.
The behavior of the neutral models presented here matches this relationship, such that global diversity is unaffected by changes in continental fragmentation. If continents maintain some interchange for a period following breakup, the slope of the species–area relationship will be less than 1, and this may result in a transient pulse in global diversity until continents become isolated (Jordan et al. Reference Jordan, Barraclough and Rosindell2016). During supercontinent breakup, the average size of continents will decrease, lowering their average terrestrial diversity. Maintaining constant global terrestrial diversity while decreasing the average continental diversity can be achieved only if beta diversity among continents increases.
Instead of building a species–area relationship by encompassing progressively larger areas, Flessa and Imbrie (Reference Flessa and Imbrie1973) and Flessa (Reference Flessa1975) generated the relationship by regressing the diversity of continents against area. They used this relationship to extrapolate diversity when continents were merged into one mass. Building species–area relationships through these types of regressions produces artificially flatter slopes, leading to their prediction that rifting would increase terrestrial diversity and collision would reduce it.
Effects of Area Change
For a fixed size of the earth, the rifting and collision of continents must change the total area of continental lithosphere and therefore potentially the area of terrestrial systems. For example, stretching of continental lithosphere during rifting thins it, therefore increasing its map area. Crustal thickening during continental collision likewise decreases the area of continental lithosphere.
The effect of this on terrestrial habitable area is less clear. For example, thinning of continental lithosphere generates rift basins that evolve into passive margins largely flooded by the oceans. Thus, although extension during rifting increases the area of continental lithosphere, flooding of these stretched areas may counteract or even exceed the increased area of continental lithosphere, resulting in no change or, potentially, a small loss of terrestrial area.
Because the area of continental lithosphere increases during rifting and decreases during collision, the area of oceanic lithosphere must compensate for these changes by decreasing during rifting and increasing during collision (Algeo and Seslavinsky Reference Algeo and Seslavinsky1995b). If the volume of water in the oceans is held constant, these changes in shape of the ocean basins force eustatic sea level to fall during continental collision and rise during rifting (cf. Nance et al. Reference Nance, Murphy and Santosh2014), and these changes are compounded by dynamic topography (Gurnis Reference Gurnis1993).
These eustatic changes can be significant. For example, the development of an Atlantic-scale ocean through rifting is expected to generate a 50–90 m eustatic sea-level rise (Heller and Angevine Reference Heller and Angevine1985; Harrison Reference Harrison1988). The collision of India and Asia may have lowered eustatic sea level by 20 m (Harrison Reference Harrison1988), in part through subduction and destruction of continental lithosphere (Ingalls et al. Reference Ingalls, Rowley, Currie and Colman2016). Because eustatic rise and fall do not translate simply into transgression and regression in sedimentary basins (Holland Reference Holland2012), estimates of continental flooding are necessary to understand the effects of rifting and collision on terrestrial area. Although estimates of flooding vary considerably and are subject to considerable uncertainty (Algeo and Seslavinsky Reference Algeo and Seslavinsky1995a,Reference Algeo and Seslavinskyb), they consistently show that supercontinent breakup generates a net loss of terrestrial area, with supercontinent formation producing a net gain in terrestrial area (Fischer Reference Fischer1981; Cao et al. Reference Cao, Zahirovic, Flament, Williams, Golonka and Müller2017).
The effect of such changes in area on diversity can be predicted from the Arrhenius species–area relationship. For example, the change in continental flooding from the Permo-Triassic to the Cretaceous would have decreased land area by 22%, and the change from the Cretaceous to today would have increased land area by 52%, based on the flooding estimates of Cao et al. (Reference Cao, Zahirovic, Flament, Williams, Golonka and Müller2017). Using reasonable terrestrial z values of 0.3 and k values of 100 (Rosenzweig Reference Rosenzweig1995), the Permian–Cretaceous loss of land area would lower terrestrial diversity by 7%, and the post-Cretaceous increase in terrestrial area would increase diversity by 13%.
Net Effect
Continental fragmentation and coalescence should have no effect on the global diversity of systems, although they may have significant effects on the terrestrial diversity of individual continents, especially smaller ones. Although stretching of continents during rifting and thickening during collision may change the surface area of continental lithosphere, accompanying subsidence or uplift may counterbalance much of this, resulting in little change in habitable terrestrial area and therefore little change in diversity. Increased flooding during supercontinent formation and decreased flooding during supercontinent breakup will have small effects on terrestrial diversity. Collectively, supercontinent formation should result in at most a modest increase in global terrestrial diversity, with supercontinent breakup causing the reverse. Changes in topographic complexity (Badgley et al. Reference Badgley, Smiley, Terry, Davis, DeSantis, Fox, Hopkins, Jezkova, Matocq, Matzke, McGuire, Mulch, Riddle, Roth, Samuels, Strömberg and Yanites2017) might complicate these effects through changes in the isolation of metacommunities, thereby affecting the migration parameter (m).
Reported Diversity Changes
Although beset by doubts about the completeness of the fossil record (e.g., Wall et al. Reference Wall, Ivany and Wilkinson2011; Benson and Upchurch Reference Benson and Upchurch2013; Holland Reference Holland2016; Barrett et al. Reference Barrett, McGowan and Page2017) and few in number, diversity studies of terrestrial systems through the Phanerozoic support the predictions of these models. Even though land plant diversity is strongly tied to area, no significant correlations were found between land plant diversity and the number of continents, islands, or total land masses in the Northern Hemisphere through the Phanerozoic (Tiffney and Niklas Reference Tiffney and Niklas1990). The lack of these correlations was unexpected and difficult to explain, and the authors suggested that it might reflect a bias in the fossil record. The models presented here suggest that rather than reflecting a biased fossil record, the lack of correlation is what ought to be expected for terrestrial systems. The diversity of mammal orders, families, and genera is also strongly tied to terrestrial area (Flessa Reference Flessa1975). Although it has been suggested that the greater Cenozoic diversity of mammals relative to Mesozoic reptiles reflects increasing continental fragmentation (Kurtén Reference Kurtén1967, Reference Kurtén1969), this interpretation has been contested owing to the comparison across different higher taxa, different biomes, and different latitudinal configurations of the continents (Charig Reference Charig1973). Benton (Reference Benton2010) came to a similar conclusion, that modern biodiversity on land reflects changes in ecospace rather than the degree of continental fragmentation.
Coastal-Marine Systems
The diversity of coastal-marine systems, those areas of flooded continental lithosphere (including epicontinental seas), has a greater potential for change because of plate-tectonic events. Such events can change the total perimeter of continents as well as secondarily drive eustatic changes that control continental flooding. Diversity can also be substantially affected by the changing latitudinal distribution of coastal oceans.
Continental Perimeter
Although the area of coastal-marine systems can be substantially modified by extensive inland seas during times of exceptionally high eustatic sea level, the area of these shallow seas is controlled mainly by the length of continental perimeters (Hallam Reference Hallam1974; Algeo and Wilkinson Reference Algeo and Wilkinson1991). Geometric considerations show that the increase in perimeter from rifting can be considerable. For example, splitting a circle into two equal halves increases the perimeter by 64%. Splitting a square into two equal triangles increases the perimeter by 71%, and splitting it into two equal rectangles drives a 50% increase. The breakup index, the sum of continental perimeters divided by the sum of their areas, was 0.46 in the late Proterozoic, reached a high of 1.01 in the Cambrian, dropped to 0.57 in the late Paleozoic, then climbed to 0.94 in the Cretaceous (Cogné and Humler Reference Cogné and Humler2008). If continental area has changed little over the Phanerozoic, variations in the breakup index imply the continental perimeter has varied by a factor of approximately two.
The effect on diversity can be understood through the Arrhenius species–area relationship. Using typical marine values of z (0.25) and k (100; Valentine and Jablonski Reference Valentine and Jablonski1991), increases in continental perimeter of 50% and 100% would result increase coastal-marine diversity by 11% and 19%. Thus, unlike terrestrial systems, continental fragmentation and collision directly affect the total area of coastal-marine systems simply by increasing the combined continental perimeter (cf. Hallam Reference Hallam1974).
For coastal-marine systems, continental breakup not only increases the total perimeter of continents and therefore habitable area and global diversity, it also increases the perimeter of each continent individually, increasing diversity on each continent. Isolation of continents likewise increases their taxonomic distinctiveness, such that continental breakup simultaneously raises global diversity, provincial diversity, and among-province beta diversity (cf. Valentine and Moores Reference Valentine and Moores1972; Hallam Reference Hallam1974).
Effects of Area Change
Changes in continental flooding during supercontinent breakup and collision provide a second, and reinforcing, means of controlling the area of coastal-marine systems. In general, percent flooding of continents reaches a minimum during supercontinent formation (e.g., late Proterozoic, Permian, approaching one today) and a maximum shortly after supercontinent breakup (Ordovician, Cretaceous; Fisher 1981; Cao et al. Reference Cao, Zahirovic, Flament, Williams, Golonka and Müller2017). Early estimates of percent flooding suggested 55% in the Ordovician, 20% in the Permo-Triassic, 35% in the Cretaceous, and 12% today (Fischer Reference Fischer1981, Reference Fischer1984). More recent estimates suggest a minimum in percent flooding in the Permian (26%), with peaks in percent flooding in the early Paleozoic (46%) and Cretaceous (42%; Cao et al. Reference Cao, Zahirovic, Flament, Williams, Golonka and Müller2017).
It is important to note the asymmetry in the effect of flooding on terrestrial and coastal-marine systems. Because more continental lithosphere was land than flooded coastal seas during the Phanerozoic, even during times of peak flooding, a change in flooding has a greater percentage effect on the relatively smaller coastal-marine area than on relatively larger terrestrial area, even though the absolute amount change in coastal-marine area (i.e., flooded continental lithosphere) must be exactly balanced by an opposite change in terrestrial area. For example, the increase in percent flooding from 26% in the Permo-Triassic to 42% in the Cretaceous (Cao et al. Reference Cao, Zahirovic, Flament, Williams, Golonka and Müller2017) decreased terrestrial area by 22% but increased coastal-marine area by 62%. These changes in area would have decreased terrestrial diversity by 7% but increased coastal-marine diversity by 15% (z=0.3, k=100). On a percentage basis, the area and diversity of coastal-marine systems are more sensitive to changes in flooding than are terrestrial systems.
Net Effect
The effects of changing continental perimeter and eustasy are reinforcing. During continental rifting, continental perimeter increases and continental flooding increases, both increasing the area and diversity of coastal-marine systems. Continental collision does the reverse, decreasing area and diversity of coastal-marine systems. The area and diversity of coastal-marine systems should therefore show a strong relationship to the formation and breakup of supercontinents.
Reported Diversity Changes
These model predictions agree with the most recent and most comprehensive evaluation of the connection between plate tectonics and the diversity of marine systems (Zaffos et al. Reference Zaffos, Finnegan and Peters2017). Specifically, Zaffos et al. (Reference Zaffos, Finnegan and Peters2017) report a positive correlation between marine diversity and the global degree of continental fragmentation. Furthermore, they show that marine diversity remains correlated with the state of fragmentation for tens of millions of years, suggesting geologically measurable lag times, as postulated for the enormously large marine metacommunities from the models presented here. Encouragingly, these correlations are robust to variations in the extent of the marine fossil record and are not the result of variable preservation through time. Unpredicted by the models presented here, Zaffos et al. (Reference Zaffos, Finnegan and Peters2017) report that increases in fragmentation were more strongly correlated with diversity than decreases in fragmentation, although they raise the possibility that this might reflect unequal sampling in the tropics through time. Such departures from the models described here may be evidence of nonneutral metacommunity dynamics.
The fundamental biodiversity number (θ) of marine metacommunities increases through the Phanerozoic, with short-term declines following mass extinctions, a pattern suggesting that the abundance of marine organisms (driven by productivity) was the primary control on Phanerozoic diversity (Holland and Sclafani Reference Holland and Sclafani2015). This pattern, coupled with the correlation between global marine diversity and continental fragmentation (Zaffos et al. Reference Zaffos, Finnegan and Peters2017), suggests that productivity and continental fragmentation are the twin drivers of Phanerozoic marine diversity at the global scale.
Deep-Marine Systems
The diversity of deep-marine systems, that is, marine areas overlying oceanic lithosphere but not including oceanic-island systems, is affected by the rifting and collision of continents, changes in the area of oceanic lithosphere, and to a lesser degree by secondary eustatic effects.
As is true for terrestrial systems, the fragmentation and coalescence of deep-ocean basins owing to rifting and collision should not change global deep-ocean diversity, although individual ocean basins should experience changes in diversity, especially smaller ocean basins. As is true for terrestrial systems, the fragmentation and coalescence of deep-ocean basins should be expressed primarily in beta diversity among basins.
Where deep-ocean areas differ fundamentally from all other systems is that oceanic lithosphere is created and destroyed on the timescales of Phanerozoic diversity, such that individual ocean basins grow early in their history because of seafloor spreading, but shrink later in their history with the formation of subduction zones along their margins. These changes in area of individual ocean basins are enormous and should result in substantial changes in diversity over their history. This might also be countered by parallel changes in the size of oligotrophic gyres, which would lower the density of organisms, and thereby θ in the centers of individual ocean basins. Because the total area of oceanic lithosphere is relatively constant over the Phanerozoic, global diversity should be relatively static, with strongly varying degrees of beta diversity among ocean basins over time.
Net Effect
As a result, global diversity of deep-marine basins should vary little over geologic time in response to plate-tectonic processes, although individual ocean basins and beta diversity among basins should change markedly. In addition to these direct effects of plate-tectonic processes, the latitudinal distribution of deep-ocean basins will likely affect the diversity of individual basins and the global deep-ocean system.
Testing these predictions is considerably more difficult than for terrestrial and coastal-marine systems, owing to the destruction of the deep-ocean sedimentary record. For example, half of all oceanic lithosphere today is younger than 85 Ma, and no oceanic lithosphere is older than 180 Ma (Rowley Reference Rowley2002). These timescales are substantially shorter than the timescales of supercontinent assembly and breakup (Nance et al. Reference Nance, Murphy and Santosh2014), resulting in truncated histories of individual basins.
Oceanic-Island Systems
The area and extent of oceanic-island systems, developed primarily along volcanic island arcs and hot spots, also have the potential to change from continental rifting and collision, and especially during the breakup and assembly of supercontinents. This may change the length of volcanic arcs, as well as produce secondary eustatic changes in shallow-marine area. How shallow-marine area around oceanic-island systems changes over time follows from rather different principles than those for terrestrial, coastal-marine, and deep-marine systems.
Global Length of Volcanic Arcs
Although it is unclear whether the length of hotspot chains changes systematically during the growth and breakup of supercontinents, the length of island arc systems along convergent margins should be tightly coupled to supercontinent formation. With the growth of a supercontinent, the number of plates decreases, driving parallel decreases in ridge length and length of volcanic arcs. How the global length of arc systems varies with the number of plates can be estimated from a geometric argument.
For a circular plate moving with respect to surrounding plates, and ignoring transform margins temporarily, one half of its circumference would be a divergent margin and the other half would be a convergent margin. If the earth is covered with plates that are circular on average, the total length of convergent margins (or divergent margins) would be:
 $$L\, {\equals}\, n/2{\asterisk} \bar P/2$$
where L is the total length of convergent margins, n is the number of plates, and
 $$ \bar P$$
is the mean perimeter of the plates. Mean perimeter is divided by 2, because half of each perimeter is a convergent margin, and the number of plates is divided by 2 to prevent double-counting of margins (i.e., a convergent margin on one plate is also a convergent margin for another plate). If transform margins were included, L would somewhat less than this.
This relationship can be written as
 $$L\, {\equals}\, {{\mathop{\sum}P } \over 4},$$
where ∑P is the total length of all margins around the globe. Combining the relationships between radius, area, and perimeter of circles allows perimeter to be described as:
 $$P\, {\equals}\, 2\sqrt \pi A.$$
In turn, this allows the total length of convergent margins to be related to the mean area of plates (
 $$ \bar A$$
):
 $$L\, {\equals}\, n\,/\,2\sqrt {\pi \bar{A}} .$$
Recasting the average area of a plate in terms of the surface area of the earth (E) gives
 $$L\, {\equals}\, {{\sqrt {n\pi E} } \over 2}.$$
Therefore, the global length of convergent margins is expected to increase with the square root of the number of plates, if plates have a circular shape.
One way to account for transform margins would be to assume that plates are square on average, such that half of margins would be transform, one-quarter would be convergent, and one-quarter would be divergent, making the total length of convergent margins equal to:
 $$L\, {\equals}\, n/2{\asterisk}\bar P/4,$$
which simplifies to
 $$L\, {\equals}\, {{\mathop{\sum}P } \over 8}.$$
Using the relationships between the area, perimeter, and length of a side for a square permits perimeter of a square to be described in terms of area (A):
 $$P\, {\equals}\, 4\sqrt A .$$
In terms of average plate area of square plates, the global length of convergent margins becomes:
 $$L\, {\equals}\, {{n\sqrt {\bar{A}} } \over 2}$$
Substituting the relationship between average plate area and the surface of the earth gives
 $$L\, {\equals}\, {{\sqrt {nE} } \over 2}.$$
Thus, for square plates, the global length of convergent margins is also expected to increase with the square root of the number of plates, although the proportionality coefficient differs from the circular-plate model.
Relative to today, these two solutions bracket the total length of convergent margins. Today, 35.2% of plate margins are convergent, 36.4% are divergent, and 28.4% are transform (Bird Reference Bird2003). The circular-plate model assumes 50% of plate margins are convergent, compared with 25% for the square-plate model.
How well these two models predict the global length of convergent margins from mean plate area can be compared with a modern compilation of plate areas and boundaries (Bird Reference Bird2003). Today, there are 52 plates with a mean area of 9,807,692 km2 and a total convergent margin length of 91,762 km. Based on the circular-plate model, this mean area implies a total convergent margin length of 144,321 km, whereas the square-plate model produces an estimate of 81,425 km. Thus, these two models bracket the actual convergent margin length, with the square-plate model being a closer fit, likely because it includes transform margins.
Because the circular-plate model and the square-plate model both predict that the global length of convergent margins should increase with the square root of the number of plates, arc length should reach a minimum during supercontinent assembly and a maximum during supercontinent breakup. This should favor decreasing oceanic-island diversity during supercontinent assembly and increasing diversity during breakup.
Secondary Sea-Level Effects
Eustatic fall during supercontinent formation and eustatic rise during supercontinent breakup complicate the predictions based on volcanic-arc length. The standard assumption is that islands are cone shaped (Raup and Stanley Reference Raup and Stanley1978; Stanley Reference Stanley1979; Jablonski Reference Jablonski1985), such that a eustatic fall should increase shallow-marine area and eustatic rise should decrease it. If this were generally true, it would oppose the gain in area from arc length during supercontinent breakup and the loss of arc length during supercontinent formation.
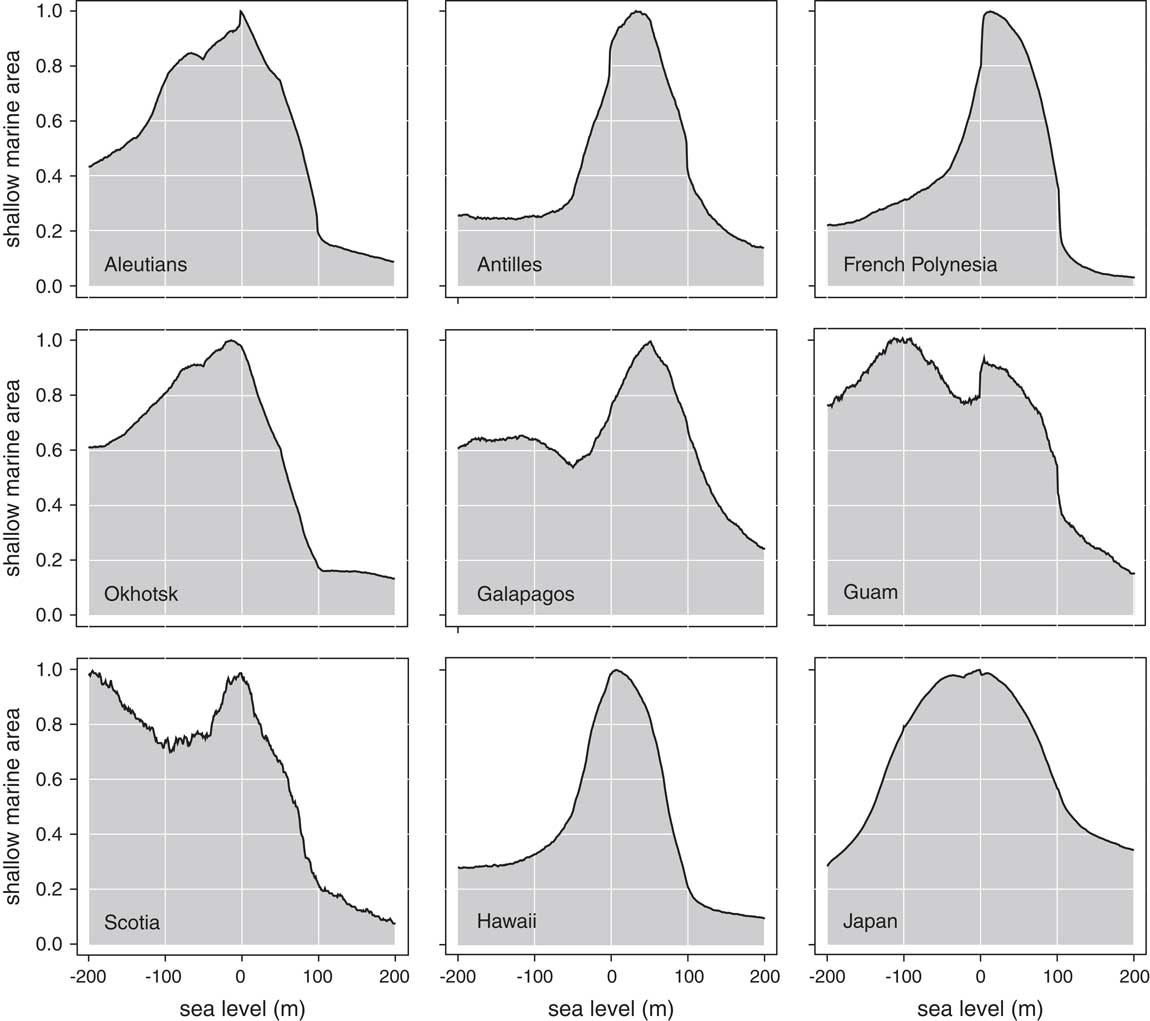
Rather than assume islands are cone shaped, we can directly test the effects of sea-level rise and fall on the shallow-marine area of individual island chains using modern topography, following the approach of Holland (Reference Holland2012). As is true for continental margins (Holland Reference Holland2012), the relationship between sea-level change and shallow-marine area on oceanic islands is more complicated than generally described (Fig. 7). Slope of oceanic islands is not constant, and for many island systems, slope increases with depth. As a result, whether eustatic changes increase or decrease, the shallow-marine area around oceanic-island systems depends on their hypsometry, the amount of eustatic change, and the starting position of eustatic sea level. For example, for several island chains (Aleutians, Okhotsk, French Polynesia, Hawaii), both eustatic rise and eustatic fall starting from present sea level would decrease shallow-marine area. A large fall (100 m) on Guam relative to today would increase shallow-marine area, but smaller falls would decrease it, and the Scotia arc displays a similar relationship. These dependencies are true not only for island arcs but also for hot spots and islands developed along mid-ocean ridges. Such unique relationships between habitat area and sea level have also been noted for specific Macaronesian islands (Rijsdijk et al. Reference Rijsdijk, Hengl, Norder, Otto, Emerson, Ávila, López, van Loon, Tjørve and Fernández-Palacios2014). The relationship between eustatic sea-level and shallow-marine area around oceanic islands will therefore be considerably noisier than that between plate fragmentation and the length of oceanic-island chains.
Plots of shallow-marine area as a function of sea level for nine regions of oceanic islands; each plot is scaled from zero to its maximum area. Shallow marine is defined for this plot as water depths of 0–25 m, and the geographic area of this depth range is plotted as a proportion of the maximum shallow-marine area achieved within each region. Position of sea level varies from −200 m to+200 m relative to the present day. Plots follow the same conventions as in Holland (Reference Holland2012).

Net Effect
Given that eustatic rise will increase the area of shallow-marine habitats on some oceanic islands but decrease it on others, the primary effect of supercontinent assembly and breakup lies in the length of island arc systems. The importance of island arc length is also underscored by recent suggestions that the eustatic response to supercontinent assembly and breakup be may much smaller than previously thought (± 25 m; Rowley Reference Rowley2017). Specifically, the area of shallow-marine habitat, and therefore diversity around oceanic-island systems, is expected to increase during supercontinent breakup and decrease during supercontinent formation.
As for deep-ocean systems, opportunities for testing these trends over geologic time are difficult, largely owing to their limited geologic record caused by the destruction, deformation, and metamorphism of ocean-island systems during collisions with continents.
The Latitudinal Diversity Gradient
A first-order control on global diversity is the latitudinal diversity gradient, the poleward decrease in diversity present in terrestrial and marine systems (Valentine and Jablonski Reference Valentine and Jablonski2010). The latitudinal position of individual metacommunities therefore strongly affects their diversity, and the latitudinal distribution of metacommunities in large part governs global diversity.
Although niche-based hypotheses for the latitudinal diversity gradient cannot be directly accommodated in UNTB (Hubbell Reference Hubbell2001), neutral theory allows for four ways in which a latitudinal diversity gradient might be established.
The fundamental biodiversity number is generally defined as the product of metacommunity size (measured as the number of individuals, J m) and the per-individual probability of speciation (ν). Metacommunity size can in turn be expressed as the product of the area of the metacommunity and the areal density of organisms. Latitudinal variation in any of these parameters, or in the migration probability (m), could generate a latitudinal diversity gradient.
For example, poleward decrease in metacommunity area could generate a latitudinal diversity gradient, as diversity and area are directly related. Existing evidence suggests that this is not the case; for example, the polar-marine province is quite large but contains relatively few species (Valentine and Jablonski Reference Valentine and Jablonski2010).
Per-individual speciation rates might be higher in the tropics, which would increase the fundamental biodiversity number and therefore richness and evenness in the tropics. Although not directly comparable to the per-individual speciation rates of the neutral model, species and genus origination rates of marine bivalves are highest in the tropics (Valentine and Jablonski Reference Valentine and Jablonski2010), lending support to the plausibility of higher per-individual speciation rates.
The density of organisms might also be higher in the tropics, perhaps reflecting increased tropical productivity and nutrient or food availability. Variations in productivity have been proposed as an explanation for observed variations in the fundamental biodiversity number in marine systems through the Phanerozoic, an explanation that would provide a unified origin for observed Phanerozoic changes in abundance, local richness, global richness, evenness, and body size, as well as their changes in the wake of mass extinctions (Holland and Sclafani Reference Holland and Sclafani2015).
Finally, latitudinal variation in the migration probability (m) could generate a diversity gradient. Smaller values of the migration parameter cause local communities to be increasingly isolated, reducing their diversity and their evenness (Hubbell Reference Hubbell2001). In turn, this reduces the diversity and evenness of the metacommunity. If the migration parameter was generally lower poleward, a latitudinal diversity gradient might be established, although it is unclear why dispersal would decrease poleward, causing communities to become systematically more isolated.
Of the four mechanisms, a poleward decrease in the density of organisms and per-individual speciation rates appear to be the most plausible, but all four of these need to be tested.
Conclusions
1. When metacommunities operate under neutral dispersal-based rules, they display characteristic changes in diversity and the fundamental biodiversity number (θ) when perturbed by changes in size or fragmentation. Growing metacommunities display increasing values of diversity and θ, and shrinking metacommunities display the opposite. Metacommunities that are split into two metacommunities show no change in total diversity or θ, but the individual resulting metacommunities shift to lower equilibrium values of diversity and θ. If a metacommunity is split unequally, the smaller of the two metacommunities will experience a greater drop in diversity and θ. When metacommunities are joined, the total system shows no change in diversity and θ, but the areas occupied by each of the original metacommunities undergo an increase in diversity and θ. For metacommunities of up to 10 million individuals, the response time of these changes is on the order of tens of thousands of years and will generally be undetectable in the geological record, but gigantic metacommunities of billions of individuals or more may have geologically detectable response times.
2. These neutral models can be used to predict how the diversity of different geographic systems will change during supercontinent breakup and assembly. Global terrestrial diversity should change little from the rifting and collision of continents, although individual continents are predicted to have increased diversity following collision and decreased diversity following rifting, and this should be more noticeable with smaller continents. Beta diversity among provinces should therefore increase following rifting and decrease following collision.
3. Global and regional coastal-marine diversity should be strongly affected by plate-tectonic processes, both from the merging and splitting of metacommunities and from the reinforcing secondary effects on eustatic sea level. Continental rifting and its accompanying eustatic rise are predicted to increase the diversity within individual metacommunities, with collision and its associated eustatic fall producing the opposite effect.
4. Global deep-marine diversity should vary little over geologic time in response to supercontinent formation and breakup, although the diversity of individual basins and the beta diversity among basins is predicted to change greatly from the expansion and subsequent shrinkage of individual oceans.
5. Global diversity of oceanic-island systems is predicted to grow with the increasing length of volcanic arcs during supercontinent breakup and decline with shortening length of arcs during supercontinent assembly. Although eustatic effects of rifting and collision may significantly affect area and diversity on individual island systems, the response of the area of individual island systems is heterogeneous enough that it is unclear whether eustasy has any predictable net effect on the global diversity of oceanic-island systems.
6. Changes in the latitudinal position of individual metacommunities are expected to have a significant effect on the diversity of those metacommunities, with a concomitant effect of latitudinal distribution of metacommunities on global diversity. Two viable mechanisms for generating this latitudinal diversity gradient through neutral theory are latitudinal variations in the spatial abundance of organisms and the per-individual speciation rate. These latitudinal changes may reinforce or counteract the plate-tectonic effects of growth and shrinkage of metacommunities and the separation and merging of metacommunities.
Acknowledgments
I appreciate the helpful comments of M. Foote, Associate Editor C. Badgley, and reviewers S. Finnegan and S. Peters. This study is supported by National Science Foundation grant EAR-0948895.
Supplementary material
Data available from the Dryad Digital Repository: https://doi.org/10.5061/dryad.7hg87