Introduction
Despite extreme environmental conditions, the biota of Antarctica is amazingly rich and highly endemic (Eastman Reference Eastman2005). The teleost fish fauna of the Southern Ocean is unique as it is dominated by a single clade, the Notothenioidei (Eastman Reference Eastman1993). Antarctic notothenioids are thought to represent an adaptive radiation in the freezing waters of the Southern Ocean (Eastman Reference Eastman1993, Clarke & Johnston Reference Clarke and Johnston1996). Species in this clade are characterized by the possession of antifreeze glycoproteins that are considered a “key innovation,” facilitating the utilization of freezing Antarctic marine habitats unavailable to temperate-adapted teleost lineages (Chen et al. Reference Chen, DeVries and Cheng1997, Cheng et al. Reference Cheng, Chen, Near and Jin2003). With the protection from freezing, Antarctic notothenioids have diversified to exploit a wide array of habitats in the Southern Ocean (Eastman & DeVries Reference Eastman and DeVries1981, Klingenberg & Ekau Reference Klingenberg and Ekau1996).
The phylogenetics of notothenioid fishes has been extensively investigated through analyses of morphological characters (Balushkin Reference Balushkin1992, Reference Balushkin2000), DNA sequences from mitochondrial genes (Bargelloni et al. Reference Bargelloni, Zane, Derome, Lecointre and Patarnello1994, Reference Bargelloni, Ritchie, Patarnello, Battaglia, Lambert and Meyer2000, Derome et al. Reference Derome, Chen, Dettai, Bonillo and Lecointre2002, Near et al. Reference Near, Pesavento and Cheng2003, Reference Near, Pesavento and Cheng2004), and more recently sequences from single copy nuclear genes (Sanchez et al. Reference Sanchez, Dettaï, Bonillo, Ozouf-Costaz, Detrich and Lecointre2007, Near & Cheng Reference Near and Cheng2008). These analyses have produced reasonably similar phylogenetic trees of notothenioids, but many questions requiring additional phylogenetic exploration remain.
The nototheniid clade Trematomus is a prime example of a group where phylogenetic relationships remain unresolved, necessitating further phylogenetic treatment. For nearly 50 years the trematomids have been key subjects for physiological, ecological and behavioural studies that have revealed the basis of adaptation to the unique environmental conditions in the waters of the high Antarctic shelf. With regard to species diversity, numerical abundance, and ecological diversity, Trematomus species are the dominant component of the high Antarctic shelf fish fauna and are especially characteristic of the subzero waters of East Antarctica (DeWitt Reference DeWitt1971, Kock Reference Kock1992, Hureau Reference Hureau1994, La Mesa et al. Reference La Mesa, Caputo and Eastman2008, Kuhn et al. Reference Kuhn, Near, Jones and Eastman2009). Trematomus consists of 15 species and is a relatively young clade when compared to the entire Antarctic notothenioid clade with the most recent common ancestor dated at approximately 7.4 ± 0.3 million years with a time-calibrated molecular phylogeny (Near Reference Near2004).
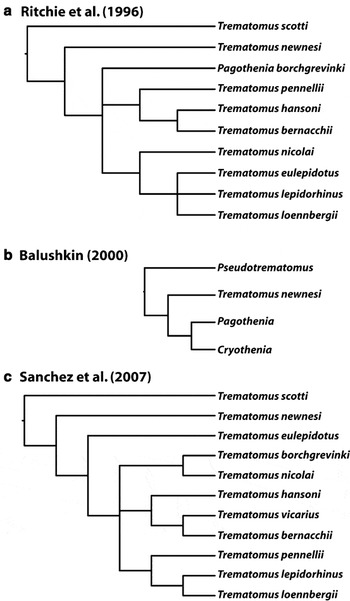
Ritchie et al. (Reference Ritchie, Bargelloni, Meyer, Taylor, Macdonald and Lambert1996) investigated phylogenetic relationships of Trematomus using partial sequences of the 12S and 16S mitochondrial 16S ribosomal RNA genes that resulted in phylogenetic trees with low bootstrap support (Fig. 1a). Based on analyses of discretely coded morphological characters, Balushkin (Reference Balushkin1982, Reference Balushkin2000) retained only T. newnesi in Trematomus, and classified all other species in Pseudotrematomus. Miller (Reference Miller1993) used this classification in his review of Antarctic fishes. In Balushkin’s (Reference Balushkin2000) phylogeny Trematomus newnesi was hypothesized as the sister species of a clade containing Cryothenia and Pagothenia (Fig. 1b). Sanchez et al. (Reference Sanchez, Dettaï, Bonillo, Ozouf-Costaz, Detrich and Lecointre2007) investigated Trematomus phylogeny using discretely coded morphological characters and partial gene sequence data from two mitochondrial gene regions (cytochrome b and the control region) and two nuclear loci (mixed lineage leukaemia-like protein (MLL) and rhodopsin) to estimate phylogenetic relationships of Trematomus. Trees resulting from separate analyses of mitochondrial and nuclear gene datasets were used to construct a supertree (Fig. 1c).
Previous phylogenetic hypotheses of Trematomus. a. Ritchie et al. (Reference Ritchie, Bargelloni, Meyer, Taylor, Macdonald and Lambert1996). b. Balushkin (Reference Balushkin2000). c. Sanchez et al. (Reference Sanchez, Dettaï, Bonillo, Ozouf-Costaz, Detrich and Lecointre2007).

Phylogenies inferred from both mitochondrial and nuclear gene sequence data suggest that Trematomus is monophyletic only when it includes both Pagothenia and Cryothenia (Ritchie et al. Reference Ritchie, Bargelloni, Meyer, Taylor, Macdonald and Lambert1996, Cziko & Cheng Reference Cziko and Cheng2006, Sanchez et al. Reference Sanchez, Dettaï, Bonillo, Ozouf-Costaz, Detrich and Lecointre2007, Near & Cheng Reference Near and Cheng2008, Kuhn et al. Reference Kuhn, Near, Jones and Eastman2009). Sanchez et al. (Reference Sanchez, Dettaï, Bonillo, Ozouf-Costaz, Detrich and Lecointre2007) have recommended that P. borchgrevinki and P. brachysoma be included in Trematomus. Other consistent phylogenetic results among multiple phylogenetic analyses include T. scotti as the sister species of all other Trematomus, and a sister species relationship between T. loennbergii and T. lepidorhinus (Ritchie et al. Reference Ritchie, Bargelloni, Meyer, Taylor, Macdonald and Lambert1996, Near et al. Reference Near, Pesavento and Cheng2004, Sanchez et al. Reference Sanchez, Dettaï, Bonillo, Ozouf-Costaz, Detrich and Lecointre2007, Near & Cheng Reference Near and Cheng2008). Another feature shared by all the published phylogenetic analyses of Trematomus is fairly low node support in trees resulting from maximum parsimony and model-based analyses.
In this paper we revisit the phylogenetic relationships of Trematomus using an increased taxon sampling and an expanded phylogenetic dataset that includes DNA sequences from two mitochondrial genes (ND2 and 16S rRNA) and one single-copy nuclear gene [ribosomal protein S7 intron 1 (RPS7)]. Specifically, we attempt to determine if datasets that contain a large sampling of DNA sequence data from the mitochondrial genome and a nuclear gene will result in phylogenetic trees that are better resolved with a large fraction of nodes supported with significant Bayesian posterior probabilities than observed previously. The molecular phylogenies generated in this study are used to determine if there are phylogenetic relationships that are consistent with investigations that used different types of data and analyses, and highlight where our analyses result in novel phylogenetic hypotheses for Trematomus. The taxonomic sampling includes all of the species in the clade except T. brachysoma that was formerly classified as Pagothenia, and T. peninsulae that was formerly classified as Cryothenia.
Materials and methods
Taxonomic sampling and DNA sequencing
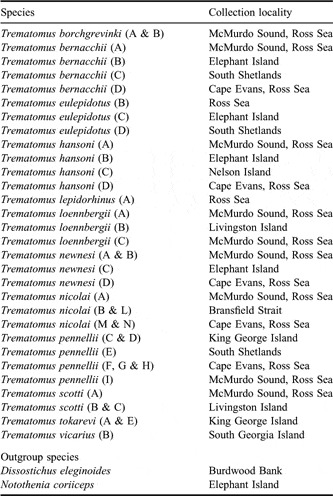
Taxonomic sampling for this study included 13 Trematomus species (including T. borchgrevinki and T. amphitreta, formerly classified in Pagothenia and Cryothenia respectively), and multiple specimens were sampled from all but two species (Table I). Two non-Trematomus species (Dissostichus mawsoni and Notothenia coriiceps) were used as outgroups in all analyses (Table I). We were unable to obtain DNA aliquots or tissue samples for Trematomus amphitreta (Cziko & Cheng Reference Cziko and Cheng2006); therefore analyses that included this species were limited to the two mitochondrial genes available on GenBank. Most specimens were collected on scientific research cruises, and DNA was extracted from frozen or ethanol preserved white muscle tissue, or pectoral fin clips, using the DNeasy Tissue Kit (Qiagen Inc., Valencia, CA) following manufacturer’s specifications.
Trematomus species sampled and their collection locality. Letters in parentheses represent each individual sampled from that species and locality.

Polymerase chain reaction (PCR) was used to amplify three gene regions, two mitochondrial and one nuclear intron. The entire mitochondrial encoded large ribosomal subunit (16S) was amplified using primers presented in Near et al. (Reference Near, Pesavento and Cheng2003). The mitochondrial protein-coding gene ND2 was amplified using primers presented in Kocher et al. (Reference Kocher, Conroy, McKaye, Stauffer and Lockwood1995). Primers for the nuclear encoded first intron of the ribosomal protein S7 (RPS7) were those used in Chow & Hazama (Reference Chow and Hazama1998). Reactions contained: 1 μl 25 mM MgCl (Qiagen Inc., Valencia, CA), 2.5 μl 10x CL PCR buffer (Qiagen Inc., Valencia, CA), 2.5 μl Q solution (Qiagen Inc., Valencia, CA), 0.5 μl 10 mM dNTP mix, 0.5 μl 10 mM forward primer, 0.5 μl 10 mM reverse primer, 0.3 μl Taq DNA Polymerase (Invitrogen Co., Carlsbad, CA), and 1.5 μl DNA template. PCR thermo-cycling conditions consisted of: an initial denaturation of 2 min at 94°C, followed by 30 cycles of denaturing at 94°C for 45 sec, annealing at 52°C to 55°C for 1 min, and extending at 72°C for 1 min, with a final extension of 5 min at 72°C.
Amplified PCR products were run on 1% agarose gels to verify amplification success, and PCR products were purified for sequencing using AMPure® beads according to manufacturer’s protocol (Agencourt Bioscience, Beverly, MA). Purified PCR products were used as templates for Big Dye (Applied Biosystems) cycle sequencing reactions. All templates were sequenced in both directions for a combined total of ∼3435 base pairs (bp) of sequence data from each specimen (∼1700 bp from 16S rRNA, 1047 bp from ND2 and ∼690 bp from RPS7). Sequences were read with an ABI 3730 capillary sequencer at the W.M. Keck Foundation Biotechnology Resource Laboratory at Yale University. Individual DNA sequences were edited and aligned using the programs SeqManII (DNASTAR Inc., Madison, WI), Sequencher v. 4.5 (Gene Codes, Ann Arbor, MI), and BioEdit (Hall Reference Hall1999). Complete mitochondrial and nuclear sequences for all individuals were submitted to GenBank (Accession numbers: AY256569 and FJ647713–FJ647752 for ND2, AY520126–AY520129 and FJ6747635–FJ647671 for 16S, and FJ647672–FJ647712 for RPS7).
Phylogenetic analyses
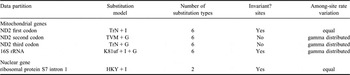
Five data partitions were identified among the three sequenced genes, one from each of the three codon positions of the ND2 gene, a single partition from the 16S rRNA gene, and a single partition from the RPS7 nuclear intron (Table II). The optimal model of molecular evolution for each partition was determined using a hierarchical maximum likelihood strategy as executed in the computer programme Modeltest 3.6 (Posada & Crandall Reference Posada and Crandall1998, Reference Posada and Crandall2001). Bayesian phylogenetic analyses were performed on the combined mitochondrial genes (16S rRNA and ND2), the nuclear encoded RPS7 intron 1, and a dataset that combined the mitochondrial and RPS7 intron 1 genes. In each analysis the optimal model was used for each of the data partitions with a partitioned Bayesian analysis using the computer program MrBayes 3.1 (Ronquist & Huelsenbeck Reference Ronquist and Huelsenbeck2003). In each analysis MrBayes 3.1 was run for 1.0 x 10⁷ generations using four chains and two simultaneous runs. Examination of the relationship of the likelihood score and the number of generations, and determination if the standard deviation of split frequencies between the two runs was less than 0.05 were used to assess convergence of model parameters and tree topology. Samples at generations prior to convergence were treated as the burn in and excluded. Support values for inferred clades in the molecular phylogenies were generated from Bayesian posteriors and nodes in the estimated phylogenies were considered significantly supported if they were recovered with posterior probabilities ≥ 0.95.
Summary of optimal models for data partitions selected for Bayesian mixed-model analysis.

Results and discussion
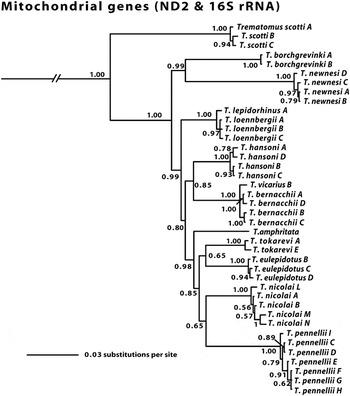
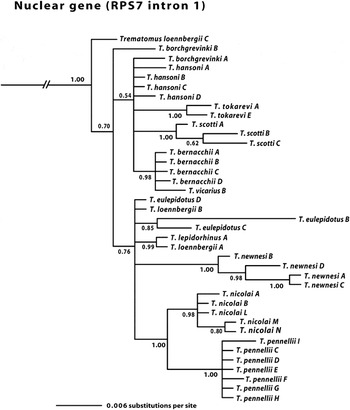
Between one and seven individuals from each species were sequenced for each of the three loci (Table I). Bayesian analyses of the combined mitochondrial DNA genes (ND2 and 16S rRNA) and the individual nuclear RPS7 locus resulted in phylogenies that differed substantially with regard to the number of nodes supported with significant posterior probabilities (Figs 2 & 3). Seven of twelve interspecific nodes in the mitochondrial phylogeny were supported with significant Bayesian posterior probabilities (Fig. 2). In contrast, three interspecific nodes in the nuclear RPS7 intron 1 phylogeny were supported with a significant posterior (Fig. 3). In the mitochondrial phylogeny T. borchgrevinki and T. amphitreta (classified in Pagothenia and Cryothenia, respectively) were nested in a monophyletic Trematomus, with T. amphitreta resolved as the sister lineage of a clade containing T. pennellii, T. nicolai, T. eulepidotus, and T. tokarevi. Nine of the ten species sampled with multiple individuals were reciprocally monophyletic in the mitochondrial phylogeny (Fig. 2), but only five species were reciprocally monophyletic in the RPS7 phylogeny (Fig. 3).
Phylogeny of Trematomus resulting from Bayesian analyses of the concatenated mitochondrial DNA dataset (2746 base pairs). Numbers at nodes represent Bayesian posterior probabilities.

Phylogeny of Trematomus resulting from Bayesian analyses of the nuclear ribosomal protein S7 locus (689 base pairs). Numbers at nodes represent Bayesian posterior probabilities.

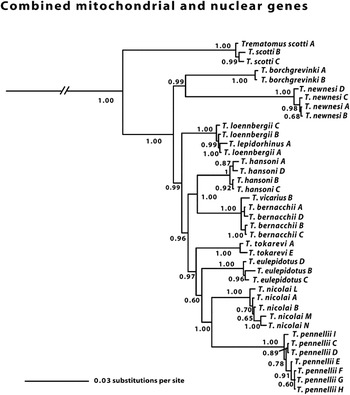
The Bayesian phylogeny resulting from analysis of the combined mitochondrial and nuclear gene datasets was well resolved, and contained ten interspecific nodes supported with significant Bayesian posteriors (Fig. 4). In this combined data phylogeny, T. scotti was the sister lineage of all other Trematomus species, a result consistent with several published studies (Ritchie et al. Reference Ritchie, Lavoué and Lecointre1997, Bargelloni & Lecointre Reference Bargelloni and Lecointre1998, Bargelloni et al. Reference Bargelloni, Zane, Derome, Lecointre and Patarnello2000, Near et al. Reference Near, Pesavento and Cheng2004, Sanchez et al. Reference Sanchez, Dettaï, Bonillo, Ozouf-Costaz, Detrich and Lecointre2007). Similar to the mitochondrial phylogeny, the combined data phylogeny indicated that within two sets of sister species, T. bernacchii–T. vicarius and T. loennbergii–T. lepidorhinus, species in each of these pairs exhibit very little genetic divergence and these species may not be reciprocally monophyletic (Fig. 4). The combined data phylogeny supported additional noteworthy clades that included T. pennellii and T. nicolai, T. hansoni and T. bernacchii–T. vicarius, and T. borchgrevinki and T. newnesi (Fig. 4). Some of these results are consistent with previous studies (Sanchez et al. Reference Sanchez, Dettaï, Bonillo, Ozouf-Costaz, Detrich and Lecointre2007, Near & Cheng Reference Near and Cheng2008); however, the monophyly of T. borchgrevinki and T. newnesi in our phylogeny differs from a previous analysis that supported monophyly of T. borchgrevinki and T. nicolai (Sanchez et al. Reference Sanchez, Dettaï, Bonillo, Ozouf-Costaz, Detrich and Lecointre2007). The monophyly of these cryopelagic species (T. borchgrevinki and T. newnesi) is consistent with Balushkin’s (Reference Balushkin2000) phylogenetic hypothesis based on morphology.
Phylogeny of Trematomus resulting from Bayesian analyses of the combined three gene mitochondrial DNA and nuclear dataset (3435 base pairs). Numbers at nodes represent Bayesian posterior probabilities.

This study encompasses the most complete sampling of Trematomus to date and demonstrates the utility of mitochondrial and nuclear gene sequences to develop robust and well supported species-level phylogenies for notothenioid clades. Bayesian analyses of combined mitochondrial and nuclear dataset resulted in phylogenies with greater node support than observed in analyses of mitochondrial or nuclear datasets alone. This study demonstrates that the addition of nuclear gene sequence data that tend to exhibit limited phylogenetic utility enhances phylogenetic resolution and node support with our analyses resulting in a well resolved phylogeny with appreciable Bayesian posterior support for most interspecific nodes. The results of the combined mitochondrial and nuclear Bayesian analyses provide further support for the inclusion of species previously classified in Pagothenia and Cryothenia in Trematomus; leading to a reduction in the recognized number of genera in Nototheniidae. The molecular phylogenies do not lend support for the recognition of Pseudotrematomus proposed by Balushkin (Reference Balushkin1982, Reference Balushkin2000) and presented in Fig. 1b. Future analyses of Trematomus relationships will explore the utility of additional nuclear loci to investigate strategies of species tree inference (e.g. Edwards et al. Reference Edwards, Liu and Pearl2007).
Acknowledgements
The authors thank C.D. Jones, the United States Antarctic Marine Living Resources Program (AMLR), and the officers and crew of the RV Yuzhmorgeologiya for providing support for the collection of specimens in the South Shetland Islands and to G. Hoffmann for kindly provided tissue samples from McMurdo Sound. The authors thank Joe Eastman for his valued comments and suggestions. This research was supported with funding from the Antarctic Science Bursary and the National Science Foundation (ANT-0839007 and DEB-0716155).