1. Introduction
During late Miocene time, the Mediterranean region was affected by the Messinian Salinity Crisis, one of the greatest evaporitic events in Earth's history. This crisis was characterized by a combination of tectonic processes (which led to a reduction in the exchange of water between the Mediterranean Sea and the Atlantic Ocean) and palaeoclimate conditions (a regional dry and warm climate) (Fauquette et al. Reference Fauquette, Suc, Bertini, Popescu, Warny, Taoufiq, Perez Villa, Chikhi, Feddi, Subally, Clauzon and Ferrier2006; Rouchy & Caruso, Reference Rouchy and Caruso2006; Di Stefano et al. Reference Di Stefano, Verducci, Lirer, Ferraro, Iaccarino, Hüsing and Hilgen2010; Mongelli et al. Reference Mongelli, Mameli, Oggiano and Sinisi2012 and references therein). Different basin scenarios have been hypothesized to explain the origin of the Messinian evaporites: a deep desiccated basin model, shallow-water desiccated basin model or deep non-desiccated basin model (Hsü, Ryan & Cita, Reference Hsü, Ryan and Cita1973; Nesteroff, Reference Nesteroff and Drooger1973; Selli, Reference Selli and Drooger1973), or the newer scenario proposed by CIESM (2008) composed of three stages. The first stage (5.96–5.6 Ma) is characterized by the onset of the Messinian Salinity Crisis and by the deposition of the so-called ‘Lower Evaporites’ (selenite in shallow basins and the Tripoli Formation). The second stage (5.6–5.55 Ma) is recorded by a relative sea-level drop and erosion of the evaporitic basins. Finally, the third stage (5.55–5.33 Ma) is characterized by clastic and evaporitic sedimentation (‘Upper Evaporites’) containing brackish to fresh-water faunas.
The ‘Calcare di Base’ is a lithostratigraphic unit composed of carbonate, marls and locally gypsum. The unit was formed during the Messinian Salinity Crisis and it crops out mainly in Sicily and Calabria. Its genesis and spatio-temporal distribution is still debated.
It is the first product of the Messinian evaporitic suite (Ogniben, Reference Ogniben1957). This formation has been interpreted either as an evaporitic and/or microbial deposit (Decima, Mckenzie & Schreiber, Reference Decima, Mckenzie and Schreiber1988; Barone et al. Reference Barone, Critelli, Le Pera, Di Nocera, Matano and Torre2006; Guido et al. Reference Guido, Jacob, Gautret, Laggoun-DéFarge, Mastandrea and Russo2007; Caracciolo et al. Reference Caracciolo, Gramigna, Critelli, Calzona and Russo2013). It grades laterally into primary selenite of the Lower Gypsum Unit (Roveri et al. Reference Roveri, Lugli, Manzi and Schreiber2008a ,Reference Roveri, Manzi, Gennari, Iaccarino and Lugli b ) above the lower Messinian Tripoli Formation or as a product of in situ collapse due to dissolution of intervening halite or gypsum beds (Pedley & Grasso, Reference Pedley and Grasso1993) laterally equivalent to primary selenite (Garcia-Veigas et al. Reference Garcia-Veigas, Orti, Rosell, Ayora, Rouchy and Lugli1995; Rouchy & Caruso, Reference Rouchy and Caruso2006). There are three main types of limestone deposits commonly included in the Calcare di Base (e.g. Manzi et al. Reference Manzi, Lugli, Roveri, Schreiber and Gennari2010): (i) sulfur-bearing limestones which were derived from post-depositional bacterial sulfate reduction (Dessau, Gonfi Antini & Tongiorgi, Reference Dessau, Gonfi Antini and Tongiorgi1959) (Calcare di Base-1); (ii) interbedded dolostones, sapropels and diatomites usually found at the top or above the Tripoli Formation (Calcare di Base-2); (iii) micritic limestones of evaporative and/or bacterial origin occurring as resedimented deposits, commonly brecciated, forming metre-thick beds associated with clastic gypsum (Calcare di Base-3).
The Calcare di Base have been recognized in the Rossano, Crotone, Catanzaro Trough, Crati and Amantea basins, and along the Tyrrhenian piedmont area (e.g. Critelli, Reference Critelli1999; Barone et al. Reference Barone, Dominici, Muto and Critelli2008; Cianflone & Dominici, Reference Cianflone and Dominici2011; Cianflone, Dominici & Sonnino, Reference Cianflone, Dominici and Sonnino2012; Caracciolo et al. Reference Caracciolo, Gramigna, Critelli, Calzona and Russo2013) (Fig. 1). In the northeastern Calabrian Foreland Basin, the Calcare di Base forms tabular bodies up to 45 m thick made up of carbonates interbedded with argillaceous marls (e.g. Barone et al. Reference Barone, Critelli, Le Pera, Di Nocera, Matano and Torre2006, Reference Barone, Dominici, Muto and Critelli2008).
Simplified geological map of the central-northern sector of the Calabria–Peloritani Arc with location of the mentioned basins and sites. 1 – Pliocene to Holocene sediments, and volcanic and volcaniclastic rocks; 2 – Upper Tortonian to Messinian clastic rocks and evaporites; 3 – Cilento Group (middle Miocene); 4 – San Donato, Verbicaro and Pollino units (Triassic to Miocene); 5 – Liguride Complex (Upper Jurassic to Upper Oligocene); 6 – Longobucco and Caloveto groups (Lower Jurassic to Lower Cretaceous) and Paludi Formation (Upper Oligocene); 7 – Sila, Castagna and Bagni basement units (Palaeozoic); 8 – Malvito, Diamante–Terranova, Gimigliano ophiolitiferous units (Upper Jurassic to Lower Cretaceous).

In the Rossano Basin, the lithostratigraphic unit of the Calcare di Base has been interpreted to have formed by microbial activity (Guido et al. Reference Guido, Jacob, Gautret, Laggoun-DéFarge, Mastandrea and Russo2007), although Manzi et al. (Reference Manzi, Lugli, Roveri, Schreiber and Gennari2010) interpreted the same outcrop as originating from gravity flows redepositing unconsolidated limestones. Barone et al. (Reference Barone, Dominici, Muto and Critelli2008) described the Calcare di Base as a 0–45 m thick lithostratigraphic unit characterized by massive and brecciated (with gypsum and halite pseudomorphs) limestone facies interbedded, in some areas, with 10–60 cm thick beds of massive and laminar argillaceous marls. The latter authors suggested an evaporitic and microbial origin followed by subaerial exposure, erosion and karstification producing a strong increase in sedimentary detritus (Barone et al. Reference Barone, Critelli, Le Pera, Di Nocera, Matano and Torre2006, Reference Barone, Dominici, Muto and Critelli2008).
The aim of this paper is to contribute to the debate on the origin of the Calcare di Base using a multidisciplinary study of facies analysis and geochemical and mineralogical tools on the argillaceous marls of the Rossano Basin.
The chemical and mineralogical composition of sediments provide important clues regarding palaeoenvironmental conditions at the time of deposition, including the nature of palaeoweathering and palaeoredox conditions, which yield insights into the palaeoclimate (e.g. Nesbitt & Young, Reference Nesbitt and Young1982; Wronkiewicz & Condie, Reference Wronkiewicz and Condie1989; Algeo & Maynard, Reference Algeo and Maynard2004; Peltola et al. Reference Peltola, Brun, Ström and Tomilina2008). The mineralogy and chemistry of clastic sedimentary rocks is affected by factors such as rock characteristics, chemical weathering, sorting processes during transport and sedimentation, and post-depositional diagenetic reactions (McLennan, Hemming & Hanson, Reference McLennan, Hemming and Hanson1993). Furthermore, geochemical proxies provide information on the parental affinity and source area(s) of clastic sediments (e.g. Fedo, Nesbitt & Young, Reference Fedo, Nesbitt and Young1995; Mongelli et al. Reference Mongelli, Critelli, Perri, Sonnino and Perrone2006, Reference Mongelli, Mameli, Oggiano and Sinisi2012; Critelli et al. Reference Critelli, Mongelli, Perri, Martìn-Algarra, Martìn-Martìn, Perrone, Dominici, Sonnino and Zaghloul2008; Perri et al. Reference Perri, Cirrincione, Critelli, Mazzoleni and Pappalardo2008, Reference Perri, Critelli, Mongelli and Cullers2011, Reference Perri, Critelli, Cavalcante, Mongelli, Dominici, Sonnino and De Rosa2012 a,Reference Perri, Critelli, Dominici, Muto, Tripodi and Ceramicola b , Reference Perri, Critelli, Martìn-Algarra, Martìn-Martìn, Perrone, Mongelli and Zattin2013; Zaghloul et al. Reference Zaghloul, Critelli, Perri, Mongelli, Perrone, Sonnino, Tucker, Aiello and Ventimiglia2010; Caracciolo et al. Reference Caracciolo, Le Pera, Muto and Perri2011; Perri, Muto & Belviso, Reference Perri, Critelli, Mongelli and Cullers2011; Perri, Reference Perri2014).
2. Geological settings
The Rossano Basin represents the southern sector of the Italian Foreland Basin System located on the northeastern margin of the Calabria–Peloritani Arc. The Calabria–Peloritani Arc represents a fault-bounded exotic terrane connecting the NW–SE-trending southern Apennines with the E–W-trending Sicilian Maghrebids (Critelli & Le Pera, Reference Critelli and Le Pera1995, Reference Critelli and Le Pera1998; Critelli, Reference Critelli1999; Bonardi et al. Reference Bonardi, Cavazza, Perrone, Rossi, Vai and Martini2001 and references therein). It is made up both of units involving pre-Alpine basements made of continental crust crystalline rocks and covered by Meso-Cenozoic sediments, as well as by ophiolitic units, some of them recording high-pressure/low-temperature Alpine metamorphism and a pre-Miocene tectonism.
The Rossano Basin is the inland portion of a larger Neogene to Quaternary basinal area including the entire Ionian Calabrian continental margin (the Crotone–Spartivento Basin). It was filled with an upper Serravallian to middle Pleistocene continental to deep-marine succession (Roda, Reference Roda1964, Reference Roda1967; Critelli, Reference Critelli1999; Van Dijk et al. Reference Van Dijk, Bello, Brancaleoni, Cantarella, Costa, Frixa, Golfetto, Merlini, Riva, Torricelli, Toscano and Zerilli2000, Barone et al. Reference Barone, Dominici, Muto and Critelli2008; Zecchin et al. Reference Zecchin, Caffau, Civile, Critelli, Di Stefano, Maniscalco, Muto, Sturiale and Roda2012, Reference Zecchin, Civile, Caffau, Muto, Di Stefano, Maniscalco and Critelli2013a ,Reference Zecchin, Caffau, Di Stefano, Maniscalco, Lenaz, Civile, Muto and Critelli b ; Tripodi, Muto & Critelli, Reference Tripodi, Muto and Critelli2013) that was a tectonically active basin up to the present (e.g. Zecchin et al. Reference Zecchin, Ceramicola, Gordini, Deponte and Critelli2011; Perri et al. Reference Perri, Critelli, Dominici, Muto, Tripodi and Ceramicola2012 b).
2.a. Stratigraphy of the Rossano Basin
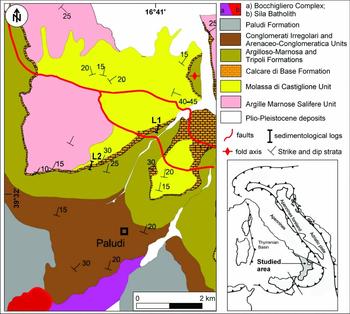
The base of the Rossano Basin is characterized by transgressive sediments of Serravallian?–Tortonian age that unconformably overlie the lower Miocene Paludi Formation and its underlying low-grade metamorphic (Bocchigliero Complex) and plutonic rocks (Sila Batholith) (e.g. Barone et al. Reference Barone, Dominici, Muto and Critelli2008; Bonardi et al. Reference Bonardi, De Capoa, Di Staso, Perrone, Sonnino and Tramontana2005) (Fig. 2).
Geological sketch map of the Rossano Basin (northeastern Calabria). L1 and L2 are the sedimentological logs shown in Figure 4.

The onset of sedimentation included alluvial conglomerates (Conglomerati Irregolari: Roda, Reference Roda1964), which are overlain by a nearshore succession consisting of sandstones and fossiliferous sandstones (Arenaceo–Conglomeratica Unit). The succession in turn passes upwards into deeper-water sediments (Argilloso–Marnosa Formation) characterized by an alternation of decimetric indurated dark clay and light greyish or light blue marl whose origin is related, at least in its upper part, to astronomical cyclicity (Barone et al. Reference Barone, Dominici, Muto and Critelli2008). During late Tortonian time, the Agilloso–Marnosa Formation received huge volumes of olistostromes eroded from the ‘Argille Scagliose Formation’ (Sicilide Complex: Ogniben, Reference Ogniben1955, Reference Ogniben1962). These rocks are composed of a variegated clay matrix and olistholiths of various types (calcarenite to calcilutite), marl, chert and quartzose sandstone, equivalent to the typical successions of the Sicilide Complex of the southern Apennines (Critelli & Le Pera, Reference Critelli and Le Pera1998; Critelli, Reference Critelli1999; Zecchin et al. Reference Zecchin, Caffau, Civile, Critelli, Di Stefano, Maniscalco, Muto, Sturiale and Roda2012).
The transgressive sedimentary fill evolved from cyclic alternations of shale and marl to biosiliceous clay of the Tripoli Formation, which delineates the Tortonian–Messinian boundary. The Tripoli Formation is overlain by the Calcare di Base Formation, which is formed in the studied sector (Figs 2, 3) by a tabular carbonate stratum composed of evaporites and microbial facies, and interbedded with laminar and massive clays and marls (e.g. Barone et al. Reference Barone, Dominici, Muto and Critelli2008).
Schematic stratigraphic column of the studied area.

The Calcare di Base Formation is overlain, above an erosional angular unconformity, by the Molassa di Castiglione Unit, made up of a basal conglomerate, breccias and cross- to planar stratification sandstones interpreted as nearshore deposits (e.g. Barone et al. Reference Barone, Dominici, Muto and Critelli2008).
The Argille Marnose Salifere Unit, consisting of a succession of halite and clayey marls with gypsum-bearing arenites, characterizes the eastern part of the Rossano Basin (Barone et al. Reference Barone, Critelli, Le Pera, Di Nocera, Matano and Torre2006). These gypsum-bearing arenites are graded and include plane-parallel lamination and ripple intervals; these deposits are interpreted as turbidites. The Argille Marnose Salifere Unit is overlain by large olistostrome bodies having olistoliths and large clasts of Mesozoic and Cenozoic limestone, marl, quartzarenite and chert of the Sicilide Complex terranes of the southern Apennines (e.g. Ogniben, Reference Ogniben1955, Reference Ogniben1969; Critelli, Reference Critelli1999; Critelli et al. Reference Critelli, Le Pera, Galluzzo, Milli, Moscatelli, Perrotta and Santantonio2007, Reference Critelli, Muto, Tripodi, Perri and Schattner2011, Reference Critelli, Muto, Tripodi and Perri2013; Tripodi, Muto & Critelli, Reference Tripodi, Muto and Critelli2013).
In the Rossano Basin, the transition from evaporitic to normal marine environments is characterized by the Garicchi Unit (marls and clays with thin turbidite sandstones) and Molassa di Palopoli (conglomerates and sandstones lobes), referred to fluvio-deltaic and deeper-water turbidite systems (e.g. R. Dominici, unpub. Ph.D. thesis, Univ. Calabria, 2005) (Fig. 3).
2.b. Facies associations
In the Rossano Basin the Calcare di Base crops out for about 3 km northeastward of Cropalati (Fig. 2). The unconformity erosionally truncates the limbs of asymmetric folds involving the Calcare di Base, which also underwent previous subaerial exposure, erosion and karstification. As a response to this folding and karstification event, related to both the Messinian Salinity Crisis and to the local regional tectonic phase (i.e. rifting of the southern Tyrrhenian Basin; Patacca, Sartori & Scandone, Reference Patacca, Sartori and Scandone1990), a marked increase in sedimentary detritus (Molassa di Castiglione) is detected.
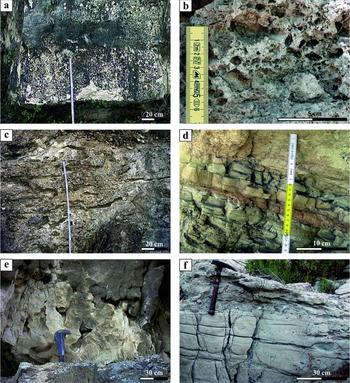
Based on facies and stratigraphic analyses carried out on two sedimentological logs (Fig. 4), we have recognized three facies associations (Fig. 5). The recognition of facies associations in the Calcare di Base in the Rossano Basin represents the first step towards the reconstruction of the sedimentary environment (e.g. R. Dominici, unpub. Ph.D. thesis, Univ. Calabria, 2005).
Sedimentological logs of the studied area showing the argillaceous marl samples studied in this work (L1 is the lower part of the stratigraphic succession, whereas L2 is the upper part). Sh – shale; SS – sandstone; Cgl – conglomerate; f – fine; m – medium; c – coarse; gr – gravel; pb –pebble; cb – cobble; bd – boulder.

Field photos of the facies associations. (a) Facies A consists of decimetre-thick massive limestone passing upwards to vacuolar mudstone. (b) Close-up view of a pocket characterized by evaporitic pseudomorphs of Facies A. (c) Facies B consists of decimetre-sized clay chips and rip-up clasts of argillaceous marls floating in a micritic matrix. (d) Green and orange argillaceous marls and centimetre-thick layers of graded calcilutite (Facies C). (e) Vadose and phreatic conduits affected the Calcare di Base Formation. (f) Close-up view of clastic facies formed by centimetre-thick graded calcarenites and decimetre-thick limestone gypsum breccias.

These two sedimentological logs are characterized by peculiar argillaceous marl beds, which represent important stratigraphic markers (Fig. 4).
2.b.1. Facies A
Facies A consists of decimetre-thick beds of massive limestone made up of micritic, peloidal mudstone or wackestone with minor quartz, feldspar grains and fragments of phyllite and siltstones, interbedded with decimetre-sized vacuolar lenses characterized by gypsum and halite moulds and carbonate pack breccia and float breccia (Fig. 5a, b). The clasts consist of beige and light green, folded or flat pebbles derived from calcilutite.
2.b.2. Facies B
Facies B consists of decimetre-thick, channelled limestone bodies marked by erosional surfaces filled with clay chips, flat pebbles and rip-up clasts within a planar to wavy fine lamination that is generally oriented parallel to layering but sometimes shows oblique laminae (Fig. 5c). Facies B is commonly related to Facies A.
2.b.3. Facies C
Facies C is characterized by decimetre- to centimetre-thick layers of varicoloured, argillaceous marls, which show planar or gently undulating laminae and ripples. Some centimetre-thick rippled layers of graded calcilutite are interbedded with argillaceous marls (Fig. 5d). In some outcrops the contact between Facies C and Facies A and B is associated with cylindrical or conical depressions perpendicular to bedding and filled by breccias, which are interpreted as phreatic conduits and vadose channels (Fig. 5e). Facies A and Facies B pass laterally into a clastic facies that is also interbedded with Facies C. This clastic facies consists of decimetre- to centimetre-thick calcarenite beds with minor siliciclastic lithic grains and massive to graded breccias containing abundant clay chips, nodular gypsum, minor granite, low-grade metamorphic clasts and rounded sandstone pebbles (Fig. 5f).
Facies A is interpreted as being related to bacterial activity, which induced carbonate precipitation, as suggested by Guido et al. (Reference Guido, Jacob, Gautret, Laggoun-DéFarge, Mastandrea and Russo2007). Furthermore the presence of moulds and pseudomorphs of carbonate minerals after evaporite minerals (gypsum and halite) within lenses of carbonate pack breccia and float breccia highlights the growth of evaporitic crystal clusters from groundwater brines in the vadose zone. Facies A is interbedded with Facies B. This can be interpreted as a result of the filling of small tidal channels that dissect intertidal environments.
Facies C records a sharp transition from hypersaline brine (mesohaline–penesaline) to normal saline seawater, probably related to rainfall episodes. In these conditions the sedimentation is driven by erosion processes of the carbonate facies and sedimentary and crystalline units of the continental areas. At the same time, karst processes related to the relative change in sea level affect the Calcare di Base.
The facies observed in the Calcare di Base in the Rossano Basin suggest a shallow marine environment where carbonate precipitation was controlled by bacterial activity followed by diagenesis in the vadose zone by growth and dissolution of evaporite minerals. The association of Facies A, Facies B and Facies C can be interpreted as having been formed in a typical subtidal–intertidal environment. The clastic facies is mainly derived from the erosion of Facies A and Facies B and from Miocene terrigenous units and metamorphic–plutonic rocks of the Sila Unit, formed by gravity deposits located along a gentle ramp (e.g. Critelli & Le Pera, Reference Critelli and Le Pera1998; Le Pera, Critelli & Sorriso-Valvo, Reference Le Pera, Critelli and Sorriso-Valvo2000; Le Pera et al. Reference Le Pera, Arribas, Critelli and Tortosa2001; R. Dominici, unpub. Ph.D. thesis, Univ. Calabria, 2005).
3. Sampling and methods
A set of 16 argillaceous marl samples from beds interlayered within the Calcare di Base Formation (Fig. 4) were collected along the Rossano Basin (Figs 1, 2).
Samples were cleaned for geochemical analyses. Weathered coats and veined surfaces were cut off. The rocks were crushed and milled in an agate mill to a very fine powder.
The powder was disaggregated in an ultrasonic bath at low power for a few minutes. The mineralogy of the whole-rock powder was obtained by X-ray diffraction (XRD) using a Philips 1710 diffractometer (CuKα radiation, graphite secondary monochromator, sample spinner; step size 0.02; speed 3 sec for each step) at the Università della Calabria (Italy). Semiquantitative mineralogical analysis of the bulk rock was carried out on random powders measuring peak areas using the WINFIT computer program (Krumm, Reference Krumm1996).
Elemental analyses for major and some trace element (Nb, Zr, Y, Sr, Rb, Ba, Ni, Co, Cr, V) concentrations were obtained using X-ray fluorescence spectrometry (Philips PW 1480) at the Università della Calabria (Italy), on pressed powder discs of whole-rock samples (prepared by milling to a fine-grained powder in an agate mill) and compared to international standard rock analyses of the United States Geological Survey. X-ray counts were converted into concentrations by a computer program based on the matrix correction method according to Franzini, Leoni & Saitta (Reference Franzini, Leoni and Saitta1972) and Leoni & Saitta (Reference Leoni and Saitta1976). Total loss on ignition (LOI) was determined by heating the samples for three hours at 900°C. Instrumental Neutron Activation Analysis (INAA) at the Activation Laboratories (Ancaster, Canada) was used to determine the abundance of the rare earth elements (REEs; La, Ce, Nd, Sm, Eu, Yb and Lu) and Sc, Cs and Th. The estimated precision and accuracy for trace element determinations are better than 5%, except for those elements having a concentration of 10 ppm or less (10 to 15%) (e.g. Boström & Bach, Reference Boström, Bach, Batiza, Storms and Allan1995; Melaku et al. Reference Melaku, Wondimu, Dams and Moens2004; Mongelli et al. Reference Mongelli, Critelli, Perri, Sonnino and Perrone2006; Perri et al. Reference Perri, Critelli, Mongelli and Cullers2011; Liu et al. Reference Liu, Hu, Li and Gao2013).
The chemical composition of sediments (e.g. Th, Sc and REEs) is well suited to provenance and tectonic setting determination studies, because of their relatively low mobility during sedimentary processes (e.g. McLennan, Hemming & Hanson, Reference McLennan, Hemming and Hanson1993; Cullers, Reference Cullers2000; Cullers & Podkovyrov, Reference Cullers and Podkovyrov2002; Mahjoor, Karimi & Rastegarlari, Reference Mahjoor, Karimi and Rastegarlari2009 and references therein). The relative distribution of the immobile elements, which differ in concentration in felsic and basic rocks such as La and Th (enriched in felsic rocks) and Sc, Cr and Co (enriched in basic rocks relative to felsic rocks), has been used to infer the relative contribution of felsic and basic sources in fine-grained sediments from different tectonic environments (e.g. Wronkiewicz & Condie, Reference Wronkiewicz and Condie1989). The REE pattern of fine-grained siliciclastic sediments and some elemental ratios are assumed to reflect the exposed crustal abundances in the source area (McLennann, Hemming & Hanson, Reference McLennan, Hemming and Hanson1993; Mongelli, Cullers & Muelheisen, Reference Mongelli, Cullers and Muelheisen1996; Cullers, Reference Cullers2000; Mongelli, Reference Mongelli2004, among others).
4. Mineralogy
The results of the whole-rock XRD analyses are shown in Table 1. The argillaceous marls are mainly composed of phyllosilicates (mostly illite, chlorite, illite/smectite mixed layers and traces of kaolinite) and CaCO3 phases (calcite and aragonite), which prevail over quartz, dolomite and minor/trace amounts of gypsum, feldspars and celestine. Phyllosilicates range from 37% to 57% of the total abundances of the minerals. The CaCO3 phases (calcite and aragonite) are the second most abundant minerals, with values ranging from 16% to 37% for calcite and up to 3% for aragonite. Quartz is also abundant (ranging from 15% to 27%); dolomite shows values up to 6%, whereas feldspars (both K-feldspars and plagioclase), gypsum and celestine are minor or present in trace amounts in many samples (Table 1).
Mineralogical composition of the bulk rock (weight per cent)

Qtz – quartz; ∑phy – sum of phyllosilicates; Feld – feldspars (K-feldspars+plagioclase); Dol – dolomite; Calc – calcite; Arag – aragonite; Gyp – gypsum; Celest – celestine; tr – trace.
5. Whole-rock geochemistry
To better examine the geochemical features of the studied samples, the argillaceous marl compositions are normalized to standard clay-rich lithologies of the PAAS (Post-Archaean Australian Shale; Taylor & McLennan, Reference Taylor and McLennan1985) (Fig. 6). The elemental concentrations and the ratios are given in Table 2; means, standard deviations and ranges of values for the elemental contents and some ratios are given in Table 3.
Distribution of major and trace elements and ratios in the studied samples

Means, standard deviations and ranges of elemental concentrations and ratios of the studied samples

St. Dev. – standard deviation; Min. – minimum value; Max. – maximum value.
Major and trace element compositional ranges normalized to the PAAS (Post-Archaean Australian Shale; Taylor & McLennan, Reference Taylor and McLennan1985).

Ca and Sr share the same distribution over the entire studied succession, matching the abundance of the CaCO3 phases, such as calcite and aragonite. Sr, however, is strongly enriched relative to the PAAS, rather than Ca, since its distribution is also related to celestine, occurring in many samples as a minor or trace phase. Mg is enriched relative to the PAAS due to the abundance of dolomite (Table 1). Furthermore, a weak correlation between Mg and Si, Al and Fe suggests that clay minerals played a minor role in hosting Mg, indicating that Mg fluctuations are influenced mainly by the distribution of dolomite.
The Si, Ti, Al, Na, K and P concentrations have a similar distribution throughout the succession, and are generally depleted relative to values for the PAAS. The degree of depletion of Na, K and Al is probably related to the paucity of feldspars (Fig. 6). Nb, having a similar geochemical behaviour to that of Ti, is strongly depleted in concentration relative to that in the PAAS (Fig. 6).
Fe, Mn and the TEs (transition trace elements; e.g. Sc, V, Cr, Co and Ni) yield a trend similar as those in the PAAS, with some samples showing a weak enrichment relative to the PAAS (Fig. 6). Fe, showing a positive correlation with all TEs, is hosted by mica-like clay minerals; thus, the supply of these elements, having the same mineralogical controls on their distribution, is mainly related to the presence of clay minerals.
The distributions of HFSEs (high-field-strength elements; e.g. REEs, Zr, Th and Y) are different; Th and Y concentrations, similarly to Nb, are strongly depleted relative to those in the PAAS, whereas Zr is enriched in many samples (Fig. 6). Most investigations have reported rather low concentrations of REEs in sedimentary carbonate rocks (e.g. Taylor & McLennan, Reference Taylor and McLennan1985). In marine carbonates, a distinct Ce depletion is common, reflecting the Ce depletion in seawater relative to the other REEs (Taylor & McLennan, Reference Taylor and McLennan1985). The studied samples show low total REE contents (average ΣREE = 77.89±7.30); both light rare earth elements (LREEs) and heavy rare earth elements (HREEs) are depleted relative to the PAAS and Upper Continental Crust (UCC) values (Fig. 7). Generally, the chondrite-normalized REE patterns (Fig. 7) show a marked LREE to HREE fractionation (values of (La/Yb)ch ranging from 7.96 to 11.89, with many samples characterized by (La/Yb)ch values higher than those of the PAAS and UCC and a mean of (La/Yb)ch = 9.70±0.96; Table 3) compared to the PAAS (9.17) and UCC (9.21), and a negative Ce anomaly (Ce/Ce* = 0.74±0.04) typical of a seawater environment.
Rare earth element compositional ranges, chondrite-normalized (Taylor & McLennan, Reference Taylor and McLennan1985). The plot of the Post-Archaean Australian Shale (PAAS) and the Upper Continental Crust (UCC; McLennan, Taylor & Hemming, Reference McLennan, Taylor, Hemming, Brown and Rushmer2006) is shown for comparison.

The LILEs (large ion lithophile trace elements; e.g. Rb, Cs and Ba) are associated in sediments with the detrital minerals (e.g. Plank & Langmuir, Reference Plank and Langmuir1998). The Rb, Cs and Ba concentrations, similar to K, are depleted relative to those in the PAAS (Fig. 6). In the present case, the ‘lack’ of feldspar means that Rb, Cs and K are likely hosted by the 2:1 clay minerals as revealed by XRD analysis.
6. Discussion
6.a. Palaeoweathering, palaeoclimate and depositional environment
Various indices have been used to reconstruct palaeoweathering conditions, including the chemical index of alteration (CIA; Nesbitt & Young, Reference Nesbitt and Young1982), the chemical index of weathering (CIW; Harnois, Reference Harnois1988), the plagioclase index of alteration (PIA; Fedo, Nesbitt & Young, Reference Fedo, Nesbitt and Young1995) and the weathering index (Ohta & Arai, Reference Ohta and Arai2007). The CIA is expressed as the molar volumes of (Al/(Al+Ca*+Na+K))×100, where Ca* represents the CaO only from the silicate fraction (Nesbitt & Young, Reference Nesbitt and Young1982). As the samples contain some carbonate, the CPA (chemical proxy of alteration) after Buggle et al. (Reference Buggle, Glaser, Hambach, Gerasimenko and Marković2011) (or CIW, chemical index of weathering after Cullers, Reference Cullers2000) is often additionally used. In this study, both the CIA (Nesbitt & Young, Reference Nesbitt and Young1982; with the CaO values of the silicate fraction only) and the CIA′ (the molar volumes of (Al/(Al+Na+K))×100 and, thus, calculated without the CaO content) have been used.
The argillaceous marls have CIA values (average CIA = 69.05±3.14) typical of moderate palaeoweathering conditions. The A–CN–K plot (Fig. 8a) of the samples show a weathering trend parallel to the A–CN edge, departing from a granitic source towards the shale composition and indicating non-steady-state weathering conditions. Tectonism and climate generally determine the relative rates of erosion and chemical weathering (Taylor & McLennan, Reference Taylor and McLennan1985; McLennan, Hemming & Hanson, Reference McLennan, Hemming and Hanson1993). The pattern in the A–CN–K plot (Fig. 8a) is typical of a source area in which active tectonism allows erosion of all zones within weathering profiles developed on source rocks (Nesbitt, Fedo & Young, Reference Nesbitt, Fedo and Young1997). Furthermore, the samples are characterized by a weathering trend (Fig. 8b) and CIA′ (average CIA′ = 75.38±1.21) similar to CIA values, also testifying to moderate palaeoweathering conditions.
(a) Ternary A–CN–K and (b) A–N–K diagrams. Legend: Gr – granite; Ms – muscovite; Il – illite; Ka – kaolinite; Ch – chlorite; Gi – gibbsite; Sm – smectite; Bi – biotite; Pl – plagioclase; Ks – K-feldspar; A – Al2O3; CN – CaO+Na2O; K – K2O; CIA – Chemical Index of Alteration (Nesbitt & Young, Reference Nesbitt and Young1982).

As a broad measure of weathering, it is possible to use certain molecular ratios. The Rb/K ratio has been used to monitor palaeoweathering because both K and Rb are incorporated into clay minerals and because K is preferentially leached over Rb with increased intensity of weathering (e.g. Wronkiewicz & Condie, Reference Wronkiewicz and Condie1989; Peltola et al. Reference Peltola, Brun, Ström and Tomilina2008).
Very low values of Rb/K (< 0.01) are found for the argillaceous marls, indicating weak to moderate weathering in a dry climate (e.g. Mongelli et al. Reference Mongelli, Mameli, Oggiano and Sinisi2012), which is also indicated by the mineralogical composition. The moderate weathering may have occurred under slightly warmer conditions than those of the present, as reported by Matson & Fox (Reference Matson and Fox2010) for SE Spain. Slight variations of K/Rb ratios suggest that persistent, dry and warm conditions changed to conditions characterized by alternating dry and relatively wet periods, typical of the climatic cycle in savannah regions (e.g. Mongelli et al. Reference Mongelli, Mameli, Oggiano and Sinisi2012).
The argillaceous marls are characterized by higher variations in Sr compared to the other trace elements. In sedimentary processes, the distribution of Sr is affected both by strong adsorption on clay minerals and extensive substitution of Sr2+ for Ca2+ in carbonate minerals (aragonite > calcite) (e.g. Salminen et al. Reference Salminen, Batista, Bidovec, Demetriades, De Vivo, De Vos, Duris, Gilusis, Gregorauskiene, Halamic, Heitzmann, Lima, Jordan, Klaver, Klein, Lis, Locatura, Marsina, Mazreku, O’Connnor, Olsson, Otteen, Petersell, Plant, Reeder, Salpeteur, Sandstrom, Siwers, Steenfelt and Tarvainen2005). High Sr/Ca ratios in carbonate sediments are inferred to correspond to aragonite enrichment (Thomson et al. Reference Thomson, Crudeli, De Lange, Slomp, Erba and Corselli2004). The Sr distribution is generally controlled by the preferential incorporation into the Ca sites, such as in the aragonite structure in which Sr and Ca show a good correlation. In the present case, Sr is weakly correlated with Ca, testifying to a main link to celestine precipitation and adsorption on clay minerals, as shown by XRD analyses (Table 1). Furthermore, higher Sr concentrations are typical of marine to hypersaline environments (e.g. Land, Reference Land, Zenger, Dunham and Ethington1980), whereas lower Sr concentrations characterize ancient marine or marine–meteoric environments (Machel & Anderson, Reference Machel and Anderson1989). The incorporation of Sr2+ into aragonite appears to be independent of salinity (Gaetani & Cohen, Reference Gaetani and Cohen2006). Sr variations, ranging from 1719 ppm to 14881 ppm (Table 2), suggest a transition from depositional environments, characterized by normal marine waters and normal evaporation, to hypersaline environments with strong evaporation. As a whole, these data seem to reflect that deposition probably occurred in a semi-closed marine environment subject to hypersalinity with local periodic input of meteoric water (e.g. Guido et al. Reference Guido, Jacob, Gautret, Laggoun-DéFarge, Mastandrea and Russo2007).
6.b. Parental affinity, sorting and recycling
REEs and Th, among the HFSEs, and some transition elements, including Sc, V and Ni, can constrain the average source area composition (e.g. Taylor & McLennan, Reference Taylor and McLennan1985; McLennan, Hemming & Hanson, Reference McLennan, Hemming and Hanson1993; Cullers & Podkovyrov, Reference Cullers and Podkovyrov2002). The abundance of Cr and Ni in clastic sediments is considered a useful indicator in provenance studies. According to Wrafter & Graham (Reference Wrafter and Graham1989) a low concentration of Cr indicates a felsic provenance, whereas high contents of Cr and Ni are mainly found in sediments derived from ultramafic rocks (Armstrong-Altrin et al. Reference Armstrong-Altrin, Lee, Verma and Ramasamy2004). The Cr/Ni ratios are low for the argillaceous marls (average = 1.28). Furthermore, the Th/Cr ratios (average = 0.06) are lower than those of the PAAS (Th/Cr = 0.13; Taylor & McLennan, Reference Taylor and McLennan1985) and the UCC (Th/Cr = 0.13; McLennan, Taylor & Hemming, Reference McLennan, Taylor, Hemming, Brown and Rushmer2006). The La/Sc, Th/Sc, Th/Co, Th/Cr and Cr/Th ratios are significantly different in felsic and basic rocks and may also allow constraints on the average provenance composition (Wronkiewicz & Condie, Reference Wronkiewicz and Condie1989; Cox, Lowe & Cullers, Reference Cox, Lowe and Cullers1995). These elemental ratios of argillaceous marls are compared with those of sediments derived from felsic and basic rocks as well as to the UCC (McLennan, Taylor & Hemming, Reference McLennan, Taylor, Hemming, Brown and Rushmer2006) and the PAAS (Taylor & McLennan, Reference Taylor and McLennan1985) values (Table 4). The average values of the argillaceous marls fall within the range of felsic rocks. In addition, the average values of the studied samples are close to those of the PAAS and UCC (Table 4), suggesting a felsic nature of the source rocks. Felsic igneous rocks are generally enriched in Zr relative to mafic lithologies (e.g. Salminen et al. Reference Salminen, Batista, Bidovec, Demetriades, De Vivo, De Vos, Duris, Gilusis, Gregorauskiene, Halamic, Heitzmann, Lima, Jordan, Klaver, Klein, Lis, Locatura, Marsina, Mazreku, O’Connnor, Olsson, Otteen, Petersell, Plant, Reeder, Salpeteur, Sandstrom, Siwers, Steenfelt and Tarvainen2005). Many argillaceous marls show Zr enrichment relative to the PAAS. Thus, elevated total Zr values are indicative of provenance from felsic rocks, especially intrusive granitoids (e.g. Salminen et al. Reference Salminen, Batista, Bidovec, Demetriades, De Vivo, De Vos, Duris, Gilusis, Gregorauskiene, Halamic, Heitzmann, Lima, Jordan, Klaver, Klein, Lis, Locatura, Marsina, Mazreku, O’Connnor, Olsson, Otteen, Petersell, Plant, Reeder, Salpeteur, Sandstrom, Siwers, Steenfelt and Tarvainen2005) such as the Sila Batholith. The Th/Co versus La/Sc plot may be used to discriminate sediments from silicic sources from those from progressively more basic sources (Fig. 9). The argillaceous marls fall within the silicic rock field. Furthermore, the La–Th–Sc diagram (Fig. 10) may be used to discriminate the source area composition and the tectonic setting (e.g. Bhatia & Crook, Reference Bhatia and Crook1986; Cullers, Reference Cullers1994). In this diagram, the argillaceous marls fall in a region close to the PAAS and the UCC, again suggesting a mostly silicic provenance (Fig. 10). To better constrain the felsic versus mafic or ultramafic character of the detritus, the V–Ni–La*4 ternary diagram (Fig. 11) has been used with fields representative of felsic, mafic and ultramafic rocks (e.g. Bracciali et al. Reference Bracciali, Marroni, Luca and Sergio2007; Perri, Muto & Belviso, Reference Perri, Muto and Belviso2011). As a general rule, the studied samples plot close to the UCC and PAAS area, reflecting the felsic composition of the source areas (Fig. 11).
Range of elemental ratios of studied samples compared to the ratios those of felsic and mafic rocks, Upper Continental Crust (UCC) and Post-Archaean Australian Shale (PAAS)

1Cullers (Reference Cullers1994, Reference Cullers2000); Cullers & Podkovyrov (Reference Cullers and Podkovyrov2002); 2McLennan, Taylor & Hemming (Reference McLennan, Taylor, Hemming, Brown and Rushmer2006); 3Taylor & McLennan (Reference Taylor and McLennan1985).
Th/Co versus La/Sc diagram for argillaceous marls (fields after Cullers, Reference Cullers2002).

La–Th–Sc diagram (after Bhatia & Crook, Reference Bhatia and Crook1986). The studied samples fall in a region close to the PAAS and the UCC point that rules out important mafic supply.

V–Ni–La*10 ternary diagram, showing fields representative of felsic, mafic and ultramafic rocks plot separately (e.g. Bracciali et al. Reference Bracciali, Marroni, Luca and Sergio2007; Perri, Muto & Belviso, Reference Perri, Muto and Belviso2011). The studied samples plot close to the felsic composition and to the Palaeozoic basement rocks analysed in this work.

Transport and deposition of clastic sediments involve mechanical sorting affecting the chemical composition of terrigeneous sediments and the distribution of provenance and palaeoweathering proxies (Perri et al. Reference Perri, Critelli, Martìn-Algarra, Martìn-Martìn, Perrone, Mongelli and Zattin2013 and references therein). The distribution of the chemical components within a suite is mainly determined by the mechanical properties of the host minerals. The process basically fractionates Al (clay minerals) from Si (quartz and feldspars). Sorting also fractionates Ti, which is mostly present in clay minerals and Ti oxides, from Zr, which occurs in zircon and is sorted with quartz. Ternary plots based on Al, Ti and Zr may used to illustrate the presence of sorting-related fractionations, which are recognized by simple mixing trends on a ternary Al–Ti–Zr diagram (Garcia, Coehlo & Perrin, Reference Garcia, Coehlo and Perrin1991). The argillaceous marls show a mixing trend, mostly characterized by changes in the Al/Zr ratio, which could be due to a recycling effect (Fig. 12). The presence of sorting-related fractionations may also be evaluated when the Zr/Sc ratio (Cox, Lowe & Cullers, Reference Cox, Lowe and Cullers1995) is plotted against the Th/Sc ratio (indicator of chemical differentiation; McLennan, Hemming & Hanson, Reference McLennan, Hemming and Hanson1993). The studied samples are not clustered along the primary compositional trend but fall along a trend involving zircon addition and thus sediment recycling (Fig. 13), consistent with the Al–Ti–Zr diagram.
Ternary 15Al2O3–300TiO2–Zr plot (Garcia, Coehlo & Perrin, Reference Garcia, Coehlo and Perrin1991) showing possible sorting effects for the studied samples.

Th/Sc versus Zr/Sc plot (after McLennan, Hemming & Hanson, Reference McLennan, Hemming and Hanson1993). Samples depart from the compositional trend indicating zircon addition suggestive of a recycling effect. Rock average compositions (Rhyolite, Dacite and Andesite) are from Lacassie, Hervè & Roser (Reference Lacassie, Hervè and Roser2006).

7. Concluding remarks
During late Miocene time, Calabria was affected by climatic and environmental changes that involved the entire Mediterranean Basin following the Messinian Salinity Crisis. The Messinian argillaceous marls, interbedded within the Calcare di Base Formation in the Rossano Basin, provide new insight into one of the most intensively studied evaporitic events of the Earth's history. These deposits comprise an admixture of clay minerals, carbonates and quartz with a minor amount of gypsum, feldspars and celestine. The analysed samples show some geochemical and mineralogical differences, reflecting changes in climatic and environmental conditions. Messinian argillaceous marls record deposition that probably occurred in a semi-closed marine environment mainly subject to hypersalinity with local episodes of meteoric water influx, during a period characterized by persistent dry and warm/arid conditions alternating with relatively wet phases, typical of the climatic cycle in savannah regions. The presence of celestine indicates concentration of SO4 2− in the solution from which dolomite formed, as also observed in many modern hypersaline environments (e.g. Corzo et al. Reference Corzo, Luzon, Mayayo, Van Bergeijk, Mata and Garcia De Lomas2005; Last & Ginn, Reference Last and Ginn2005). Bacterial degradation of organic matter produced CO2 and ammonia, thereby increasing alkalinity, which may further explain the formation of dolomite under hypersaline conditions (Sánchez-Román et al. Reference Sánchez-Román, McKenzie, de Luca Rebello Wagener, Rivadeneyra and Vasconcelos2009).
The geochemical proxies indicate a felsic composition for the source area(s), mainly characterized by the Sila Unit and granitoids of the Sila Batholith. The weathering indices indicate moderate palaeoweathering conditions related to a source area where active tectonism allows erosion of all zones within weathering profiles developed on source rocks. Furthermore, the presence of sorting-related fractionations and, thus, sediment recycling is also evaluated using the Th/Sc versus Zr/Sc plot and the Al–Ti–Zr diagram.
Acknowledgements
This research is part of Rocco Dominici's Ph.D. thesis ‘Relazioni tra sedimentazione clastica, evaporitica nel sistema di bacino di foreland in Calabria nord orientale’. This research has been carried out within the MIUR-ex60% Projects (Relationships between Tectonic Accretion, Volcanism and Clastic Sedimentation within the Circum-Mediterranean Orogenic Belts, 2006–2013; Resp. S. Critelli), the 2009 MIURPRIN Project 2009PBA7FL_001 ‘The Thrace sedimentary basin (Eocene–Quaternary) in Greece and Bulgaria: stratigraphic depositional architecture and sediment dispersal pathway within post-orogenic basins’. (Resp. S. Critelli). The authors are indebted to Agustín Martín-Algarra, one anonymous referee and the Editor Andy Whitham for their reviews, discussion and suggestions on an early version and the final version of the article.