Cyclopes is a genus of anteaters, commonly referred to as silky anteaters, that includes the smallest extant anteaters. The genus is included in the family Cyclopedidae Pocock 1924, within the suborder Vermilingua Illiger 1811 (Pilosa, Xenarthra), which also contains giant anteaters (Myrmecophaga Linnaeus 1758) and tamanduas (Tamandua Gray 1825) of the family Myrmecophagidae Gray 1825 (Gardner 2005, 2007). The taxonomy of the genus Cyclopes was recently revised from including one extant species to seven (Miranda et al. Reference Miranda, Casali, Perini, Machado and Santos2018). Cyclopes didactylus (Linnaeus 1758) is the member of the genus with the largest geographic distribution. This small anteater inhabits Neotropical forests from Venezuela to the northeastern Amazon and the northern Atlantic Forest in Northeast Brazil, with an apparent disjunction between these two biomes (Miranda et al. Reference Miranda, Meritt, Tirira and Arteaga2014, Reference Miranda, Casali, Perini, Machado and Santos2018, see Figure 1).
Known distribution of Cyclopes didactylus with geographic occurrence records and genetic populations. Black circles represent occurrence records according to the recent taxonomic revision (Miranda et al. Reference Miranda, Casali, Perini, Machado and Santos2018). Yellow diamonds show Amazonian populations, and red diamonds show Northeast populations. Shaded areas show the biomes, blue lines show rivers, and green areas show tropical rainforests. Illustration of C. didactylus by Eisenberg and Redford (2000). The figure was generated in QGIS (2021) and the geographical reference system used was WGS-84.

Previous studies showed that ancestral populations of C. didactylus would have dispersed from Amazonian to Atlantic forests through historical connections in Northeast Brazil about 3 million years ago (Coimbra et al. Reference Coimbra, Miranda, Lara, Schetino and Santos2017, Miranda et al. Reference Miranda, Casali, Perini, Machado and Santos2018). However, a sampling gap exists along this region of probable connection and the hypothesis of a disjunct distribution remains uncertain. The advancement of geographic information systems and the ability to access numerous environmental variables at different scales (Hijmans et al. Reference Hijmans, Cameron, Parra, Jones and Jarvis2005) has made it possible to predict the potential distribution pattern of species, totally in terms of their ecological niche (Peterson Reference Peterson2006, Phillips Reference Phillips2006, Soberón & Nakamura Reference Soberón and Nakamura2009, Soberón Reference Soberón2010). The application of such tools in studies investigating the distribution of species with sampling gaps in biogeographically important regions, such as the case with C. didactylus, can help to understand changes in the distribution pattern of species and in the environment, and evolutionary processes, as well as to direct efforts for data collection and conservation actions. However, the potential distribution of C. didactylus has yet to be evaluated.
Cyclopes didactylus probably feed predominantly on arboreal ants (Best & Harada Reference Best and Harada1985, Montgomery Reference Montgomery and Montgomery1985, Miranda et al. Reference Miranda, Veloso, Superina and Zara2009), since it occurs in tropical semi-deciduous and evergreen moist lowland forests, gallery forests, and mangrove forests (Miranda et al. Reference Miranda, Meritt, Tirira and Arteaga2014, Miranda & Superina Reference Miranda and Superina2014). Although the threat level of C. didactylus is classified as Least Concern (LC) by the International Union for Conservation of Nature (IUCN, Miranda & Superina Reference Miranda and Superina2014), the new taxonomic revision of the genus has yet to be taken into account (Miranda et al. Reference Miranda, Casali, Perini, Machado and Santos2018). Nonetheless, populations from Northeast Brazil are classified by IUCN as Data Deficient (DD) and with a trend towards decline because of rapid deforestation of its habitat due to increased number of sugarcane plantations and illegal trade (Miranda & Superina Reference Miranda and Superina2014). In addition, Northeast Brazil, which encompasses the area of biogeographical connection between Amazonian and Atlantic forests, is poorly sampled (Carmignotto & Astúa Reference Carmignotto, Astúa, Filho, Leal and Tabarelli2017). Studies investigating potential areas of occurrence of species can help direct field collections for sampling biodiversity in poorly studied regions (Giannini et al. Reference Giannini, Siqueira, Acosta, Barreto, Saraiva and Alves-dos-Santos2012). Thus, studies are needed to assess areas with the potential to harbour C. didactylus, especially in this region.
Given this context, we investigated the potential distribution area of Cyclopes didactylus to evaluate the hypothesis of a disjunct distribution between Amazonian and Atlantic forests, as well as possible historical connections, and estimate the amount of protected area in its current distribution. In addition, we investigated areas with potential for the occurrence of the species in Northeast Brazil to direct future field collections to better sample and know these DD populations (Miranda & Superina Reference Miranda and Superina2014). Estimating the amount of protected area in the predicted distribution of this species, especially in biogeographic connection areas that are important for the maintenance of its intraspecific diversity, is necessary for its conservation. Knowledge of the historical distribution patterns of species is important for understanding their evolutionary history, which is equally important for conservation (Franklin Reference Franklin2013). We expected to find greater connectivity between areas of the Amazon and of the Atlantic Forest in the ancient past, prior to the predicted time of divergence of the clades of C. didactylus (Coimbra et al. Reference Coimbra, Miranda, Lara, Schetino and Santos2017, Miranda et al. Reference Miranda, Casali, Perini, Machado and Santos2018).
Methods
Occurrence records
We compiled the occurrence records for Cyclopes didactylus according to the new taxonomic revision of the genus (Miranda et al. Reference Miranda, Casali, Perini, Machado and Santos2018), considering only confirmed records for the species. These occurrence records came from 140 samples referring to 53 unique locations (Table S1), which totalled 50 independent localities according to the resolution used to predict species distribution (see below in the topic ‘Environmental variables’). We emphasize that these occurrence records represent unique records for the species C. didactylus according to genetic data since most records found for this species in databases still do not reflect the revision of the genus (Miranda et al. Reference Miranda, Casali, Perini, Machado and Santos2018) and represent records for other species.
Environmental variables
To generate a Species Distribution Model (SDM) for Cyclopes didactylus, we used digital layers of continuous bioclimatic variables for the current time (Anthropocene, 1979 to 2013) extracted from the PaleoClim database (Brown et al. Reference Brown, Hill, Dolan, Carnaval and Haywood2018). These bioclimatic variables had about 5 km of resolution and were cut out considering the approximate limits of the region of occurrence of the species according to occurrence records (minimum longitude: -83.33, maximum longitude: –26.17, minimum latitude: –14.54, maximum latitude: 22.21).
We projected the SDM into the past using digital layers of continuous bioclimatic variables simulated for different past periods from the Holocene to the Pliocene (late-Holocene: Meghalayan from 4.2 to 0.3 thousand years ago [kya], mid-Holocene: Northgrippian [8.3 - 4.2 kya], early-Holocene: Greenlandian [11.7 - 8.3 kya], Pleistocene: Younger Dryas Stadial [12.9-11.7 kya], Pleistocene: Bølling-Allerød [14.7 - 12.9 kya], Pleistocene: Heinrich Stadial 1 [17.0 - 14.7 kya], Pleistocene: Last Glacial Maximum [around 21 kya], Pleistocene: Last Interglacial [around 130 kya], Pleistocene: MIS19 [around 787 kya], Pliocene: mid-Pliocene warm period from around 3.2 million years ago [mya], and Pliocene: M2 [around 3.3 mya]).
These paleoclimatic variables were also extracted from the PaleoClim database (Brown et al. Reference Brown, Hill, Dolan, Carnaval and Haywood2018) and were clipped considering the same limits according to the occurrence of the recorded species. This database provides current bioclimatic variables using original data from CHELSA model simulations (Karger et al. Reference Karger, Conrad, Böhner, Kawohl, Kreft, Soria-Auza, Zimmermann, Linder and Kessler2017). The paleoclimatic variables from PaleoClim were simulated by the CCSM model (Otto-Bliesner 2006, Fordham et al. Reference Fordham, Saltré, Haythorne, Wigley, Otto-Bliesner, Chan and Brook2017) for most periods or by the HadCM3 model for the Pliocene (Brown et al. Reference Brown, Hill, Dolan, Carnaval and Haywood2018, Hill Reference Hill2015, Dolan et al. Reference Dolan, Haywood, Hunter, Tindall, Dowsett, Hill and Pickering2015).
Data processing
To reduce the effect of sampling bias on the SDM, we used a sampling bias file generated through a grid of probabilities, whereby the values for sites reflect variation in sampling effort to weight the SDM (Elith et al. Reference Elith, Phillips, Hastie, Dudík, Chee and Yates2011). The sampling bias file was generated using the kernel density estimation method with the kernelUD function of the adehabitatHR 0.4.16 package (Calenge Reference Calenge2006) of R (R Core Team 2020), and the distance of the environmental variables grids was considered as the surface of the polarization grid. The digital layers of the cropped environmental variables were used to calibrate and test the model.
We evaluated the level of correlation between variables by Pearson’s correlation test using the cor function of the stats 3.6.2 package of R (R Core Team 2020) and following the same procedure used by Rissler & Apodaca (Reference Rissler and Apodaca2007), which considers a correlation threshold of 0.75. Only the variables with the greatest relevance for the species were used to generate the final model. These variables were determined by evaluating the results of the Jackknife graphs generated in the preliminary model whereby each variable is tested separately and excluding all other variables, revealing the gain and loss to models containing or not each variable (Phillips Reference Phillips2006).
The six most relevant environmental variables, according to the previous analysis, were selected to generate the final model, as follows: temperature seasonality [standard deviation*100] (bio4), the average temperature of the driest season [°C*10] (bio9), precipitation of driest month [mm/month] (bio14), precipitation seasonality [coefficient of variation] (bio15), precipitation of warmest season [mm/season] (bio18) and precipitation of coldest season [mm/season] (bio19).
Species distribution model
The SDM was built using all the non-duplicated occurrence records of the species (50 records), the sampling bias file, and the non-correlated environmental variables previously selected based on relevance and biological contribution to the species, using MaxEnt v.3.3.3 (Phillips et al. Reference Phillips, Dudík and Schapire2007). MaxEnt is a prediction algorithm for incomplete data sets (presence data only) based on the principle of maximum entropy, which assumes that the best approximation for an unknown distribution probability is one that satisfies any restriction in its distribution (Phillips Reference Phillips2006, Elith et al. Reference Elith, Phillips, Hastie, Dudík, Chee and Yates2011). Due to the reduced number of proven records for the target species of the study, the use of MaxEnt becomes adequate because it is an excellent tool for generating models from a small number of samples (Elith et al. Reference Elith, Phillips, Hastie, Dudík, Chee and Yates2011).
The final model was generated using 10 independent replicates, default MaxEnt parameters, and the method of cross-validation of points to evaluate the model. We chose the logistic output for the presentation of the model in geographical space (potential distribution), with each pixel representing environmental suitability ranging from 0 (minimum environmental suitability) to 1 (maximum environmental suitability) (Phillips Reference Phillips2006). Model performance was assessed using the area under the curve (AUC) method, considering the limit value of AUC > 0.7 to accept the model (Phillips Reference Phillips2006). We also used the True Skill Statistic (TSS) to evaluate the model performance. TSS was calculated using the threshold that maximizes the sum of sensitivity and specificity (Liu et al. Reference Liu, White and Newell2013). The SDM was projected for 11 past periods representing Late-Holocene (ca. 4 kya), Mid-Holocene (ca. 8 kya), Early-Holocene (ca. 11 kya), Pleistocene Younger Dryas Stadial (ca. 13 kya), Pleistocene Bølling-Allerød (ca. 15 kya), Pleistocene Heinrich Stadial 1 (ca. 17 kya), Pleistocene Last Glacial Maximum (LGM, ca. 21 kya), Pleistocene Last Interglacial (LIG, ca. 130 kya), Pleistocene MIS19 (ca. 787 kya), Mid-Pliocene warm (ca. 3 mya) and Pliocene M2 (ca. 3.3 mya). These paleodistributions were used to evaluate potential historic connection routes between populations of Amazonia and of the Atlantic Forest.
Least cost corridor paths
We evaluated connectivity between Amazon and Atlantic Forest areas for the species using Least Cost Paths (LCPs) analysis. To generate LCPs, we created a friction (or resistance) layer by inverting the values of environmental suitability based on the SDM (which range from 0 to 1) using the raster package (Hijmans Reference Hijmans2022) of R (R Core Team 2021). Thus, areas with greater environmental suitability for species occurrence (pixels = 1 in the SDM) present low resistance to displacement (pixels = 0 in the landscape friction layer), and areas with lower environmental suitability (pixels = 0 in the SDM) present high resistance to displacement (pixels = 1 in the friction layer).
We then created a transition object using the friction layer, an estimation of the pixel-to-pixel distances, and Moore’s neighbourhood (directions = 16), which means we considered all pixels surrounding the target pixel in the analysis (Van Etten Reference Van Etten2012). We then corrected the transition object and, finally, calculated the least environmental cost distance between points using the gdistance R package v.1.1-4 (Van Etten Reference Van Etten2012) and used these values to generate a map showing LCCPs with the leastcostpath package (Lewis Reference Lewis2021) of R (R Core Team 2021).
Estimation of protected area
We estimated the total amount of protected area for Cyclopes didactylus for its entire distribution and for each region of its distribution (Amazon, Atlantic Forest, and connection regions between Amazonian and Atlantic forests) based on the SDM considering polygons from the World Database on Protected Areas (UNEP-WCMC & IUCN 2021) for all types of protected areas. For this purpose, we converted the continuous SDM with environmental suitability values to a binary model with presence/absence values using the threshold value of the model that maximizes the model’s specificity and sensitivity, as suggested in the literature (Liu et al. Reference Liu, White and Newell2013).
We then intersected the binary model of the presence/absence of the species with the protected areas polygon and calculated the total number of pixels of this intersection as well as the total number of pixels for the binary model. We also calculated the number of pixels with protected areas in the entire species distribution and in each of its occurrence regions, namely: Amazon, Atlantic Forest, and connection region between Amazonian and Atlantic forests.
Results
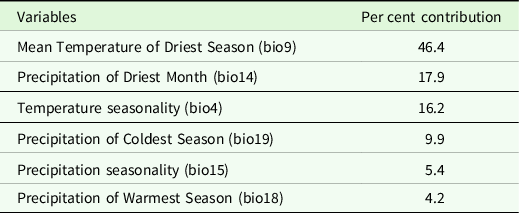
The SDM of Cyclopes didactylus showed high performance with an AUC value of 0.90, a TSS value of 0.56, a threshold value of 0.38, and an omission value of 0.04. The variables with the greatest contribution to the model were precipitation of the coldest season (bio9), precipitation of the driest month (bio14), and temperature seasonality (bio4) (Table 1).
Bioclimatic variables with the greatest contribution to the Species Distribution Model of Cyclopes didactylus.

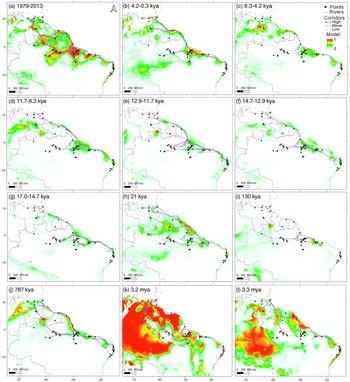
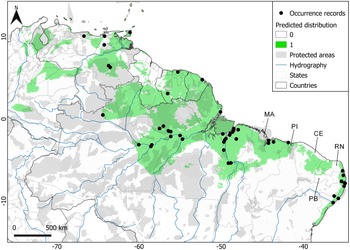
The results of the SDM showed high values (which mean environmental suitability for the occurrence of the species) in regions of Northeast Brazil, such as in the state of Ceará, in the Northwest of the states of Rio Grande do Norte and Paraíba, in the North of the state of Piauí and in the North and Central region of the state of Maranhão (Figures 2a and 3). The SDM reveals a large area of relatively continuous distribution that extends from Amazonia to the middle of Ceará in Caatinga biome. Nonetheless, the SDM did not reveal a complete continuous distribution for this species within this region between Amazonian and Atlantic forests (Figures 2a and 3). In Ceará, this distribution is cut by an area of unsuitable environment of 5.6 km and another large and isolated area of predicted distribution extends from the middle of Ceará to Rio Grande do Norte, which is separated from the Atlantic Forest by about 47 km.
Species distribution models generated in MaxEnt for Cyclopes didactylus for the current time and 11 pasts periods. Colour scales represent environmental suitability values ranging from 0 (cold colours: areas of low probability of species occurrence) to 1 (warm colours: high probability for species occurrence). Points represent species occurrence records. Dashed purple lines represent the density of the least corridors path ranging from high, medium to low according to decreasing colour tone change. A) Current species distribution during the Anthropocene, B to L) Paleodistribution during the: B) late-Holocene, Meghalayan, C) mid-Holocene, Northgrippian, D) early-Holocene, Greenlandian, E) Pleistocene, Younger Dryas Stadial, F) Pleistocene, Bølling-Allerød, G) Pleistocene, Heinrich Stadial 1, H) Pleistocene, Last Glacial Maximum, I) Pleistocene, Last Interglacial, J) Pleistocene, MIS19, K) Pliocene, mid-Pliocene warm period, and L) Pliocene, M2. The acronym kya corresponds to thousand years ago, and mya to million years ago. The figure was generated in QGIS (2021) and the geographical reference system used was WGS-84.

Predicted occurrence of Cyclopes didactylus based on the generated species distribution model (green) overlapped on maps of protected areas (diagonal lines). Points are occurrence records for the species. Blue lines represent main rivers and arrows indicate states of Brazil with predicted distribution in connection areas between Amazonian and Atlantic forests (MA: State of Maranhão, PI: State of Piauí, CE: State of Ceará, RN: State of Rio Grande do Norte, PB: State of Paraíba). The figure was generated in QGIS (2021) and the geographical reference system used was WGS-84.

The paleodistribution models revealed that most areas had low environmental suitability for the occurrence of the species in recent past periods (during the Holocene and Pleistocene, ∼787 kya to ∼4 kya in Figure 2b–2J) compared to the present (Figure 2a). However, paleodistribution models revealed more areas with high environmental suitability for the oldest periods (during the Pliocene, ∼3 and 3.3 Mya in Figure 2k–2l). Thus, these predictions for the recent past (Holocene and Pleistocene) were associated with lower- and medium-density corridors between the Amazon and the Atlantic Forest. While for the present and for the ancient past (Pliocene), a greater density of corridors between locations in the Amazon and the Atlantic Forest was predicted.
Considering the entire predicted distribution for C. didactylus, 37% was in protected areas (Table 2). The amount of the predicted distribution in protected areas for the Amazon was 40%, for the Atlantic Forest in Northeast Brazil 7% and for the connection region between Amazonian and Atlantic forests, just 0.16% (Table 2 and Figure 3).
Protected area for Cyclopes didactylus for its entire distribution and for each region (Amazonia, Atlantic Forest, and connection region between Amazonian and Atlantic forests). Total area and protected area values represent the number of pixels

Discussion
The taxonomy of Cyclopes didactylus was recently revised, separating it into seven distinct species (Miranda et al. Reference Miranda, Casali, Perini, Machado and Santos2018). As currently circumscribed, C. didactylus has the greatest range distribution among the species of Cyclopes, with an apparently disjunct distribution between Amazonian and Atlantic forests. However, the potential distribution for the occurrence of this species has, until now, not been evaluated. Thus, this study is the first to assess the potential distribution of this species and evaluate the hypothesis of a disjunct distribution and environmental protection.
Our results reveal that currently there are areas of potential occurrence for C. didactylus in the region of connection between Amazonian and Atlantic forests in Northeast Brazil, specifically in areas of the states of Ceará, Rio Grande do Norte, Piauí, and Maranhão. Despite the ancient age of divergence estimated between Amazonian and the Atlantic Forest populations of this species (about 3 mya, see Coimbra et al. Reference Coimbra, Miranda, Lara, Schetino and Santos2017, Miranda et al. Reference Miranda, Casali, Perini, Machado and Santos2018), our results revealed that populations of this species could still be found today in this connection area within the Caatinga biome.
The results of the predicted occurrence of C. didactylus suggest that it has a relatively disjunct distribution between Amazonian and Atlantic forests in Caatinga. Although the Caatinga is characterized by dry environments, in its interior are found seasonal forests and enclaves of humid forests that can favour the connections between species from the Amazon and Atlantic Forest forests (Werneck et al. Reference Werneck, Costa, Colli, Prado and Sites2011). Indeed, several biogeographical connections are found for mammals from the Amazon and Atlantic Forest across the Caatinga (Machado et al. Reference Machado, Ritter, Miranda, Bredin, Pereira and Duarte2021).
We found areas of predicted occurrence of the species in regions where it has yet to be sampled in the Caatinga region, such as in the states of Ceará and Rio Grande do Norte. Considering the known home range for this species (Montgomery Reference Montgomery and Montgomery1985), both areas of disjunction in its distribution suggest the existence of an isolated population in the Caatinga. This result can be extremely useful for directing field collections to this region to record the occurrence of this species and help to unravel these historical connections. Thus, studies need to be directed towards forests in the interior of the Caatinga.
The paleodistribution results for the species corroborate genetic studies that place the division of Amazon and Atlantic Forest populations in the Pliocene. A high density of connecting corridors was found for the Pliocene, but not for other past periods, and was equivalent to the current model. Although the estimated date of divergence between Amazon and Atlantic Forest populations is old, shared haplotypes and the lack of complete division into independent populations seem to reveal a scenario of recent contact (Miranda et al. Reference Miranda, Casali, Perini, Machado and Santos2018). Our results support this hypothesis of recent connection or reconnection. In this regard, this region has recently experienced climate change, dating to the Holocene, when forest advances were recorded during periods of increased precipitation (Oliveira et al. Reference Oliveira, Barreto and Suguio1999, Behling et al. Reference Behling, Arz, Pätzold and Wefer2000, Auler et al. Reference Auler, Wang, Edwards, Cheng, Cristalli, Smart and Richards2004, Wang et al. Reference Wang, Auler, Edwards, Cheng, Cristalli, Smart, Richards and Shen2004). Accordingly, variables that mainly represent the levels of environmental precipitation were important for the occurrence of the species, suggesting a niche characteristic that may be directly related to the issue of a disjunct distribution in the environment in which it occurs.
The areas of predicted occurrence for C. didactylus in the connection region between the Amazon and the Atlantic Forest reveal the potential existence of still unknown populations, but also the lowest incidence of protected areas. Given the supreme importance of these populations for the maintenance of the genetic diversity of the species, it is essential that studies target these areas and measures be undertaken to ensure the environmental protection of the forests in this region (interior of Northeast Brazil). Identifying this region as having the lowest degree of environmental protection highlights the importance of directing studies therein. Furthermore, as C. didactylus is a species with significant evolutionary units (Miranda et al. Reference Miranda, Casali, Perini, Machado and Santos2018), different management plans must be developed for each.
Conclusion
This was the first study to assess the potential distribution of Cyclopes didactylus. We did so to evaluate the hypothesis of a disjunct distribution between Amazonian and Atlantic forests and estimate the amount of protected area in its predicted distribution. Our results predicted a relatively disjunct distribution for the species, with potential occurrences in areas where it has yet to be registered within the connection region between Amazonian and Atlantic forests in Northeast Brazil, in the Caatinga, a region we found to be poorly protected. Although this region is also poorly sampled, our results can be used to target future field studies. Given the paramount importance of these populations to the maintenance of the genetic diversity of C. didactylus, they must be the focus of future studies and measures that guarantee environmental protection of the forests of the interior of Northeast Brazil.
Supplementary material
To view supplementary material for this article, please visit https://doi.org/10.1017/S0266467422000372
Acknowledgements
The authors thank the PaleoClim database (Brown et al. Reference Brown, Hill, Dolan, Carnaval and Haywood2018) and the World Database on Protected Areas (UNEP-WCMC & IUCN 2021) for the availability of their data, which were crucial to undertaking this study. We also thank Camila Duarte Ritter for her help with the least cost corridors analysis. Finally, we thank Pedro Tarroso and an anonymous reviewer for valuable’s suggestions and the editors for mediating and assisting us kindly and professionally throughout the review process.
Financial support
The authors would like to thank Fundação o Boticário de Proteção à Natureza (0764_20072), Dortmund Zoo (42384442), and Aquário de São Paulo (2015/001) for providing grants for this study. We are also very thankful for other small grants received from Halle Zoos and the Anteater, Sloth, and Armadillo Specialist Group – IUCN.
Competing interest
The authors declare that both contributed equitably to the manuscript and do not declare any conflict of interest.