

Introduction
In recent years, European public debate on the financial crisis, and in particular surrounding its impact on the countries of the Mediterranean region, has widely been seen through a culturalist frame. In this perspective, culture is used to explain complex social phenomena, and is seen as a homogenous set of beliefs and values from which permanent behaviours that hold back development are derived (Mylonas Reference Mylonas2012). These cultural positions are usually decontextualised and reified, ignoring the economic, social and political dimensions (Krugman Reference Krugman2008; Stiglitz Reference Stiglitz2010; Michailidou and Trenz Reference Michailidou and Trenz2015; Doudaki et al. Reference Doudaki, Boubouka, Spyridou and Tzalavras2016). Focusing on the case of Italy, this paper aims to demonstrate that this perspective produces stereotyped views of the situation, which are based on little empirical evidence and are inadequate for understanding the country’s problems.
More precisely, Italians are accused of a primitive vice: a tendency to focus on their own interests and those of the people close to them, allocating resources in a self-serving manner to networks of friends and relatives to the disadvantage of the community as a whole. These narratives draw on the scientific literature to support their case, returning repeatedly to two concepts that have been hugely successful outside academia, and which indeed have become a sort of ‘trademark’ for the country (Ferragina Reference Ferragina2011): ‘amoral familism’ and a lack of a ‘sense of civic engagement’. The first term stems from famous research by the American political scientist Edward Banfield (Reference Banfield1958), involving field studies in a town in Basilicata. According to the author, the culture in that area was atomised, pushing individuals to maximise material advantages for themselves and their family, and taking it for granted that anyone else would act in the same way. The reflection on civic duty, meanwhile, comes from Robert Putnam’s research into civic traditions in the regions of Italy (Reference Putnam1993). Working from a comparative perspective, the author explains the various measures of institutional and economic performance that have led to a divide between the North and South, identifying the ultimate cause as people’s level of civic engagement, which is high in central and northern Italy and low in the South (Busso and Storti Reference Busso and Storti2013). The concepts of amoral familism and civic engagement are often used in public debate as mantras to explain Italy’s economic woes, as if they offered a one-size-fits-all summary of permanent trends in Italian society.Footnote 1 Narratives of this type are like an underground river: they tend to remain invisible, before emerging when the economy stagnates or during political crises, with a trend through time that resembles a sine wave. Italy’s government bond crisis in 2011, which led to the fall of the Berlusconi government, stirred renewed debate on Italy’s socio-economic problems both nationally and internationally, with the latter being exceptionally fierce.
The idea underpinning this article is that the interpretation according to which Italy’s problems stem from ingrained cultural defects (re)emerged in an international context shaken by the financial crisis and in a Europe torn apart by the northern countries’ mistrust of countries in the South. This process also follows a general trend: many scholars have shown that culturalist explanations are enjoying great success in the media, and are being applied to issues that are attracting growing attention: conflicts, religious differences, migration and financial crises (Radcliffe Reference Radcliffe2006). This can also be seen in discussions surrounding the various socio-economic problems that dog Italy. In the debate within the country, positions of this type are usually taken by commentators who express discomfort at the lack of attempts to modernise. The culturalist viewpoint therefore takes root as a generic interpretation of the country’s inability to reshape itself, or as an explanation of the differences within the country, identifying Italy’s positive areas and, on the contrary, those destined to remain backward (Minicuci Reference Minicuci2003). Internationally, meanwhile, as hinted above, culturalist narratives are used as a way to ‘legitimise’ worries that Italy is untrustworthy.
Our thesis is that the generalised use of these categories over-simplifies the situation, hindering our understanding of the social phenomena at play. Indeed, these narratives assume that the elements of a ‘cultural system’ are interiorised by individuals, constituting a ‘programme which will come to regulate [...] behaviour mechanically’ (Boudon and Bourricaud Reference Boudon and Bourricaud1991, 93).Footnote 2 Collective behaviours are therefore seen to stem from conditioning, without any individual intention (Boudon and Bourricaud Reference Boudon and Bourricaud1991, 93). Instead, they should be seen as the effect that emerges from demographic, social and political factors on a macro level and planning decisions and the rational adaptation of the people involved at a micro level. The explanations that reify the notion of the ‘Italian self-serving attitude’ with cultural origins, responsible for spreading unalterable beliefs and lifestyles that are not conducive to development, are therefore inadequate (Sciolla Reference Sciolla1997).
From this perspective, we will analyse three key topics in the debate on the issues facing Italy: i) its dismal public finances, and particularly its high levels of public debt, seen as the result of a tendency to achieve private gain from public assets; ii) the presumed widespread nature of a family-centric ethos, which generates individual opportunities while hindering collective development and wellbeing; iii) individuals’ low capacity for agency, which leads to a lack of dedication to work and to young people delaying leaving home. Using these three issues, we will show that there is a widespread ‘culturalised representation’ of Italy’s problems in the public debate, where preconceived ideas are mixed with a naive use of concepts borrowed from scientific language. We will examine two aspects of the public sphereFootnote 3 through this lens: the various positions taken by politicians, decision-makers and opinion leaders in European political circles and institutions and several articles that made an impression within the media circuit.Footnote 4 This analysis will be combined with secondary statistical data and relevant scientific literature.Footnote 5
In addition to their intrinsic relevance, we chose the three topics because they complement each other well: the first involves macro-level aspects that can be traced to the (mal)functioning of political institutions; the second is a meso-level consideration, involving a social group (in this case the family); and the third is on a micro level, relating to individual action. Nevertheless, in recent years the three topics have all been placed within a single frame: they are used in the discussion surrounding Italy’s economic, political and social decline, often to support the idea that these trends are irreversible, and are depicted as the poisonous fruits of a poisonous plant with its roots in Italians’ limited concern for the general interests of their country.
The article first tackles the issue of self-serving behaviour in the management of the public finances (section two), before discussing the topic of widespread familism (section three) and finally the lack of agency among young people (section four). It concludes with some brief analysis (section five).
Undisciplined and parasitic? Financial fragility and public debt
The description most commonly attributed to the Italian public finances in the public debate is ‘out of control’. The instability of the public accounts is in turn represented as the aggregate effect of the conduct of the parties involved: the Italians’ inclination to live like ‘locusts’ or even ‘parasites’.Footnote 6 Leaving metaphors aside, Italians are depicted as living beyond their means, tainted by short-termism, trying to guarantee themselves an income. In its expanded form, this representation singles out the relationship between citizens and politics, focusing on a combination of a short-sighted offering from the political elites and a demand for personal benefits from citizens (Almond and Verba Reference Almond and Verba1963). This union of widespread irresponsibility and institutional short-sightedness placed the country in the eye of the storm during the debt crisis that exploded in 2011. Mistrust of Italy by the other European countries and international investors grew, and they took up a defensive position: Greece’s collapse had seen public opinion in Europe turn against helping Mediterranean countries, and Italy’s difficulties reinforced this attitude. Although parallels were not drawn between Italy and Greece, it was underlined, and not without some elements of truth, that a rich and industrialised country like Italy should have been more disciplined with its public finances.Footnote 7 A speech in spring 2016 by the president of Deutsche Bundesbank, Dr Jens Weidmann, to the German ambassador to Rome epitomised these considerations, interpreting the behaviour of highly indebted countries like Italy with reference to the ‘tragedy of the commons’. He therefore raised the spectre of these countries plundering shared European assets and eroding trust and institutional stability, because they were incapable of working responsibly in the national interest.Footnote 8
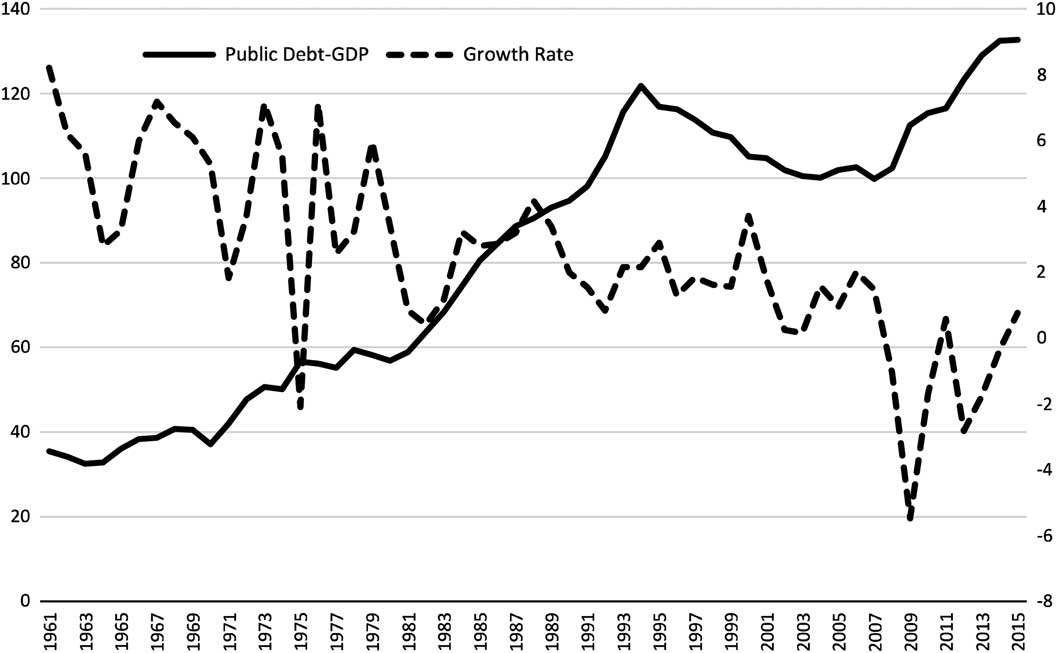
In addition, Italy’s high level of public debt, which currently stands at above 130% of GDP (see Figure 1), is often used to summarise the overall state of the Italian public finances. Some empirical data, however, suggest that this is a misleading interpretation. First of all, the debt cannot be seen as the result of a lack of inclination for civic engagement or a lack of discipline on the part of the Italians. Instead, it is the adverse and, in some cases, undesired effect of economic and political processes that have occurred at various stages in the history of capitalist Italy (Bagnasco Reference Bagnasco2008). Secondly, and most importantly, the ‘debt-centric’ view overlooks the fact that while the Italian public finances have many critical points, they also have some positive features.
Public debt to GDP ratio and growth rate trends in Italy. Source: our graphics using AMECO-Eurostat (http://ec.europa.eu/economy_finance/ameco/user/SelectSerie.cfm), MEF 2016 and World Bank (http://data.worldbank.org/indicator/NY.GDP.MKTP.KD.ZG) data. The public debt to GDP ratio (%) is shown on the left-hand axis; the growth rate (%) is shown on the right-hand axis.

Figure 1 shows the long-term increase in the public debt, with a rapid acceleration from the early 1980s onwards, not seen in other European countries. This was an economically prosperous period for Italy: GDP and incomes grew, but at the same time the factors that led to the current debt situation – a fragmented political landscape and highly conflicted government coalitions – were accentuated. This caused chronic difficulty in representing people’s interests in an integrative manner, instead favouring an additive dynamic. As a result, public spending increased and was used as a tool for garnering approval and for political negotiation, making it difficult to create local collective competition goods, with costly money transfers taking precedence (Trigilia Reference Trigilia2012).
Away from the 1980s, various periods can be identified when public spending was restricted and focused on productive aims – shown in Figure 1 in relation to periods of economic growth and debt reduction – for example during the first Prodi government (1996–1998). Furthermore, since 2012 the public debt has grown more slowly than in other major European countries (MEF 2016). The debt therefore cannot be isolated from social and institutional factors and other public finance parameters, and the explanation for its origin cannot be reduced to blaming the unshifting, predatory attitude of the Italians and their institutional representatives. This awareness, however, seems to have vanished in the public debate, where instead a moral conflict has taken root between different national forms of capitalism; the approach in central and northern Europe is seen as an efficient response to criteria based on justice, while the Italian equivalent is seen as an ethically and socially inferior second-best (Streeck Reference Streeck2015; Cross and Ma Reference Cross and Ma2015). The debate on the different models of capitalism is extremely backward at an ideological level, and the debt problem is seen within this framework, often becoming a way to look at Italy through the eyes of central and northern Europe.
This is not the place to probe the sustainability of a high level of public debt, nor do we refute the fact that the Italian public debt requires a political debate on how to reduce it.Footnote 9 Nevertheless, we believe that the high debt is exploited to transmit the idea of public accounts that are characterised by squandering and privileges. As mentioned before, this thesis is contradicted by various statistics. Italian public spending, net of interest, actually remained unchanged between 2005 and 2015. Furthermore, with the exception of 2009, Italy boasts one of the highest budget surpluses in the EU, with an average of 2% between 1986 and 2016, compared to 0.7% in Germany (Fubini Reference Fubini2016). The data show this trend continued over the last seven years, during the economic and financial crisis: the surplus in the Italian budget over this period before interest payments was 1.18% of GDP, while Germany’s, for example, was below 1.1% (Fubini Reference Fubini2016). Moreover, since 2012, Italy has always respected the required 3% deficit to GDP ratio (Eurostat 2016; MEF 2016),Footnote 10 putting it ahead of other major economies including France and Great Britain in this regard (Eurostat 2016; MEF 2016). The Italian state also has a lower cost per capita than Great Britain and France (Eurostat 2016; MEF 2016). Finally, it is worth looking at an aspect often presented as the result of the parasitical relationship between the state and its citizens, as well as a source of waste: the exceptional size of the public sector in Italy. Reducing the number of public sector workers to return the public accounts to order has become a key part of the public debate (Abravanel Reference Abravanel2013). However, the data show that the percentage of public sector employees in the Italian workforce, which stands at around 16%, is lower both than large countries with a strong public sector, such as France (18.3%), and non-coordinated market economies, including Great Britain (21.5%) and the northern European social-democratic countries, Denmark (31.6%), Sweden (25.8%) and Norway (33.4%) (OECD 2016, 83).
The image of Italy as an ‘economy of waste and exchange’ is therefore only partially true; the concept of a ‘country of paradoxes’Footnote 11 (Sciolla and Negri Reference Sciolla and Negri1996) is more accurate, a nation that is very difficult to summarise and for which it is hard to identify unambiguous trends.
Given the kaleidoscopic nature of the country, we need to narrow the focus of our analysis: from a macro scale, we will now go down to the meso level, and observe the recurring narrative in the public debate whereby the ‘Italian family’ has institutionalised a system of values that prioritises the individual’s interests over the general interest.
Self-serving and uncooperative? The familist attitude
An oft-repeated argument ascribes a proportion of Italy’s socio-economic problems to the abnormally large value it places in the family. The public debate on this matter concentrates on meso-level aspects, focusing on social relationships and holding the widespread family model in Italy responsible for promoting the ‘strong ties’ (Reher Reference Reher1998) of private interests over the common good. In other words, a ‘culture where one’s family is much more important than the rest of society’ (Alesina and Ichino Reference Alesina and Ichino2009, 13) is seen as endemic in Italy. This, the argument goes, impedes the full development of a modern civil society, communal organisational structures, recognised institutions and shared collective identities (Gribaudi Reference Gribaudi1993).
As stated above, these visions reawaken the ‘ghost of Banfield’ (Ferragina Reference Ferragina2011) and his theory of amoral familism. Indeed, the idea that Italians’ family-centric attitude is the ‘smoking gun’ for the country’s persistent problems has been brought back to the forefront of the public debate, through popular science articles in the media and in the positions taken by politicians.
This type of discourse follows two lines of argument: the familist attitude has long been seen as a factor that explains the differences within Italy, in particular the underdevelopment of the South, while in recent years it has also become a national vice (Kertzer Reference Kertzer2007). Let’s have a look at a few examples. In 1995, Renato Brunetta, then minister for public administration, stated that collaboration, mutual assistance and trust characterised the horizontal nature of the North, while hierarchy and familism underpinned the vertical nature of southern Italian society (1995). A few years later, during the campaign for the Partito Democratico’s primaries in 2012, a group of southern Italian intellectuals and politicians published a document in support of the future prime minister Matteo Renzi,Footnote 12 in which an excessive focus on family interests was stated as the cause of problems including co-optation, nepotism, widespread crime, the mafia, a lack of social mobility and the brain waste of talented individuals, aspects that had produced the historical backwardness of the South, but which in recent years were also spreading to the North. A similar opinion was shared by the economists Alberto Alesina and Andrea Ichino, who, in a successful pamphlet, identified the family as an ‘octopus [...] that suffocates the country with social immobility and suspicion of anything outside the walls of one’s home, hindering development’ (2009, 1). Comparable analysis was used by the demographer and member of the Italian senate Gianpiero della Zuanna (Reference Dalla Zuanna2001), who argued that the excessive nuclearisation of Italian families was the cause of their closed nature, leading to a ‘familistic Italian way of life’. This lifestyle, in his eyes, involved maximising the wellbeing of one’s own family unit, thereby creating conditions in which young people have little motivation to enter fully into adult life, with a resulting fall in fertility rates and economic crisis.Footnote 13
The idea that Italy prioritises self-serving, family interests over the public interest has also been asserted outside its borders, in the international public debate, inextricably bound up with reflections on the economic crisis. In June 2011, The Economist published a Special Report on Italy entitled Oh for a New Risorgimento (Volume 399, Issue 8737, 9). One of the reasons it gave for Italy’s economic stagnation was the practice of obtaining positions in the labour market through recommendations, the result of the excessive importance of the family, which is not in the general interest and makes recognising merit problematic. One year later, on 29 June 2012, the opinion writer for the Washington Post, Steven Pearlstein, in an article entitled ‘Italy’s Culture Threatens its Economic Future’, argued that ‘strong family ties also inhibit the flexibility of the country’s labor markets’, and attributes the causes of the economic crisis to ‘the distaste for meritocracy […] the obsession with family […] [and] the weak sense of a civic culture or virtue in Italy’.
These cases, which exemplify widely-held beliefs, implicitly identify a causal chain: the familist ethos acquired by individuals during their socialisation hinders co-operation outside of small networks of relationships, and the formation of trust in institutions, thereby suffocating the economy. But does this deterministic relationship actually exist?
Empirical research has shown that the family’s central position in Italy’s practices and in its ‘relational culture’ is partly due to the emergence of large networks of associations, which were able to enter into dialogue with local and central institutions (Diamanti, Ramella and Trigilia Reference Diamanti, Ramella and Trigilia1995; Sciolla Reference Sciolla1997). In addition, large farming families were historically a driver of the country’s development: organisations that underpinned the formation of networks of small businesses and, more recently, the emergence of medium-sized enterprises in the centre and north-west of the country, where Italian capitalism is at its most dynamic (Gribaudi Reference Gribaudi1993; Bagnasco Reference Bagnasco1998; Colli Reference Colli2002). Furthermore, in addition to competition, co-operation between different businesses was also widespread in these contexts, particularly among family-run businesses, creating specific forms of local development and capable of taking root even in highly innovative economic sectors (Bagnasco Reference Bagnasco1998).
The thesis that retaining family values hinders the strengthening of institutional trust is similarly weak. On the one hand, it is true that Italians have less trust in strangers then the average European, and are sceptical about the operations of various political institutions (Bagnasco Reference Bagnasco2012, 141). On the other hand, however, institutions such as the president of the republic and the judiciary are seen more positively in Italy than in other Western countries, and are viewed as having normative value by a large majority of Italians (Bagnasco Reference Bagnasco2012, 141). The family therefore undeniably remains a ‘pillar of Italian society’, but this does not mean that Italians’ trust is limited to those closely related to them (Bagnasco Reference Bagnasco2012, 142). Moreover, when it comes to political participation and civic engagement, Italy is ahead of major countries such as France, Spain and the United States (Sciolla Reference Sciolla2004).
The effects of the importance given to the family in society are therefore ambivalent: it does not automatically cause a focus on individual interests over the general interest, nor does it inherently produce a suboptimal allocation of resources in terms of economic development (Barbagli Reference Barbagli1984; Saraceno and Naldini Reference Saraceno and Naldini2007). Nor does a strong family necessarily create weak civic participation. This can obviously happen, with damaging results: if attachment to family interests becomes indifferent to the general interest, this often feeds nepotism and corruption (Ginsborg Reference Ginsborg2010). However, we have shown that in the past forms of familism have existed that were ‘neutral’ with regard to the functioning of society, if not positive (Bagnasco Reference Bagnasco2012). Seeing familism as the variable that explains Italy’s economic troubles is therefore a mistake.
Furthermore, one does not get very far characterising the family-centric attitude as a collective internal quality, a cultural syndrome that expresses itself in constrained sociality, and a lack of impersonal and institutional trust (Viazzo Reference Viazzo2010; Viazzo and González Díez Reference Viazzo and González Díez2016). Indeed, this characterisation ignores the role that institutions can play in stimulating broad co-operation and the negative effects generated when they are ineffective. A strong family is also a useful stand-in that ‘tends to cover social spaces where institutions are weaker’ (Gribaudi Reference Gribaudi1994, 352) or where welfare systems are inefficient, in particular supporting the transition to adult life and young people’s entry into the workplace (Signorelli Reference Signorelli2001).Footnote 14 Familism is therefore not the result of an unmeasurable inclination of those involved, as an essentialist view of culture would maintain (Gaggio Reference Gaggio2007), but is instead in some ways a fall-back choice, conditioned by contingent political and institutional factors. This consideration fits with the data on trust given above: the low expectations aroused by intermediary institutions (local and national government) increase the tendency to rely on the family. It is therefore worth discussing how the adaptation strategies followed by various family members take shape. This can be seen through a joint observation of factors relating to agency and structure (opportunities, restrictions and social networks). We will apply this approach in the next section, opening up the black box of the family to observe the dynamics of the conduct of its constituent parts.
Lazy and big babies? The issue of agency
Another stereotype found in public discourse involves the limited agency of those involved. Essentially, Italians are accused of a lack of inclination towards individual commitment and sacrifice. This argument focuses on two elements: Italians’ presumed ‘laziness’, particularly in the workplace, and the reluctance of younger members of society to enter adulthood by tearing themselves away from their family of origin.
Let’s begin with the first preconception. Within Italy, several campaigns, often seized upon by various figures from the political world, have been fought in recent years against fannulloni, or idlers, identified variously as public-sector employees, university lecturers, magistrates, and law-enforcement workers, as well as, more generically, those living in the South.Footnote 15 On a European level, a speech by the German chancellor Angela Merkel is worthy of mention, which, at a particularly severe point in the southern European debt crisis, raised the topic of the slow pace of work in various countries, hypothesising that this was responsible for the economic and financial crisis: ‘We can’t have a common currency where some get lots of vacation time and others very little. That won’t work in the long term’.Footnote 16 Although she was referring generically to southern Europe, the argument includes Italy: in November 2013 Italian prime minister Enrico Letta expressly asked the Germans not to feed the stereotype of the ‘lazy Italians’, highlighting the risk of growing populism in Europe caused precisely by the spread of this type of rhetoric.Footnote 17
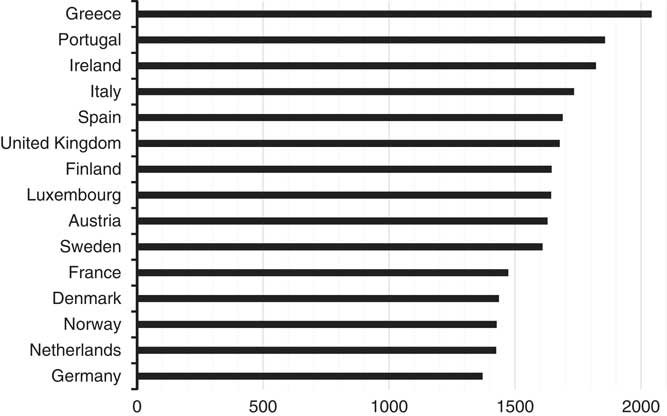
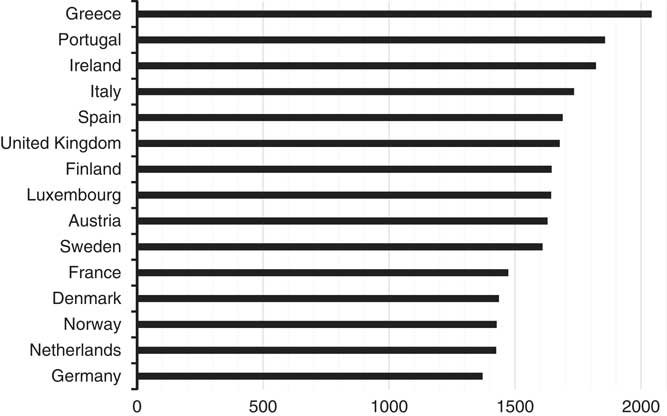
One simple statistic, the average total hours worked per year, refutes this argument. Organisation for Economic Co-operation and Development (OECD) data for 2014 ranks Italy in fourth place in Europe in terms of the number of hours worked per capita, with 1,734 hours a year, behind three countries hit hard by the crisis: Greece, Portugal and Ireland (Figure 2). The countries of central and northern Europe, meanwhile, work significantly fewer hours, far below the OECD average of 1,770 hours. The figure for Germany is particularly striking: it is the lowest ranked of all those considered, with an average of 1,371 hours worked per year. These data have remained stable through time, without significant variations following the financial crisis: Italians’ considerable work ethic is therefore not due to the need to tackle the crisis, but instead represents a structural feature.
Average number of hours worked per worker in various OECD countries – 2014. Source: OECD (http://stats.oecd.org/index.aspx?DataSetCode=ANHRS).
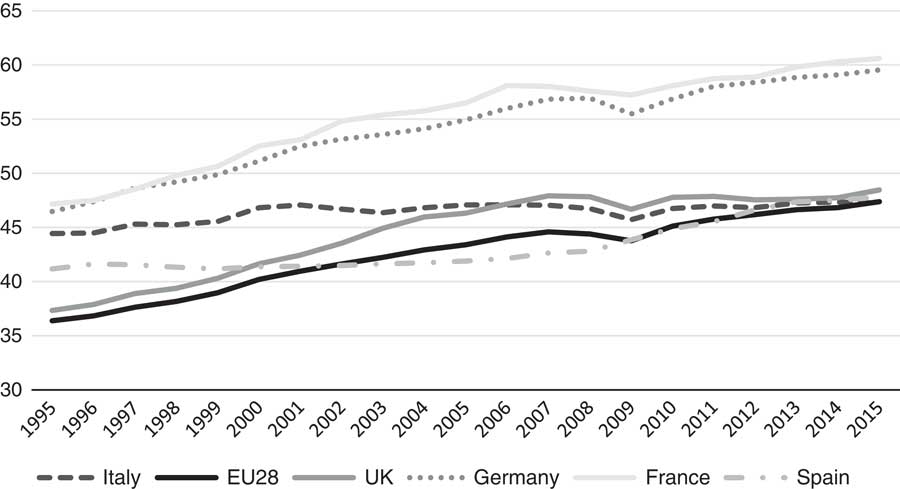
As well as the amount of work carried out, it is also worth considering productivity. Figure 3 measures the relationship between the value of the country’s output and the time required to produce it, calculated based on the GDP produced for each hour worked. In 1995, Italy was rather well-placed, at $44.5, just a little below France ($47.2) and Germany ($46.5) and significantly above Spain ($14.2) and the United Kingdom ($7.3), and a long way above the average for the 28 countries of the European Union (EU-28) ($36.4). Over the next 20 years, however, Italy did not grow very much, achieving just $47.2 per hour in 2015. Meanwhile, the other countries increased their hourly productivity by some margin: France and Germany passed $60, while the United Kingdom and Spain, starting from lower levels, have caught up with Italy and sit around the European average. However, this trend has little to do with the poor attitude towards work of those involved, but instead reflects structural aspects: the ability of manufacturing systems to increase technical and organisational efficiency, as well as the structure of national labour markets and the market regulation in place (Van Ark, O’Mahony and Timmer Reference Van Ark, O’Mahony and Timmer2008). This is proved indirectly by the fact that while numerous structural indicators place Italy near the bottom of the rankings of European countries – with an employment rate of 55.7% in 2015, compared to the EU-28 average of 64.9%Footnote 18 – there are signs of economic vibrancy stemming from individual action, such as the entrepreneurship rate,Footnote 19 which is the highest in the European Union at just under 30%, compared to 8.4% in Germany and 7.4% in France. It is true that this figure in itself does not demonstrate economic innovation, as it also includes forms of freelance work with a marginal effect on productivity. However, the innovative attitude of Italian entrepreneurs is confirmed by Eurostat data, which show how, between 2010 and 2012, 41.5% of businesses were innovativeFootnote 20 in Italy, above the European average of 36% and higher in the rankings than, amongst others, France and the United Kingdom (Ramella Reference Ramella2013).
GDP per hour worked. 1995-2015, US dollars at constant prices based on 2010. Source: OECD (https://data.oecd.org/lprdty/gdp-per-hour-worked.htm).

A second aspect of investigating the level of individual agency involves young people’s resistance to becoming independent from their family. This trend emerges strongly in the public debate, promoted in part by leading political representatives who have not hesitated to label young Italians as ‘bamboccioni’ (‘big babies’) Footnote 21 or excessively ‘choosy’.Footnote 22 The data seem to back this up: in 2015 over two-thirds of Italians aged between 18 and 34 (67.3%) still lived with their parents, compared to the European average of 47.9%. Although the financial crisis had an effect, leading to an increase in the number of young people without their own home – the figure stood at 61% in 2006 – the statistics match other Mediterranean countries (in 2015 63.8% of 18-to-34-year-olds in Greece and 50% of those in Spain still lived with their family). In the 25-34 age group the trend is even more significant, with 50.6% of young adults still at home, compared to a European average of 28.7% (10.1% in France, 16% in the United Kingdom, and 19.1% in Germany).Footnote 23
Given that one’s potential to fly the nest is connected to one’s material conditions, let us first have a look at the differences between countries in young people’s potential to access the labour market. Eurostat data for 2015 show that, compared to the EU-28 average of 22%, youth unemployment in Italy stood at 37.9% (24% in France, 16.9% in the United Kingdom and 7.7% in Germany).Footnote 24 Furthermore, due to the structure of the Italian market, there is extremely low demand for highly qualified work (professional and technical positions comprise 20–23% of the labour market, compared to 30–34% in France and Germany, Fullin and Reyneri Reference Fullin and Reyneri2015). These features, combined with a static property market (Filandri Reference Filandri2015) and welfare spending directed predominantly at the elderly population, with support for young people and families neglected,Footnote 25 create a situation that encourages young people to remain within the family group (Albertini and Kohli Reference Albertini and Kohli2013).
In this scenario, certain choices that at first glance seem to be dictated by a lack of personal initiative instead appear to be rational strategies for the transition to adult life, with the aim of achieving a solid social position and maintaining the status and wealth of the family of origin (Negri and Filandri Reference Negri and Filandri2010). This applies both to those who cannot find a position in the labour market, and therefore require family support, and to those who, although they have a job, face low salaries or alternating periods of work and unemployment. In this setting, it appears rational for families that can afford to do so to help their children, both directly, with financial help or by acquiring or gifting a home, and indirectly, by enabling them to stay longer in the family home (Filandri and Bertolini Reference Filandri and Bertolini2016). This allows children to navigate the labour market strategically, refusing unqualified positions, even if they are better paid, which risk restricting their social mobility, while waiting for work that provides more opportunities for career development (Filandri, Nazio and O’Reilly Reference Filandri, Nazio and O’Reilly2016).
Furthermore, introjected cultural positions do not adequately explain the phenomenon in question. The differences between Italy and other countries, when they actually exist and are not merely the result of imaginary stereotypes, are understandable when one considers the socio-economic context on the one hand and strategies to tackle uncertainty on the other. Analysing the connections between the structure of the limitations/opportunities and the behaviour of those involved, rather than settling for a generic reference to the intrinsic attitudes of population, is the first step towards understanding the range and forms of possible remedial action. Awareness that people respond independently to specific situations is needed in order for institutions to identify systems of incentives that stimulate behaviour having a positive impact on social and economic development. This is not a simple task: it requires costly and stable policies that bear fruit in the long term, such as monthly allowances for leaving home, unemployment benefits, selective tax relief and minimum wage measures. All aspects that are famously absent in the Italian welfare system.
Conclusions: the culturalist fallacy and explaining complexity
In this article we have illustrated the limits of the narratives presented in the public debate that deterministically link Italy’s problems with presumed ‘Italian attitudes’. The Italians are presented as self-servingly defensive of their interests, and therefore incapable of allocating resources meritocratically; prone to supporting extractive types of political institution, which indulge pressures from particular groups and therefore produce out-of-control public spending (Acemoglu and Robinson Reference Acemoglu and Robinson2013); and lacking in entrepreneurship and independence. We chose to simplify the debate by focusing on issues that affect the entire country: these narratives are often put forward when analysing variations within Italy, to explain the North-South divide, with the idea that the individualist, lazy attitude, lacking in civic engagement, is found predominantly in the South. Now more than ever before, however, the narratives have been reshaped and have developed a new fervour at a national level. Given its persistent economic problems, a recurring concept is that Italy has succumbed to a sort of ‘Southernisation’ (Sciarrone Reference Sciarrone2009). The mentality found in the most problematic areas is seen to have won and to have spread up the peninsula.
When the main features of these narratives are presented they appear naive, yet they continue to appeal and to generate rationalised myths. It is not difficult to understand their success: they provide an effective ‘smoking gun’, identifying the (presumed) ultimate cause of complex social issues. Nevertheless, these narratives can be shaped to fit different objectives: in the debate within Italy, this happens every time the (presumed) cultural inadequacy of the South and its ‘inhabitants’ is used ideologically to build an opposing phantom modern and highly evolved collective identity for the North. In recent years, however, we have seen at an international level how the scapegoat of the cultural unreliability of the countries of southern Europe, with Italy leading the way, can be used as a way of invoking policies of austerity. Basically, despite being analytically inaccurate, culturalist narratives are useful for defending or representing various interests.
As stated in the introduction, periods or times of social and economic crisis are particularly liable to offer opportunities for a culturalist frame to emerge, often interiorised by leading exponents of the intellectual/managerial classes: journalists, political and public decision-makers and intellectuals have all been caught in the act. An empirical look at the factors that lie behind this process would surely be worthwhile. We can hypothesise three. As stated above, the first involves the reductionist effectiveness of the culturalist frame, in other words its ability to offer bitesize representations of complex phenomena, which are useful for generating political comparisons. Another factor is the public visibility of scholars who have proposed culturalist explanations, which are then exaggerated and exploited in the public debate, regardless of the intentions of those who initially proposed them. This, for example, applies to Banfield and Putnam, mentioned in the first section of this paper. Another factor could be the performativity of the culturalist frame: it is effective because not only does it describe a reality, it also helps to shape it, thus feeding itself.Footnote 26
In recent years, culturalist narratives have helped to polarise the debate on the economic crisis by reviving old stereotypes (Michailidou Reference Michailidou2016). They therefore impede the construction of a European public sphere, where countries’ specific difficulties can be discussed in a more detailed and less hostile way. Furthermore, they hinder the emergence of realistic policy proposals in the national public debate, thereby feeding immobilism: the country’s socio-economic stagnation cannot be remedied if it is understood to be caused by Italians’ intrinsic inadequacy.
The ways of depicting Italians illustrated in this paper are problematic from several points of view: i) they overlook the importance of opportunities and limitations caused by the context; ii) they overestimate statistical connections between phenomena and simplistically attribute causal links; iii) they mix the analytical with the prescriptive. But the most profound limitation is the fact that they concentrate on the assumed characteristics of the individuals involved, ignoring the functioning of social systems (Coleman Reference Coleman1990). If the variables of the context were to be considered, more promising lines of analysis would emerge: choices made by people on a micro scale are shaped by social expectations, by their preferences and by the social norms that emerge from interactions (Bigoni et al. Reference Bigoni, Bortolotti, Casari, Gambetta and Pancotto2015). This opens up two scenarios that together provide more convincing explanations of the phenomena presented above. The first involves a ‘macro-micro’ approach, in other words the way those involved react in the presence of different institutional incentives and opportunity structures: there is no shortage of situations in Italy where, when local bodies are modern and efficient, interpersonal trust has increased, along with a willingness to co-operate to produce public benefit and to take on individual risks, even in difficult circumstances.Footnote 27 There is therefore no single self-serving ethos found in the Italian personality. The second scenario, meanwhile, involves a ‘micro-macro’ approach. Those involved do not react immediately to changes in incentives: a resistance to co-operation, excessive individualism and opportunism and a lack of trust can persist even when the opportunity structure changes (Bigoni et al. Reference Bigoni, Bortolotti, Casari, Gambetta and Pancotto2015, 22). This does not imply that the explanation should be sought deep down in the (inalterable) opportunistic mentality of the people involved. Instead, components such as the ‘rationality of mistrust’ could be decisive: the institutional failures of the past make it difficult to develop high social expectations (Sciolla Reference Sciolla2013). Social norms should therefore be investigated as a complex social entity, as they form part of the dynamics of interaction. Amorality, laziness and rent-seeking do not exist specifically among Italians, but rather in social contexts where norms that incentivise this type of behaviour are widespread.
Translated by Ian Mansbridge
(info@ianmansbridge.co.uk)
Notes on contributors
Luca Storti is Assistant Professor of Economic Sociology at the University of Turin (Italy), where he teaches subjects related to the economy and institutions. His current research interests deal with entrepreneurship and regional development, and he is also interested in issues surrounding the middle classes and in the mafia’s expansion processes in Italy and abroad.
Joselle Dagnes is a postdoctoral researcher in economic sociology at the University of Turin (Italy). Her current research interests involve the regulation of institutions and companies through both formal rules and informal practices, with a specific focus on the role of individual and collective agents (studying financial elites and inter-organisational networks). She is also interested in forms of self-organisation that promote radical innovation (including alternative food networks and local currencies) and in the mafia’s expansion processes in Italy and abroad.
Javier González Díez is Lecturer in social anthropology at the National University of Education (Ecuador). He is currently researching kinship and family networks in Latin America and in the Mediterranean region, focusing on historical and cultural imaginaries of families and diversity. He has also researched on several theoretical topics in the field of anthropology, including cultural relativism, human rights and (in)securities and neoliberalism.