

On average, American women are more likely than men to identify with the Democratic Party and to vote for Democratic presidential candidates. As a result, discussions of the gender gap tend to focus on women’s more pronounced tendency toward political liberalism. However, women voters are a politically heterogeneous group—divided by cross-cutting social and demographic factors linked to race, ethnicity, educational attainment, class, region, and religiosity (Andersen Reference Andersen1999; Carroll Reference Carroll and Mueller1988; Gillion, Ladd, and Meredith Reference Gillion, Ladd and Meredith2018; Howell and Day Reference Howell and Day2000; Junn Reference Junn2017; Kaufmann Reference Kaufmann2006; Norrander Reference Norrander1999; VanSickle-Ward and Pantoja Reference VanSickle-Ward, Pantoja, Brown and Gershon2016). Partisanship also is a major source of division among American women. Past research on the intersection of gender and party revealed that Republican women’s policy preferences are much closer to those held by Republican men than to those of Democratic women (Barnes and Cassese Reference Barnes and Cassese2017; Deckman Reference Deckman2016). Recognition of this powerful cross pressure necessitates a closer look at gender gaps within the parties—as well as across them—to better understand the conditional influence of gender on political thinking and behavior.
Past research suggests that gender gaps fluctuate from election to election. Political campaigns influence the size of the gaps by emphasizing particular policy issues, which can increase their salience or importance to voters, and by working to forge personal connections with specific constituencies (Hayes Reference Hayes2008; Kaufmann Reference Kaufmann2006; Kaufmann and Petrocik Reference Kaufmann and Petrocik1999). In the early 2000s, scholars noted more stability in the partisanship and electoral behavior of men relative to women, suggesting that changes in gender gaps more often than not reflect movement in the political choices of women or particular subgroups of women (Box-Steffensmeier, De Boef, and Lin Reference Box-Steffensmeier, Boef and Lin2004; Kaufmann Reference Kaufmann2002; Reference Kaufmann2004; Reference Kaufmann2006). This article explores within-party gender differences in policy attitudes using data from the 2012 and 2016 presidential races. We aim to determine whether within-party gender gaps in policy attitudes are relatively stable over time or whether the size of the gaps varies during the four-year period. If change occurs, does it cut across party lines or is it confined to a particular subgroup of partisan men or women? A closer look at these two elections affords new insights into the ways that party and gender jointly shape Americans’ political thinking.
STABILITY AND CHANGE IN THE GENDER GAP
The modern gender gap refers to the tendency for women to identify with the Democratic Party, support Democratic presidential candidates, and endorse liberal policy positions at higher rates than men (Box-Steffensmeier, De Boef, and Lin Reference Box-Steffensmeier, Boef and Lin2004; Norrander and Wilcox Reference Norrander and Wilcox2008). Gender gaps in policy attitudes are relatively modest: for some issue areas, such as abortion policy, there is virtually no gender gap; for others, such as support for government use of force (i.e., defense and criminal justice issues), there are larger gaps ranging from seven to eight percentage points. The gender gap on social welfare issues falls somewhere in between, at about four points (for a review, see Huddy, Cassese, and Lizotte Reference Huddy, Cassese and Lizotte2008). Past work suggests that it is important to understand gender gaps in policy preferences because they underlie gender differences in partisanship as well as voting behavior (Cassese and Barnes Reference Cassese and Barnes2019a; Chaney, Alvarez, and Nagler Reference Chaney, Alvarez and Nagler1998; Conover and Sapiro Reference Conover and Sapiro1993; Kaufmann Reference Kaufmann2002; Reference Kaufmann2006; Monforti Reference Monforti2017; Shapiro and Mahajan Reference Shapiro and Mahajan1986).
These average differences between men and women are only part of the story, however. Neither men nor women are political monoliths, and cross-cutting identities as well as demographic factors create significant divisions within gender groups (Brown and Gershon Reference Brown and Gershon2016). For example, Barnes and Cassese (Reference Barnes and Cassese2017) evaluated the cross-cutting influence of partisanship on public opinion using the 2012 American National Election Study (ANES) data. They uncovered small but significant gender gaps among Republicans, with GOP women slightly more supportive of spending on childcare, education, and health care, as well as showing more support for gun control and gay rights. Fewer differences were evident among men and women in the Democratic Party. Overall, women are more likely to identify with the Democratic Party, but women who identify as Republican hold positions that are more similar to Republican men than to Democratic women.
Neither men nor women are political monoliths, and cross-cutting identities as well as demographic factors create significant divisions within gender groups.
In addition to the cross-cutting effects of partisanship, the gender gap is complicated by changes in the political environment. For example, in her work comparing gender gaps in 2000 and 2004, Kaufmann (Reference Kaufmann2006) demonstrated that national-security concerns and George W. Bush’s personal traits uniquely resonated with white female Southern Democrats, shrinking the gender gap in vote choice in 2004 relative to 2000. Beyond this, gender differences in issue positions have been linked to long-term changes in the gender composition of the parties (Kaufmann and Petrocik Reference Kaufmann and Petrocik1999; Norrander Reference Norrander and Whitaker2008; Ondercin Reference Ondercin2017). Collectively, this work suggests that the gender gap is a dynamic phenomenon (see also Box-Steffensmeier, De Boef, and Lin Reference Box-Steffensmeier, Boef and Lin2004).
Given what we know about the dynamic nature of the gender gap, there are reasons to expect changes between 2012 and 2016. Gender was salient in both election years, although in different ways. In 2012, inclusion of the birth-control mandate in the Affordable Care Act was a point of contention between President Obama and challenger Mitt Romney. In down-ballot races, several GOP candidates made headlines by opposing the rape exemption to state-level abortion laws and by attacking Planned Parenthood. All of this fed the media narrative of a “Republican War on Women” (Deckman and McTague Reference Deckman and McTague2015). In 2016, Hillary Clinton’s historic candidacy, multiple accusations of sexual misconduct against Donald Trump, and the growing profile of the #MeToo Movement focused national attention on issues of gender and power. Beyond this, several researchers directly compared the influence of beliefs about gender (namely, modern and hostile sexism) on candidate evaluations and vote choice in 2012 and 2016. Collectively, this work finds an effect in 2016 but not in 2012, suggesting distinctive gender dynamics across the two elections (Cassese and Barnes Reference Cassese and Barnes2019b; Schaffner, MacWilliams, and Nteta Reference Schaffner, MacWilliams and Nteta2018; Valentino, Wayne, and Oceno Reference Valentino, Wayne and Oceno2018).
In summary, the literature points to the potential for attitude change but also notes that change is unpredictable and contingent on a multitude of factors (Howell and Day Reference Howell and Day2000). Rather than speculate on specific changes in issue attitudes across the two elections, we take an exploratory approach and compare the within-party gender gaps previously identified in the 2012 ANES (Barnes and Cassese Reference Barnes and Cassese2017) with those in the 2016 ANES to gain insights into the question of whether gender-based divisions within the parties shift over time.
COMPARING WITHIN-PARTY GENDER GAPS ACROSS ELECTIONS
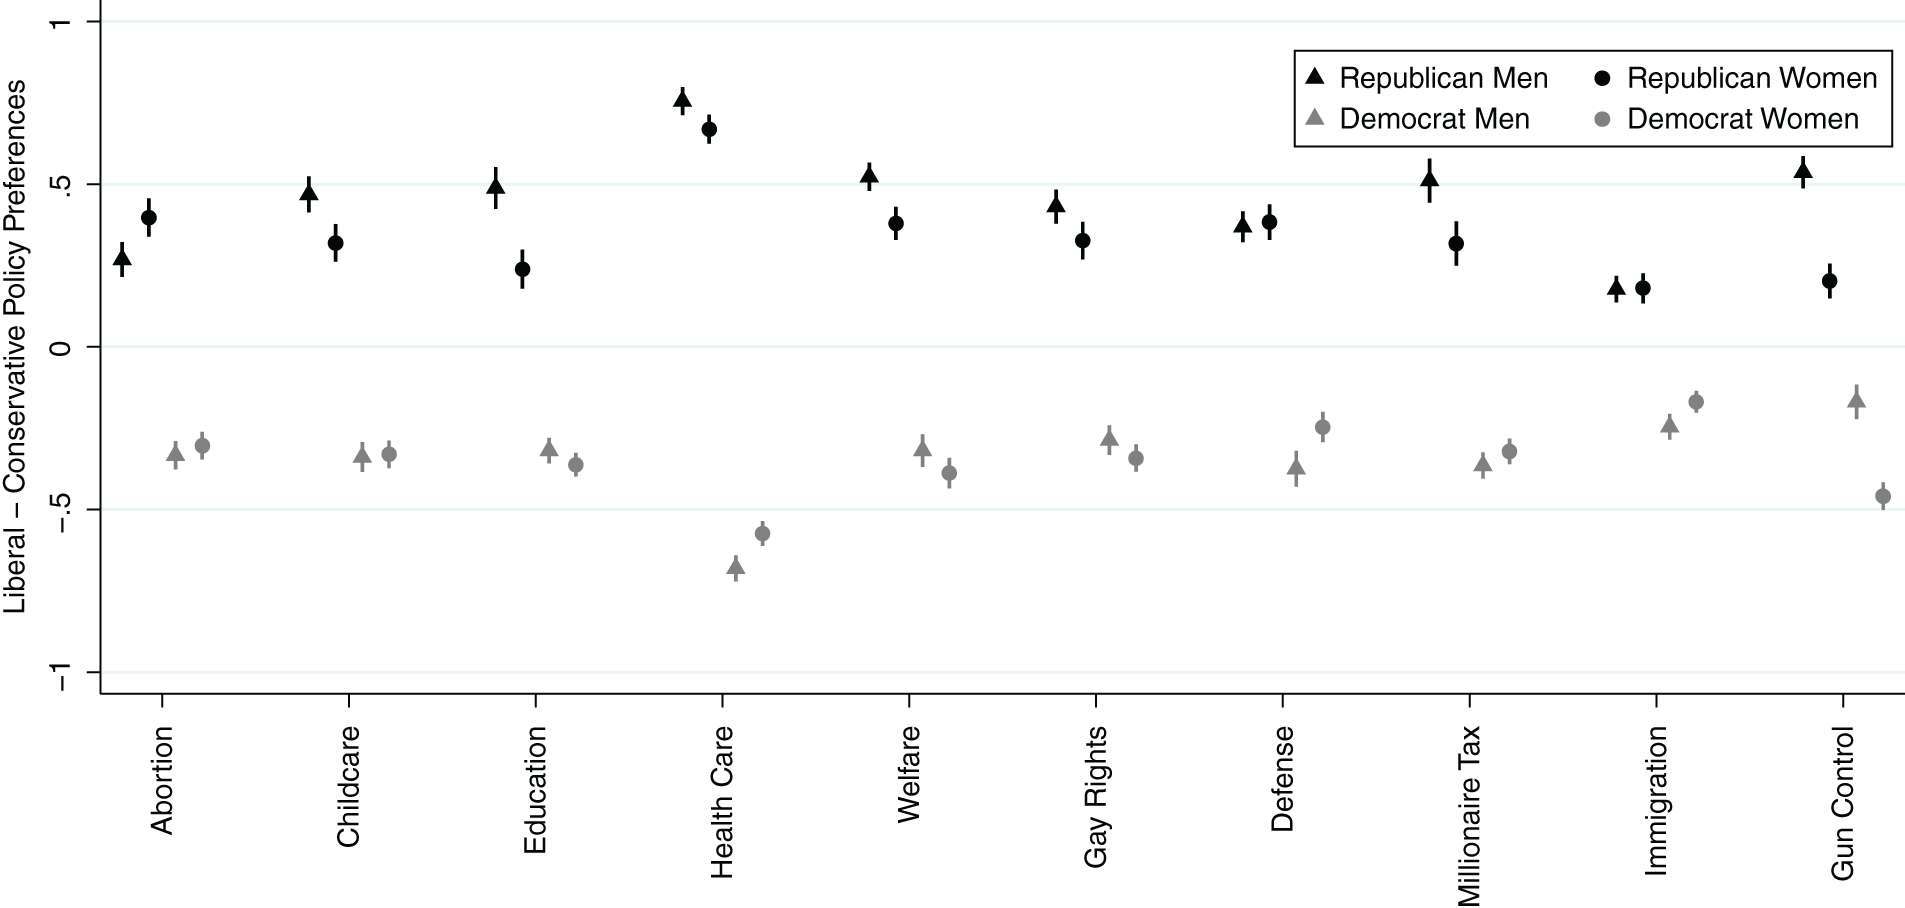
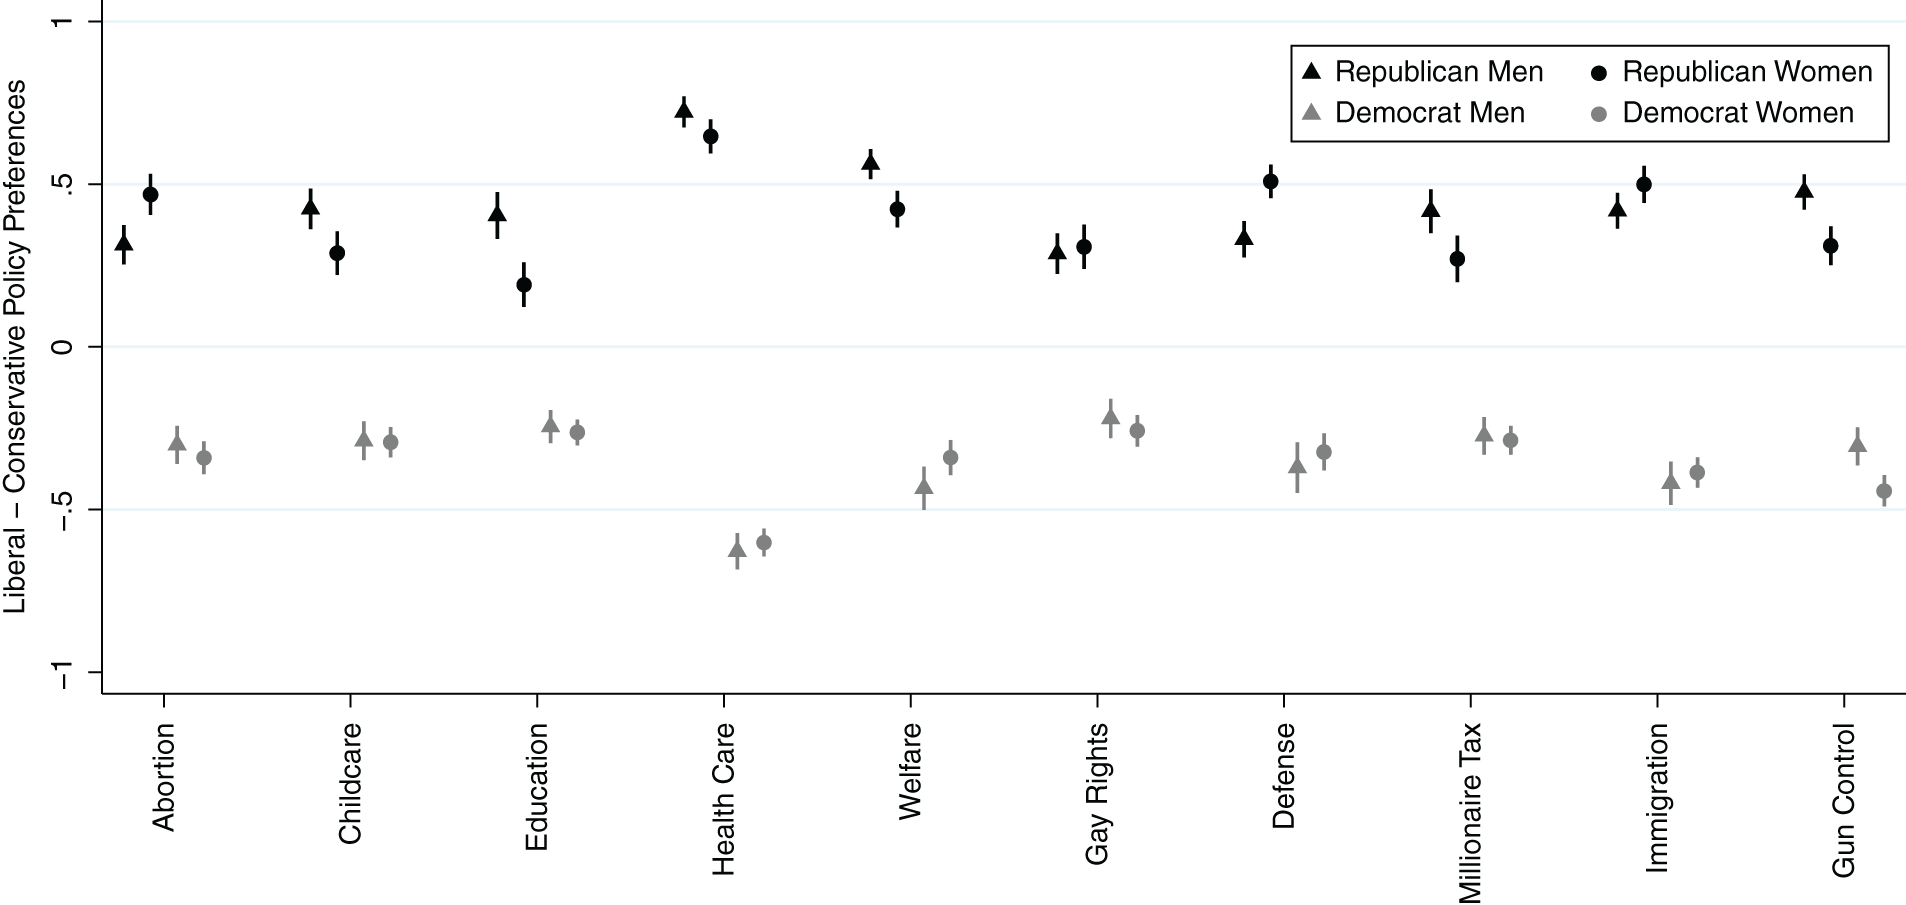
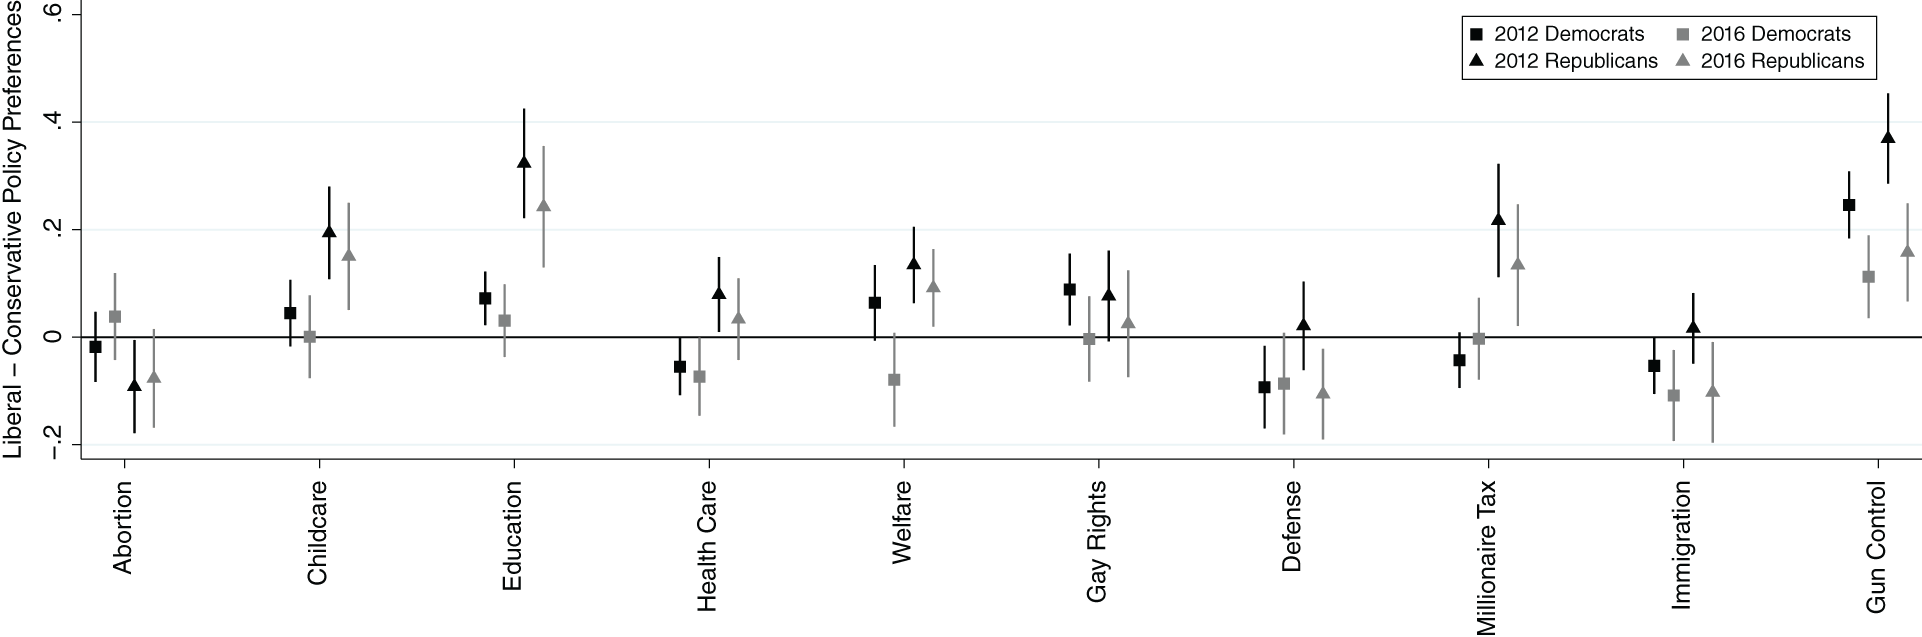
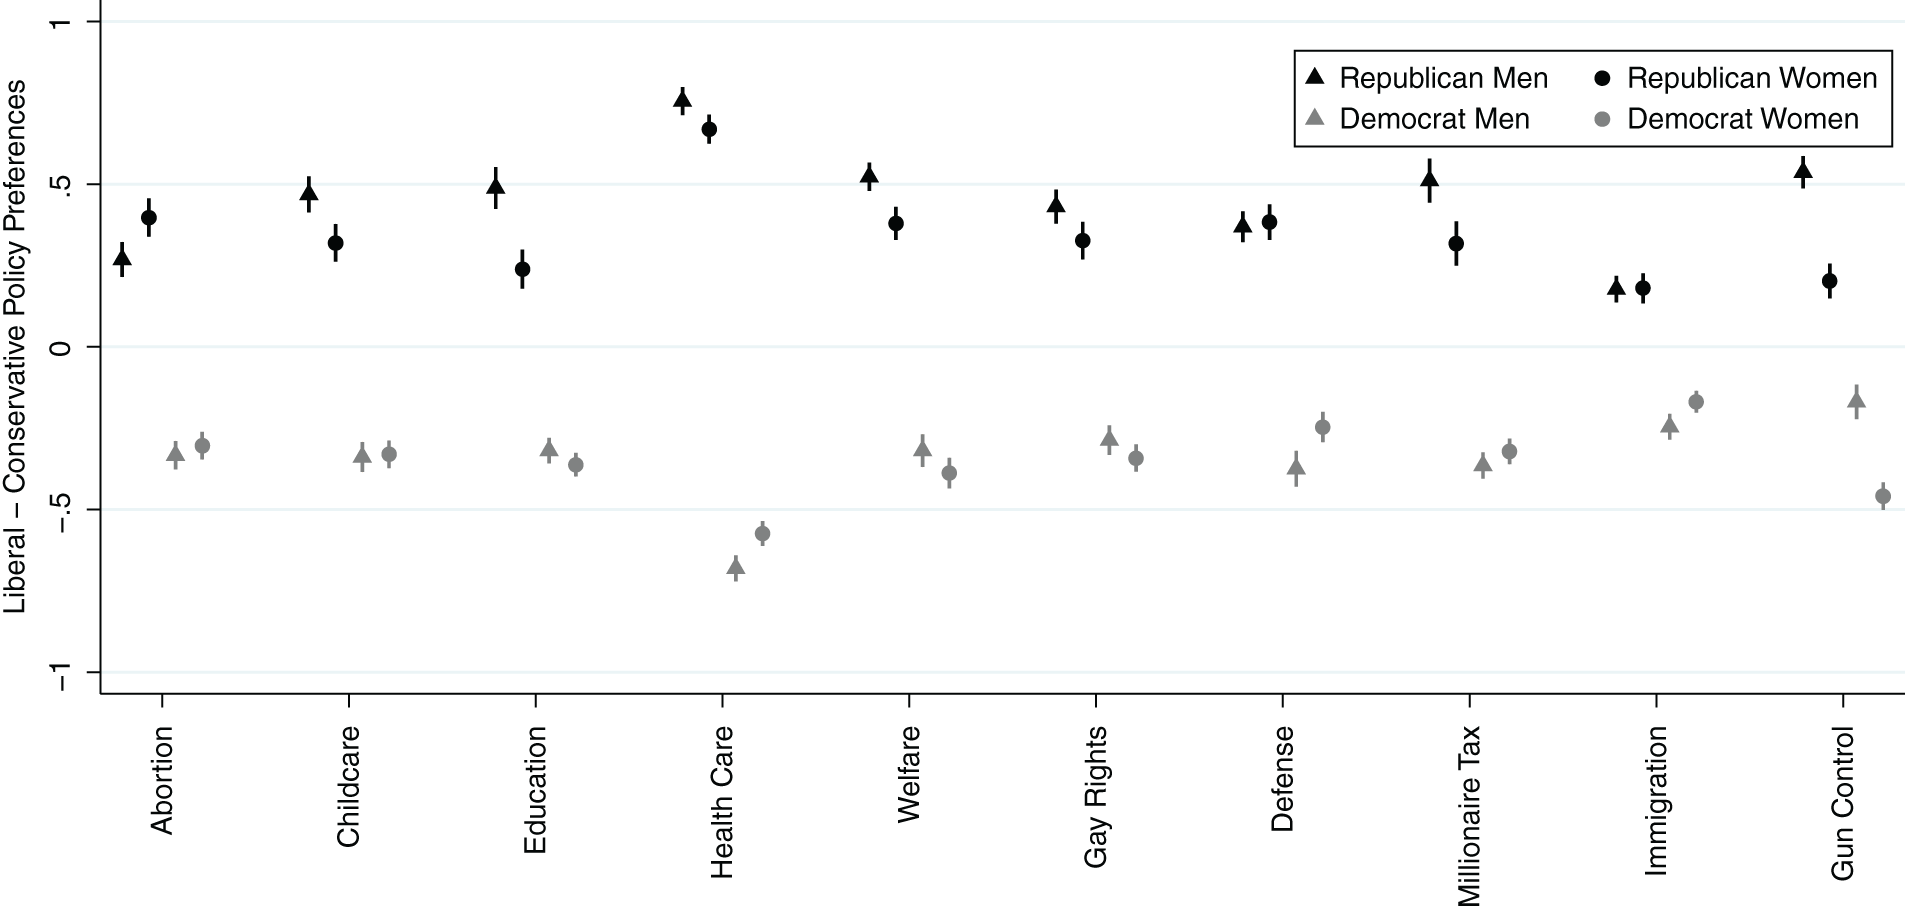
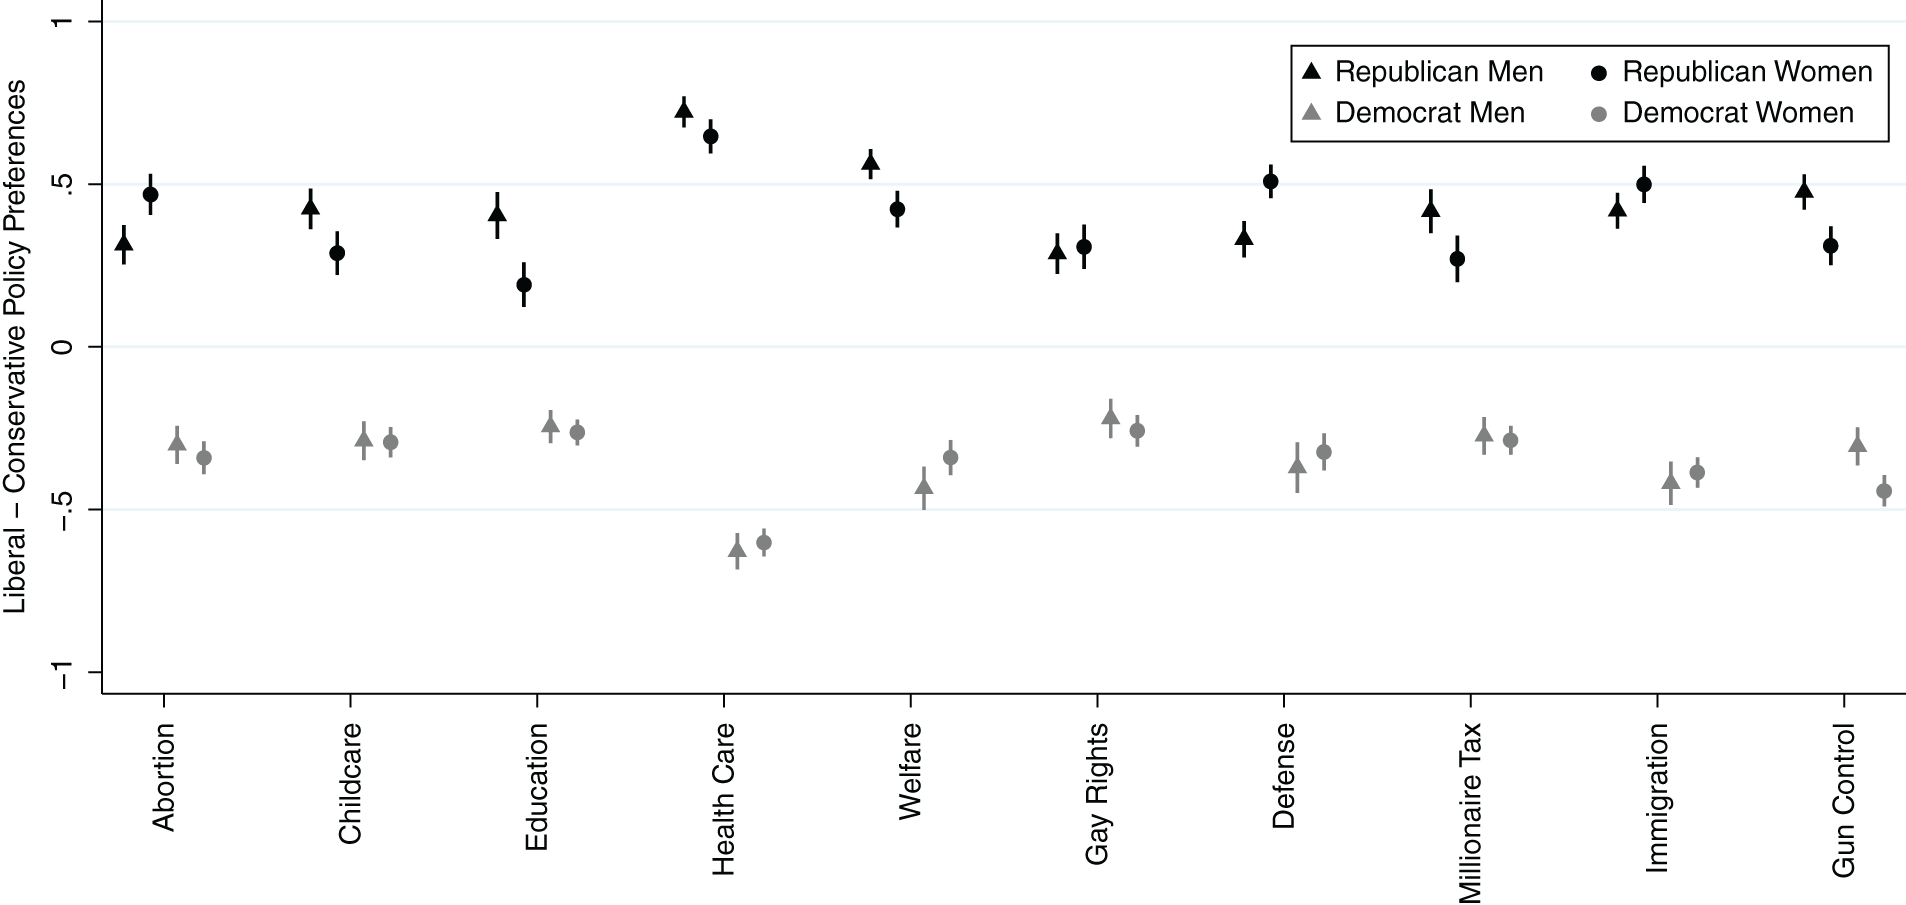
To investigate whether within-party opinion gender gaps are stable across elections, we replicated our prior analysis of the 2012 ANES data using data from 2016. Specifically, we used Adjusted Wald Tests to compare weighted mean issue positions for male and female Republicans and Democrats in 10 policy areas (see online appendix table A1 for question wording). We first graphed the standardized mean policy preferences (i.e., mean of 0; standard deviation of 1) with 84% confidence intervals in figures 1a and 1b to visualize group differences in policy preferences by party and gender. To further facilitate this comparison, figure 2 plots the gender gaps, with positive gaps indicating that women are to the left of men. It is clear from figures 1a and 1b that there are bigger differences between parties than within parties. Figure 2 demonstrates that within-party differences are relatively small; nonetheless, gender differences are more pronounced among Republicans than among Democrats for both 2012 and 2016. Beyond this, gender gaps within parties are fairly stable between the two elections. In both 2012 and 2016, Republican women were more moderate than Republican men on childcare, education spending, welfare, millionaire tax, and gun control.
2012 Policy Preferences by Gender and Party Identification
2016 Policy Preferences by Gender and Party Identification
Note: Figures 1a and 1b plot the standardized means with 84% confidence intervals, allowing us to assess when the means are statistically different at the 95% level.
Gender Gaps by Party Identification
Note: Figure 2 plots the gender gap using standardized means with 95% confidence intervals allowing us to assess when the gaps are statistically different from zero.
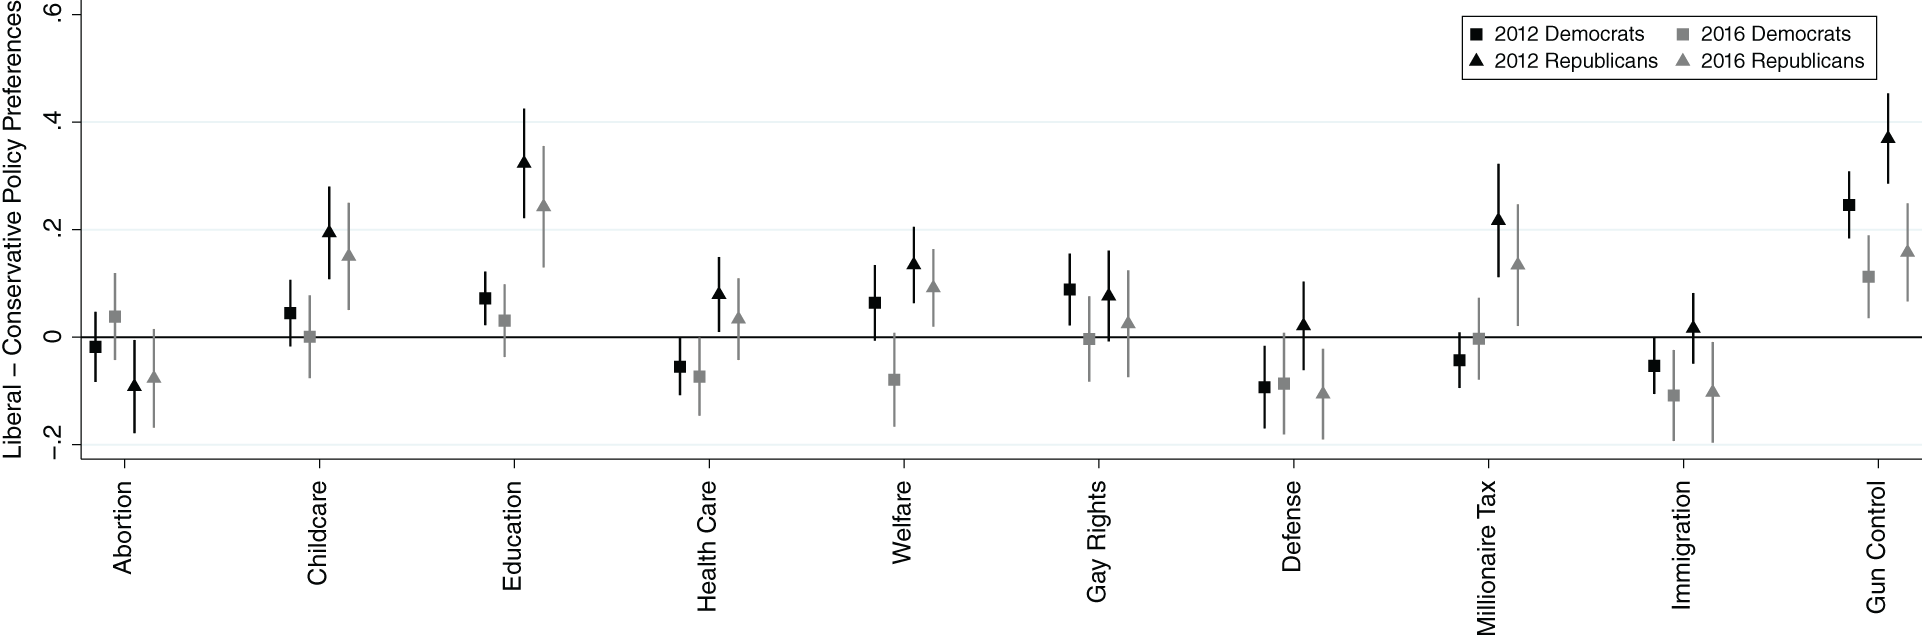
Nevertheless, a few important differences emerge between the two elections. On its face, it appears that Republican women were more conservative than Republican men on abortion in 2012. However, when we controlled for socioeconomic and demographic variables—including religion—the 2012 gap reversed with women being more moderate (online appendix tables B1 and B2). Republican women likewise were more moderate than men on health care spending in 2012. In 2016, however, both the abortion and health care gaps closed. The gender gaps in 2012 may be driven by the fact that these two issues were atypically salient due to debate about the birth-control mandate in the Affordable Care Act and the introduction of state-level abortion exemptions (Deckman and McTague Reference Deckman and McTague2015).
An interesting difference that emerged in 2016 is that Republican women were more conservative on defense spending and immigration compared to Republican men. However, the difference on immigration was not statistically different when we controlled for basic demographic factors (see online appendix table B2). The gap on defense spending is due to women moving even farther to the right than men. This is consistent with Kaufmann’s (Reference Kaufmann2006) findings about the changing salience of defense issues among women voters over time. Democrats, by contrast, displayed fewer gender gaps, and the gaps that do exist are more stable over time. A few shifts in the gaps were apparent in the mean gender gaps graphed in figure 2; however, after we controlled for basic demographics, the gender gaps were remarkably consistent across the two elections (see online appendix tables B3 and B4).
EXPLAINING WITHIN-PARTY GENDER GAPS
Sexism featured prominently in accounts of the 2016 election, and it also was a factor explored in our prior analysis of the 2012 election. Here, we further consider the relationship between policy preferences and sexism. Specifically, we used a standard mediation analysis—that is, we compared the coefficient on gender in models with and without the mediators estimated in a seemingly unrelated regression/logit (see online appendix B for details)—to evaluate whether sexism explains the observed gaps or whether the gaps persist even after accounting for sexism. Given the prevalence of gender gaps among Republicans and their relative absence among Democrats, we focused our analysis on Republicans (for analyses of Democrats, see online appendix tables B3 and B4). In addition to sexism, three factors from previous analyses that explain gender gaps among Republicans are included: ideology, attitudes about the scope of government, and egalitarianism (see online appendix table A2 for measurement details). The results are reported in online appendix tables B1 and B2.
All told, there are more similarities than differences between the two elections. All four factors—hostile sexism, ideology, attitudes about the scope of government, and egalitarianism—are important for explaining gender gaps for four of the 10 issues in 2012 and 2016: childcare, education, health care, and gun control. The same can be said for the millionaire tax in 2012 but not in 2016 because the relationship between sexism and support for the tax was indistinguishable from zero. Likewise, the factors explaining the gender gap in support of gay rights (i.e., hostile sexism and ideology) were consistent across the two elections. With respect to defense spending, ideology was the only mediator that shaped citizens’ policy preferences in either election. Finally, there was no gender gap in support of immigration policy in either election, once controls were included in the models.
Despite similarities across the two elections, important differences do arise. Notably, the changes we observed provide evidence that hostile sexism better explains Republicans’ policy positions on abortion and welfare spending in 2016 compared to 2012. Consider, for instance, that in 2012, women were more supportive of abortion than men, and only ideology explains the gender gap. In 2016, the gender gap for abortion closed, at which point hostile sexism and scope of government also were important for explaining both men’s and women’s attitudes toward abortion. Regarding welfare spending, a gender gap was present in both 2012 and 2016, with Republican women being more supportive of welfare spending than Republican men. Despite the persistence of the gap between the two elections, different attitudes explain support in each election. In particular, sexism does not explain Republicans’ attitudes toward welfare in 2012, but it becomes a relevant factor for explaining their support for welfare in 2016.
Despite similarities across the two elections, important differences do arise. Notably, the changes we observed provide evidence that hostile sexism better explains Republicans’ policy positions on abortion and welfare spending in 2016 compared to 2012.
CONCLUSIONS
Motivated by an interest both in partisanship as a cross-cutting factor shaping gender gaps in opinion and the dynamic nature of these gaps, we explored group differences in policy attitudes in 2012 and 2016. Our findings support the conclusion that party identity is an important cross-pressure among women (Barnes and Cassese Reference Barnes and Cassese2017; Deckman Reference Deckman2016). Although average gender gaps were pervasive across all policy areas in both 2012 and 2016, after we accounted for party identification, few gender gaps persisted—particularly among Democrats. This result suggests that the gender gap stems largely from compositional differences in the parties (Howell and Day Reference Howell and Day2000), the likely result of long-term sorting processes (Kauffman and Petrocik Reference Kaufmann and Petrocik1999).
Despite the unique nature of the 2016 presidential campaign, our results suggest that it did not immediately open up new divisions within the Republican Party (Cassese Reference Cassese2020). With the exception of support for defense spending, we did not observe the emergence of any new gender gaps among Republicans in 2016. If anything, Republican women and men became more similar across the two elections—for example, closing gaps on abortion and health care in 2016. Moreover, opinion was stable among Democratic men and women. Delving into the origins of these gender differences, we uncovered evidence that hostile sexism was more strongly related to policy attitudes in 2016 than in 2012, particularly with respect to welfare spending and abortion. This finding is consistent with recent scholarship that finds that sexist beliefs shaped vote choice among white voters in 2016 but not in previous presidential elections (Cassese and Barnes Reference Cassese and Barnes2019b; Schaffner, MacWilliams, and Nteta Reference Schaffner, MacWilliams and Nteta2018; Valentino, Wayne, and Oceno Reference Valentino, Wayne and Oceno2018).
Despite the unique nature of the 2016 presidential campaign, our results suggest that it did not immediately open up new divisions within the Republican Party.
There are limitations to our analysis. We cannot gauge whether issue importance changed while issue positions remained relatively stable (Kaufmann Reference Kaufmann2006). Moreover, because we relied on two cross sections of the electorate, our analysis does not capture movement in and out of the party. It is possible that voters who find themselves out of step with co-partisans defect and come to identify with the other major party or as politically independent. However, our plots suggest that crossing party lines ostensibly would require a major swing in policy attitudes, given that opinions on these issues are quite polarized. If the 2018 midterms and 2020 presidential race are any indication, gender will remain chronically salient in American elections. However, based on these results, we should not necessarily expect this to radically reorient men’s and women’s relationships to the parties.
DATA AVAILABILITY STATEMENT
Replication materials are available on Harvard Dataverse at https://doi.org/10.7910/DVN/MSC8DO.
SUPPLEMENTARY MATERIALS
To view supplementary material for this article, please visit http://dx.doi.org/10.1017/S1049096520002012.