


Introduction
The formation of depth hoar is a factor responsible for the destabilization of the snow-pack and is consequently one of the causes triggering large numbers of avalanches. Although the principle underlying this metamorphism is known, few quantitative data are available to predict its extent in relation to the meteorological conditions affecting the snow-pack. As a one-dimensional model of changes in the snow-pack was already available, showing how energy transfers take place at the interfaces and within the snow-pack in addition to simulating variations in temperature and density profiles, it was decided to complete it by including the aspect of crystal development and, in particular, the occurrence of depth-hoar crystals.
To do so, a series of cold-room simulation tests in order to monitor the effects of each parameter was decided upon.
Methodology
The experiments were carried out in thermostatic simulation boxes the dimensions of which were 1.50 m in length, 0.70 m in width, and 0.60 m in height. A current of heated air in a compartment at the bottom of each simulation box comprised the heat source. Temperature in the compartment was thermostatically controlled to within 1/10 of a degree Celsius. Another cold-source compartment at the top, ventilated and cooled by an evaporator, enabled temperatures to be varied from –5 to –40°c and was thermostatically controlled to within one degree Celsius. Temperature within the snow was monitored by a vertical rod in the middle of the box fitted with a probe every two centimetres and by probes fitted to the sides of the box. The whole box was insulated by polystyrene panels 12 cm thick and the cold-room temperature was kept at the mean temperature of the heating and cooling compartments. The snow was separated from these compartments by thin metal plates. Two types of simulation box were used:
(a) a box without internal partitions in the case of experiments involving extremely precise temperature monitoring, thereby permitting repeated sampling and measuring;
(b) a box divided into ten thermally insulated compartments to enable several experiments to be conducted simultaneously, either by placing different snow samples in each compartment or by filling them differently in order to obtain different temperature-gradient readings in each box.
A diagram illustrating the first of these types of simulation box is shown in Figure 1.
Diagram showing a simulation box.

Monitoring of metamorphism development was mainly carried out by sampling and by macroscopic photography. Samples were taken using a core sampler capable of removing a cross-section of 7 cm2 over the total depth. Snow samples were subsequently subdivided into 2 cm sections for the purposes of analysis. This analysis consisted of a qualitative examination of the resulting crystals and of measurements of the mean diameter of the grains. These measurements, which were fairly rough, were obtained by photographing a sample and then dividing the total area by the number of crystals. Although this method has the disadvantage of disturbing the medium it enables crystal development to be closely followed.
Endoscopic observation was also attempted, since it does not disturb the medium to the same extent. However, observations are more difficult and not so precise, and this method was subsequently abandoned.
Effects of the various parameters on temperature-gradient metamorphism
Temperature-gradient metamorphism consists of a series of sublimation and recrystallization processes between crystals, caused by imbalances in saturated vapor pressure arising from crystal temperature differences. It is therefore of thermal origin: the temperature gradient  is negative under natural conditions. The value of this gradient will therefore have a considerable influence on the transformation. Other parameters, however, are also involved in the process, namely actual temperature T, density ρ, and the type of crystals initially present (these last two parameters being closely interrelated under natural conditions) which deter-mine porosity.
Effect of the temperature gradient
The temperature gradient determines humidity gradients, inequalities in the degree of air saturation, and the diffusion rate of water vapour. When the same sample is subjected to different negative temperature gradients, crystal growth is found to increase with the modulus of this gradient  A sample of fine-grained snow (mean size, ā= 0.2 mm and density (Fig. 2.) ρ = 200 kg/m3) when exposed to different gradients over a period of 26 d led to the results presented in Table 1.
Photographs of crystals obtained as a function of temperature gradient.

These results are further illustrated by Figure 2 which shows the crystals obtained at –4°C.
In addition, the series of experiments conducted revealed the existence of a threshold around 0.25 deg/cm above which metamorphism becomes truly significant. Below this threshold no TG grains are obtained and only sharp grains (represented by the symbol  ) are found, corresponding to the solid-type depth hoar reported by Reference AkitayaAkitaya (1974).
Mean grain diameter (in mm) after 26 d versus TEMPERATURE GRADIENT AT TWO DIFFERENT TEMPERATURE LEVELS

Effects of density and initial snow type
These two parameters were examined simultaneously since they are very closely related, as illustrated on Figure 3, taken from Reference PahautPahaut (1975), which shows the density distribution versus grain type on the basis of observations made over five winters at the Col de Porte Laboratory.
Density distribution versus grain type.

The effect of snow densification on temperature-gradient metamorphism was consequently investigated and it was shown that this densification reduces the temperature-gradient meta- morphisin. Figure 4 shows that artificially increasing the density of a given sample of fine-grained snow exposed to a constant gradient of –0.55 deg/cm at two different levels over a period of 22 d resulted in two different temperatures, viz. –4 and – 18°C. Densities were 180, 260, and 370 kg/m3. It is obvious that increase in crystal size is a decreasing function of density.
Variation in grain-size versus initial density and temperature.

Insofar as the upper limit is concerned, very dense snow samples with densities exceeding 350 kg/m3 (round grain types) vary little. Recrystallization occurs; round grains became sharp (symbolized by  ) but lack of space obstructs crystal growth. This obstruction was found to consolidate the snow mechanically, thus confirming Akitaya’s observations with respect to hard depth hoar.
It was also observed that fresh snow, when subjected to a negative gradient, first undergoes destructive metamorphism (isothermal process) accompanied by packing, and subsequently metamorphism without packing. All simulations produced similar results with respect to this latter point; the depth of the snow within the box never varied during the experiments and, furthermore, direct density measurements taken at the beginning and end of experiments failed to show any variation. The preceding results are summarized by the diagram in Figure 5.
Effect of temperature-gradient metamorphism versus the initial crystal.

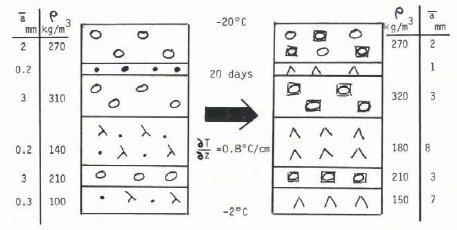
The aforementioned results found for artificially densified snow samples, were again obtained when a naturally stratified snow sample consisting of layers of different density and grain type was subjected to a gradient of –0.8 deg/cm for 20 d. These results are presented in Figure 6. Note, however, that this sample was turned upside down owing to the method of sampling from the box, which explains why the denser layers of snow are found in the upper part of the sample.
Effect of temperature
Temperature influences metamorphism both in terms of its gradient and of its actual value T, which effects crystal size and determines their shape.
Roughly speaking, crystal size is a decreasing function of temperature, so that the largest crystals occur at the bottom of the layer.
Example of transformations of a naturally stratified sample.
The results of all the measurements that were taken are given in table II. The largest crystals occur between –4 and –8°C; they are slightly smaller around 0°C and decrease notably in size beyond – 10°C.
Crystal size (relative value of mean diameter) versus temperature

These values were determined with all other factors remaining unchanged. Obviously, this would not be applicable in the case of a cavity or other disturbing factor. The largest crystals, for instance, are found on top of the layer against the metal plate. This corresponds to the depth-hoar crystals that occur immediately below a layer of ice under natural conditions.
Temperature also affects the shape of TG grains. The photographs in Figure 7 show the characteristic shapes which were obtained during the simulation tests. These shapes are somewhat similar to those observed when snow crystals form in clouds or in surface hoar. This is due to the fact that the formation of depth hoar corresponds to a crystallization from the vapour phase and therefore obeys the general laws governing this type of phenomenon: these laws are equally applicable to both the formation of ice crystals in clouds and that of surface hoar on snow.
These general results have already been reported on a number of occasions (e.g. by Reference PahautPahaut, 1975).
The following results were obtained with respect to depth hoar:
from –2 to – 5°C, striated hexagonal shapes;
around –6(±1)°C, a characteristic needle zone;
from –7 to –10°C, hollow column-like shapes;
from –10 to – 25°C, striated, hexagonal shapes, and plates.
On the other hand, crystals with dendrites are never found.
Hexagonal, plate-like, and pyramidal shapes are often found together. Furthermore, the plates appear to develop initially without any apparent striations; these gradually make their appearance as the crystal grows and run parallel to its six sides. Finally, they develop into ridges as illustrated by the photographs in Figure 8, which show samples at progressive stages of development. These macroscopic striations are, however, typical of depth-hoar crystals.
Reference Hallett and MasonHallett and Mason (1958), studying the formation of crystals in clouds by means of a diffusion chamber, also found in 1958 that traces of organic vapour could modify considerably the nature of the resulting crystals. Traces of camphor, in particular, led to the formation (Fig 7 and Fig 8) of needles at any temperature. In order to demonstrate that the formation of depth hoar is governed by the same laws, a little camphor was placed in a fine-grained snow sample which was then subjected to a negative gradient over a period of 15 d. The results obtained con-firmed the preponderance of needle-type crystals even at low temperatures (-20°C).
Examples of characteristic shapes of depth-hoar crystals.

Depth-hoar crystals at various stages of development showing the gradual appearance of striations.

Depth Hoar Under Natural Conditions
To obtain an effective temperature-gradient metamorphism a steep gradient is required, therefore a limited thickness of snow has to be coupled with low temperatures. The most propitious period in terms of these requirements is early winter: relatively small depths of snow result in a steep gradient and, at the same time, the layer next to the ground is kept within the optimal temperature range of between 0 and -15°C. These were the conditions prevailing in the French Alps during the winters of 1972-73 and 1975-76 (Rey, unpublished) when a large number of slab-avalanche accidents were reported despite an abnormally low snow-fall.
The field work which was carried out during these two winter periods in particular enabled the following observations to be made:
TG grain density was of a similar order of magnitude to that of fine grains (see Fig. 3), thus confirming that temperature gradient metamorphism in such fine grains takes place at constant density.
No TG grains with a density of less than 200 kg/m3 were found. Note, however, that depth hoar of 150 kg/m3 was obtained under laboratory conditions (see Fig. 6). This was probably due to the fact that initial packing during this particular simulation test took place more slowly and more gently than would normally be the case under natural conditions.
Finally, no TG grains of high density were observed. This fact has significant practical implications: the tamping of ski slopes if carried ou t as from the first snow-fall prevents any temperature-gradient metamorphism from occurring.
The Temperature-Gradient Metamorphism Model
It was not considered worthwhile to attempt to simulate all the phenomena involved by solving the set of equations which describes the diffusion of humid air, sublimation, crystalli-zation, supersaturation phenomena, and possible convection. While such a model would not be devoid of theoretical interest, its complexity would be such that it would doubtless fail to prove more useful than a simple, empirical model. The aim of the present research was to predict the occurrence and the extent of the phenomenon and to be able to cumulate over long periods the growth effects which vary through time according to the parameters T,  , and ρ which are considerably modified depending on meteorological conditions.
A numerical model (Reference NavarreNavarre, 1974) had already been developed which simulates changes in snow on the basis of the meteorological parameters characterizing the atmosphere above the snow. This model first solves the problem of the snow-atmosphere interface and then proceeds to deal with heat and mass transfer and changes of state in the layers making up the snow-pack. While this model provides a good representation of temperature distributions in the snow, densification, melting, evaporation, and condensation, i.e. all the phenomena occurring at snow-strata level, it fails to account for processes taking place at grain level, and in particular, the formation of depth hoar.
So the empirical model developed below is intended to complete this numerical model.
Each snow type is defined only by its density ρ and by the mean grain size ā. An attempt is made to predict the values of these parameters: ρ(t) and ā(t).
It is assumed that transformation begins with fine grains of mean size ā0 and density ρ0. As far as ρ is concerned, it was seen earlier that the curve follows simply:

The curve ā(t) was defined empirically as:

where f, g, and h are dimensionless functions from 0 to 1 and as simple as possible consistent with the experiments carried out.
The simulations carried out enabled the functions shown on Figure 9 to be proposed. The functions are found to be linear (for periods of less than 30 d): with

i.e.

Graphs depicting the functions f, g, h, and φ of the temperature-gradient metamorphism model.

It is worth noting that this value is of the same order of magnitude as those suggested by the linear growth curves of ice crystals found by Reference Lamb and HobbsLamb and Hobbs (1971). The functions f, g, and h are therefore coefficients which take into account the values of the parameters affecting metamorphism.
In order to test the validity of the model, two simulation tests were subsequently earned out under conditions which differed slightly from those which had hitherto been used, The first of these tests involved a snow sample of 290 kg/m3 subjected to a gradient of –0.45 deg/cm for 34 d. The second involved a sample of 230 kg/cm3 subjected to a gradient of –0.75 deg/cm over a period of 39 d. The results of these two experiments are presented in Figure 10. They are in good agreement with actual observations. Figure 10 also shows the estimates of crystal size made by an observer. This evaluation tends to be on the high side and it is clear that the observer has estimated the size of well-developed TG grains rather than mean crystal size. On the other hand, it should be noted that the ratio of these estimates to the objective measurements of ā was consistently of the order of 1.6. This is especially valuable since this type of evaluation is easily and quickly made and is particularly suitable for field work.
Results of simulation tests. The straight line is the result given by the model. The dots represent the measurements on each sampling. The crosses show the observer’s estimates. All these results correspond to the level –10°C.

Conclusions
These recent experiments do not, of course, prove the validity of the proposed model, which is clearly only a very rough and ready approximation to reality. They are simply tests which seem to indicate that the model is fairly representative of the phenomenon. This work has also confirmed previous research results on temperature-gradient metamorphism, particularly those of Akitaya. Above all it has enabled the effects of gradient, temperature, and density parameters upon metamorphism, defined only by crystal size, to be quantified.
Acknowledgements
This research was conducted at the Centre d’Étude de la Neige in the laboratories located at Col de Porte and La Croix de Chamrousse, Isére, France, in the context of a contract executed on behalf of the Direction de la Sécurité Civile.



