Introduction
Compared to the Weddell Sea there has been limited scientific sampling of fishes in the Ross Sea, with few systematic surveys aimed at describing the community of fishes. Recent major studies of the Ross Sea fish fauna include Eastman & Hubold (Reference Eastman and Hubold1999) who recorded 47 demersal species including four new species. Donnelly et al. (Reference Donnelly, Torres, Sutton and Simoniello2004) reported 45 species of benthic and pelagic fishes sampled from midwater and bottom trawls in areas in the eastern Ross Sea, and found highest diversity between 450 and 500 m depth. La Mesa et al. (Reference La Mesa, Cattaneo-Vietti and Vacchi2006) and Vacchi et al. (Reference Vacchi, La Mesa and Greco2000) sampled relatively shallow depths down to 700 m using gill and trammel nets, longlines, traps, and Agassiz trawls in the western Ross Sea. These and other studies have highlighted the need to employ a variety of sampling methods to obtain representative samples of the fishes which range from small benthic species such as barbeled plunderfishes (Artedidraconidae) to large semi-pelagic species such as the Antarctic toothfish (Dissostichus mawsoni).
The New Zealand Government has funded two expeditions to survey Ross Sea biodiversity using the RV Tangaroa. The first survey (termed BioRoss) sampled demersal species in the area off Cape Adare in the north-west of the Ross Sea and also at the Balleny Islands in 2004 (Mitchell & Clark Reference Mitchell and Clark2004). The second (termed IPY-CAML) sampled demersal and midwater species on the continental shelf and slope of the Ross Sea as well as the Admiralty and Scott seamounts to the north of the Ross Sea down to depths of 3500 m (Hanchet et al. Reference Hanchet, Mitchell, Bowden, Clark, Hall and O'Driscoll2008a). Clark et al. (Reference Clark, Dunn, McMillan, Pinkerton, Stewart and Hanchet2010) examined the distribution of 65 demersal fish species taken during these two surveys to determine if demersal fish communities varied throughout the region, and considered environmental factors that might influence the communities. Three broad assemblages were identified, in the southern Ross Sea, central-northern Ross Sea, and the seamounts further north where some species more typical of sub-Antarctic latitudes were observed.
The pelagic fish fauna of the Ross Sea was first analysed by de Witt (Reference DeWitt1970), who concluded that catches over the continental shelf was almost entirely (99%) dominated by the Antarctic silverfish (Pleuragramma antarctica) and that oceanic pelagic fishes, such as lanternfishes (Myctophidae) were confined to the north. Donnelly et al. (Reference Donnelly, Torres, Sutton and Simoniello2004) classified the pelagic assemblages as either oceanic or continental shelf. The pelagic assemblage (0–1000 m) was dominated by four families (bathylagids, gonostomatids, myctophids, paralepids) but these were replaced over the continental shelf by notothenioids, primarily P. antarctica. O'Driscoll et al. (Reference O'Driscoll, Macaulay, Gauthier, Pinkerton and Hanchet2011) presented preliminary results of midwater trawling from the IPY-CAML survey focusing on the distribution and biomass of P. antarctica in the western Ross Sea.
An exploratory longline fishery by New Zealand flagged vessels for toothfish (Dissostichus spp.) has operated in the Ross Sea region, north to 60°S (CCAMLR Subarea 88.1) since 1998 (Hanchet et al. Reference Hanchet, Mormede and Dunn2010). The fishery operates at depths of 600–1800 m on the shelf and slope of the Ross Sea as well as the banks, ridges, and seamounts to the north. Although estimates of D. mawsoni abundance and sustainable yields are available (SC-CAMLR 2011), the abundance of the main demersal bycatch species such as macrourids has proved more difficult to assess (Hanchet et al. Reference Hanchet, O'Driscoll, Ballara and Dunn2008b). Therefore, one of the main objectives of the IPY-CAML survey was to estimate the relative abundance of demersal fish on parts of the continental shelf and slope of the Ross Sea. Over the course of the fishery many specimens have been collected by observers and registered into the New Zealand National Fish Collection at the Museum of New Zealand Te Papa Tongarewa (Te Papa). This has led to the description of several new species of fishes (e.g. Møller & Stewart Reference Møller and Stewart2006, Eakin et al. Reference Eakin, Eastman and Near2009), and these, plus other Te Papa specimens which represent new records, are also considered here.
This paper is a contribution to research on the biodiversity of the Ross Sea region of Antarctica as part of the Census of Antarctic Marine Life (CAML) - International Polar Year (IPY). We present the results from two surveys carried out in 2004 and 2008 to obtain new data on the biodiversity of the demersal and pelagic fish fauna of the western Ross Sea (between 160°E and 170°W, south of 71°S) and adjacent northern seamounts (65–68°S). The main aims of the study were to improve our knowledge of fish species diversity, distribution and relative abundance in these two regions. The list of species known from the shelf and slope of the Ross Sea (down to 2000 m) is updated, and a species list for the rest of the Ross Sea region (north to 60°S) is assembled for the first time.
Methods
Survey area
The BioRoss survey took place in January–March 2004, and sampling was carried out along a series of five transects encompassing depths of 123–1165 m between Cape Adare and Cape Hallet in the north-west Ross Sea and on four separate locations at the Balleny Islands (Mitchell & Clark Reference Mitchell and Clark2004). The IPY-CAML survey was carried out in January–March 2008, and was designed to sample a wide range of habitats and depths covering the continental shelf, slope, abyss, and seamounts at depths of 280–3500 m in the Ross Sea region (Hanchet et al. Reference Hanchet, Mitchell, Bowden, Clark, Hall and O'Driscoll2008a). The sampling locations of the demersal and midwater trawl stations are shown in Fig. 1.
Survey area showing demersal (o) and midwater (x) trawl locations. Depth contours at 200, 400, 600, 1200, and 2000 m and boundaries of shelf and slope strata.

Vessel and gear specifications
The RV Tangaroa is a 70 m long, 2000 GRT, stern trawler owned and operated by the National Institute of Water and Atmospheric Research (NIWA). Whilst it has an ice-strengthened hull, it is not an ice-breaker and so was restricted in the areas that she was capable of working. A number of biological sampling gear types were deployed during the surveys (epibenthic sleds, beam trawls and fish trawls).
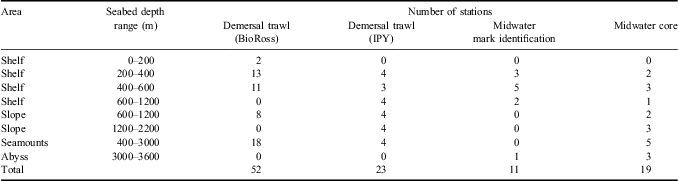
The NIWA rough bottom trawl net was deployed at 75 stations to sample demersal species between 70 and 1990 m depth (Table I). This net had a mouth width of 25 m and a codend of 60-mm mesh fitted with a 40-mm liner to retain smaller fish. SCANMAR sensors and a netsonde were attached to the doors and net to record doorspread and headline height respectively, and to determine bottom contact time. The doorspread averaged 80 m (range 65–91 m) and the headline height averaged 5.1 m (range 3.8–7.5 m). Standard tows were of 20 min duration at a speed over the ground of three knots.
Number of demersal trawls carried out for the BioRoss (BioRoss) and IPY-CAML (IPY) surveys, and number of mark identification and core midwater trawls carried out for the IPY-CAML survey.
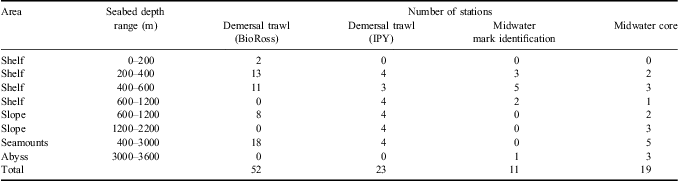
One of the objectives of the IPY-CAML survey was to determine relative abundance estimates of demersal fish species for selected parts of the Ross Sea shelf and slope using a random stratified trawl survey. The trawl survey of the shelf was focused mainly on icefishes and nototheniids, and the area was stratified by depth into 200–400, 400–600, and 600–1200 m (Fig. 1). The trawl survey of the slope area was designed to target macrourids as they are the main bycatch species in the toothfish fishery (Hanchet et al. Reference Hanchet, O'Driscoll, Ballara and Dunn2008b). The slope was split by depth and area into four strata based on macrourid catch rates in the fishery, with a geographic split at 178°50′E and a depth split at 1200 m (Fig. 1). Unfortunately the Iselin Bank was covered by thick ice at the time of the survey and so the eastern slope strata could not be surveyed and sampling in the western strata was much reduced. However, at least three random demersal trawls were completed in each of the three shelf strata and the western two slope strata (Table I).
The NIWA mesopelagic midwater trawl was deployed at 30 stations, 19 of these were core stations for sampling biodiversity and an additional 11 were for acoustic mark identification (Table I). This trawl has a circular mouth opening of about 12 m diameter, a cod-end mesh of 10 mm, and is rated to a maximum depth of 1200 m. It is similar to the IYGPT (International Young Gadoid Pelagic Trawl), which was recommended by CAML for sampling pelagic fish layers. At core stations, the midwater trawl was deployed to a maximum depth of 1000 m, or about 50 m above the seabed where water depth was less than 1000 m. The net was then towed obliquely at three knots, hauling warp to achieve an ascent rate of c. 20 m per minute. During tows for acoustic mark identification, the midwater trawl was targeted at the mark of interest and towed for 20–30 min at three to four knots.
Other benthic sampling gear deployed included a 4 m wide beam trawl with a 25-mm mesh, a 1 m wide epibenthic sled designed for sampling epifauna on rough terrain, and a fine meshed Brenke sled designed for sampling free-swimming epifauna (Mitchell & Clark Reference Mitchell and Clark2004, Hanchet et al. Reference Hanchet, Mitchell, Bowden, Clark, Hall and O'Driscoll2008a). The catches from these sampling gears were not considered here in detail because of differences in the catch composition of each gear type (Clark et al. Reference Clark, Dunn, McMillan, Pinkerton, Stewart and Hanchet2010), but new species and locality records from them were included.
Catch sampling and identification
On the BioRoss and IPY surveys, catch samples were sorted at sea, identified to the lowest possible taxonomic level (operational taxonomic unit (OTU)) and weighed on motion-compensating 100 kg scales to the nearest 0.1 kg. Species were identified following Gon & Heemstra (Reference Gon and Heemstra1990) supplemented by subsequently published taxonomic papers on Southern Ocean fishes (e.g. Kuhn & Near Reference Kuhn and Near2009, Balushkin & Prirodina Reference Balushkin and Prirodina2010b). Vouchers of each OTU were taken, and registered into Te Papa. Tissue samples were also taken from the voucher specimens to include in the Fish barcode of life project. Some specimens were re-examined onshore to confirm accuracy and consistency of identifications and where possible, identifications were crosschecked using DNA barcoding (Smith et al. Reference Smith, Steinke, Dettai, McMillan, Welsford, Stewart and Ward2012).
After the IPY-CAML survey was completed it was discovered that specimens originally identified as Macrourus whitsoni belonged to two species: Macrourus whitsoni and a new sympatric species Macrourus caml McMillan, Iwamoto, Stewart & Smith (McMillan et al. Reference Smith, Steinke, Dettai, McMillan, Welsford, Stewart and Ward2012). A small number of Macrourus specimens retained for Te Papa were re-identified, but the remaining specimens were discarded during the surveys and so their identity is unknown. For the purposes of the report we have referred to them as Macrourus spp. At the time of the preparation of this manuscript specimens of the Family Liparidae captured during the surveys were undergoing taxonomic re-examination and re-evaluation by Dr David Stein, so in the analysis we used only the three OTUs identified at the time of the surveys. The subsequent publication by Stein (Reference Stein2012) has since allowed the new species names to be incorporated into Table II.
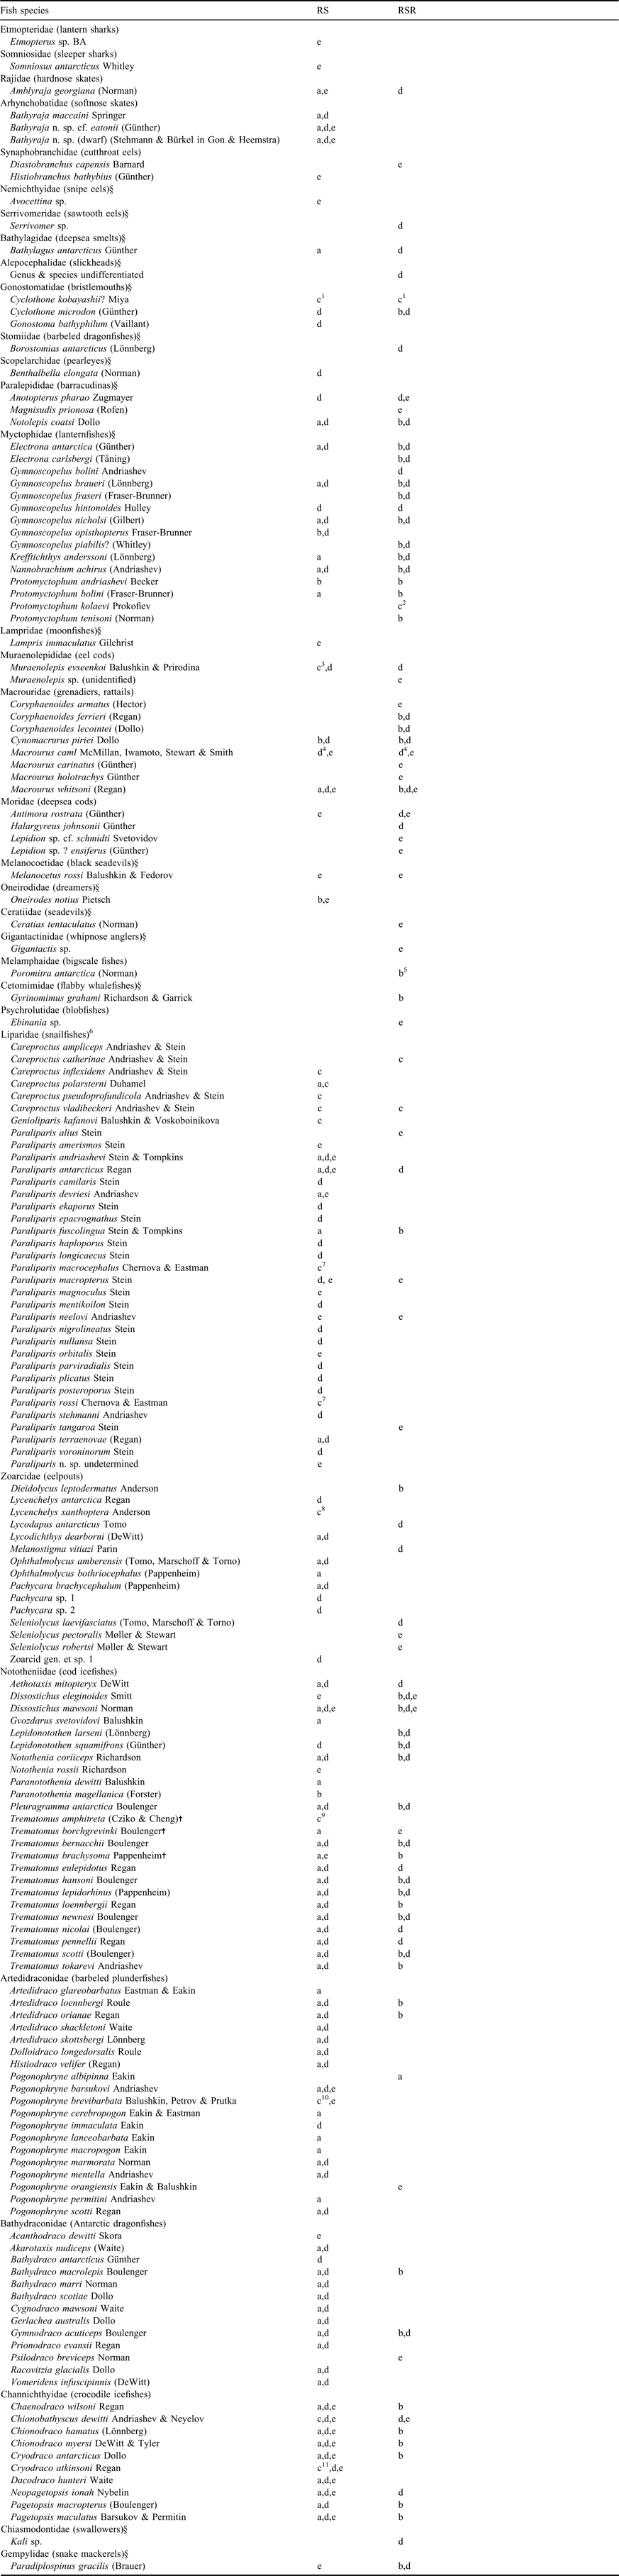
Fishes of the Ross Sea (RS) adapted from Eastman & Hubold (Reference Eastman and Hubold1999) including the mesopelagic and demersal fauna of the shelf and slope down to a depth of 2000 m (northern limit is Cape Adare and Iselin Bank at about 71–72°S) and the rest of the Ross Sea region (RSR) 71–72° north to 60°S with an eastern limit at 150°W and western limit at 160°E (Ross dependency). Includes original source (a = Eastman & Hubold Reference Eastman and Hubold1999, b = Gon & Heemstra Reference Gon and Heemstra1990, c = new record after 1999) as well as all specimens recorded in this study (d = BioRoss and/or IPY-CAML surveys, e = NZ longline toothfish fishery). Species names are from Gon & Heemstra (Reference Gon and Heemstra1990), Eastman & Eakin (Reference Eastman and Eakin1999) and Eschmeyer & Fricke (Reference Eschmeyer and Fricke2011). Family names are from Nelson (Reference Nelson2006).
† = placement in Trematomus follows Kuhn & Near (Reference Kuhn and Near2009), § = families considered to be pelagic.
1Donnelly et al. (Reference Donnelly, Torres, Sutton and Simoniello2004), 2Prokofiev (Reference Prokofiev2005), 3Balushkin & Prirodina (Reference Balushkin and Prirodina2010b), 4McMillan et al. (Reference McMillan, Iwamoto, Stewart and Smith2012), 5Kotlyar (Reference Kotlyar2009), 6Stein (2012), 7Chernova & Eastman (Reference Chernova and Eastman2001), 8Struthers & Møller (2009), 9Cziko & Cheng (Reference Cziko and Cheng2006), 10Balushkin et al. (Reference Balushkin, Petrov and Prutko2011), 11La Mesa et al. (Reference La Mesa, Vacchi, Iwami and Eastman2002).
Longline fishing for Dissostichus spp. has been carried out throughout the Ross Sea region since 1998 (Hanchet et al. Reference Hanchet, Mormede and Dunn2010). Observers have been instructed to collect and retain unusual fish specimens caught on longlines or recovered from toothfish stomachs. These specimens were identified and registered into the Te Papa fish collection. Records from the Te Papa fish collection were examined to determine new location records for fish species in the Ross Sea and the rest of the Ross Sea region defined here as the area extending north from the Ross Sea to 60°S and from 150°E–150°W.
Data analyses
Diversity conventionally consists of two elements: the number of taxa present (species-richness), and the evenness of their relative abundances. It can also be defined in three forms: point (alpha) diversity, regional (gamma) diversity, and the difference in assemblage composition from one point to another or between local and regional diversity (beta diversity) (Koleff et al. Reference Koleff, Gaston and Lennon2003). We examined alpha diversity (at the station level) and where possible gamma diversity (at the regional level) for the demersal trawls and the midwater trawls separately. Demersal tows where there was gear damage that may have affected the catch were excluded from analysis (n = 7).
A preliminary examination of the fish species collected from the demersal trawl showed that they included a number of mesopelagic species such as myctophids, which had presumably been caught during the descent and ascent of the trawl net. To be consistent with previous studies (e.g. Clark et al. Reference Clark, Dunn, McMillan, Pinkerton, Stewart and Hanchet2010, Causse et al. Reference Causse, Ozouf-Costaz, Koubbi, Lamy, Eléaume, Dettai, Duhamel, Busson, Pruvost, Beaman and Riddle2011), these mesopelagic fish species including P. antarctica, were excluded from the analyses of species diversity from the demersal trawls. Where the number of species in a trawl was less than three, those trawls were excluded on the assumption that it was unrealistic to expect such a small number of species to be present, and hence those catches were not representative of the real underlying diversity. This reduced the datasets for subsequent analyses to 57 demersal trawls and 18 midwater trawls. Species-richness, and species diversity using the Shannon-Weaver (H) diversity, Margalef's richness (SR), and Pielou's evenness (J) statistics were calculated for each trawl station using PRIMER v6 (Primer-E Ltd). The diversity indices were based on abundance data as most trawls were towed for a similar distance.
The cumulative species-richness was plotted against the cumulative number of tows to assess the adequacy of the survey data for describing species-richness at the regional level. The overall curves were calculated from 1000 permutations based upon different random orders of the tows. The asymptotic richness was estimated from a fitted curve of the form H = aN/(1+bN), where a and b are constants, N is the number of tows sampled, and the asymptote is given by a/b. Where sufficient data were available gamma diversity was estimated for the shelf, slope, and seamount and for the Ross Sea as a whole (shelf and slope) for the demersal and midwater trawl stations separately. Midwater trawl stations made near seamounts and over the abyss were in similar locations and had similar depth characteristics and so were combined for this analysis. For the purpose of these analyses we defined the slope to be between 600 m and 2000 m extending along the northern edge of the Ross Sea.
Catch rates in kg km-2 were calculated for the eight most abundant species caught in the demersal trawls by dividing the catch at each station by the area swept (distance between the wings (25 m) multiplied by the distance towed). Relative biomass estimates (and coefficients of variation) and scaled length-frequency distributions for these species in the demersal trawl were estimated for the five shelf and slope strata in the IPY-CAML survey using the NIWA TrawlSurvey analysis program. The following assumptions were made for estimating biomass: the area swept during each tow equalled the distance between the wings (25 m) multiplied by the distance towed, and that values of vulnerability, vertical availability, and areal availability were all equal to 1.0.
Results
Species composition
Station details, catch weight, and species-richness for all the demersal and midwater trawls are given in Tables S1 & S2, which will be found at http://dx.doi.org/10.1017/S0954102012001265. A total of 75 demersal trawls were made over the two surveys with a combined total catch weight of 4862 kg (Table S1). Catches were dominated by Lepidonotothen squamifrons (59% by weight and 57% by number), Macrourus spp. (25% and 11%), and P. antarctica (3% and 18%). Catches per tow varied considerably between areas ranging from 0–50 kg on the shelf, 2–430 kg on the slope and 2–1470 kg on the seamounts. Catches on the shelf were dominated by P. antarctica, Trematomus eulepidotus, Neopagetopsis ionah and Chionodraco hamatus. Catches on the slope and seamounts were dominated numerically by Macrourus spp. and L. squamifrons respectively. The demersal trawls recorded 74 species/OTUs in the Ross Sea (of which 11 were considered pelagic) and 38 from the rest of the Ross Sea region (13 pelagic). Based on the OTUs most of the demersal species were from five families: Nototheniidae, Artedidraconidae, Bathydraconidae, Channichthyidae, and Zoarcidae.
A total of 30 midwater trawls were made during the IPY-CAML survey with a combined total catch weight of 1030 t (Table S2, which will be found at http://dx.doi.org/10.1017/S0954102012001265). Catches were dominated by P. antarctica (91% by weight and 93% by number), followed by channichthyiids (4.2% and 0.3%), and myctophids (2.7% and 4.1%). The midwater trawls recorded 23 species from the Ross Sea and 21 species from the rest of the Ross Sea region.
A total of 3941 specimens have been registered to date into the Te Papa National Fish Collection from the Southern Ocean, including 1363 specimens from the BioRoss survey and 1271 specimens from the IPY-CAML survey. All species caught during these two surveys are listed in Table II. The revised list of species for the Ross Sea includes the original species list for the Ross Sea from Eastman & Hubold (Reference Eastman and Hubold1999), subsequent taxonomic publications (e.g. Møller & Stewart Reference Møller and Stewart2006, Balushkin & Prirodina Reference Balushkin and Prirodina2010a), and the new species and location records from the surveys and toothfish fishery in the current study and equalled a total of 135 species (Table II). The list of species for the rest of the Ross Sea region drew mainly from the species listed in Gon & Heemstra (Reference Gon and Heemstra1990) and the new species and location records from the current study and equalled a total of 95 species (Table II). The total species count for the entire Ross Sea region equalled 175 species. The noteworthy systematic and zoogeographic findings from this study are presented in more detail in Table III.
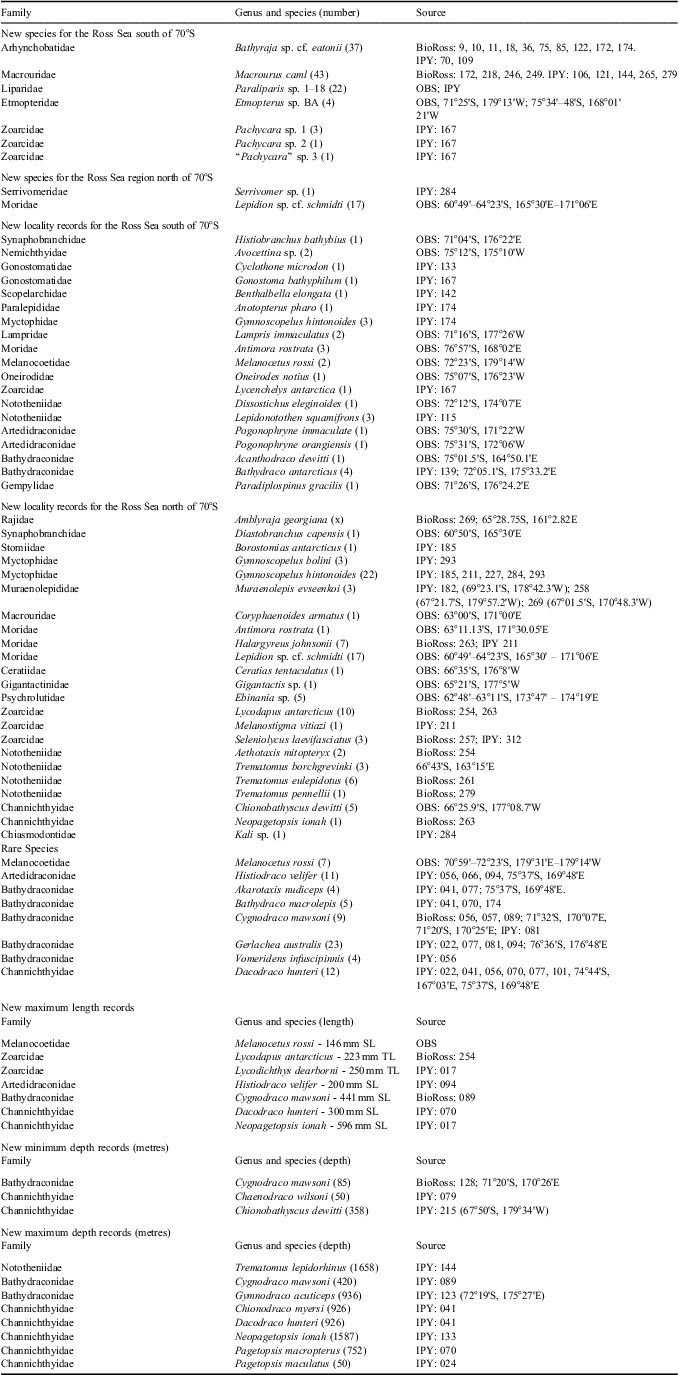
Specimens of systematic and zoogeographic significance including new species, new locality, and new depth records for species collected during the BioRoss and IPY-CAML surveys, and from the New Zealand toothfish fishery in the Ross Sea and Ross Sea region. Source: OBS = toothfish fishery, with location; BioRoss = BioRoss survey with station number; IPY = IPY-CAML survey with station number (location if taken by beam trawl or epibenthic sled). All records are based on specimens held at the Museum of New Zealand Te Papa Tongarewa. TL = total length, SL = standard length.
Diversity indices
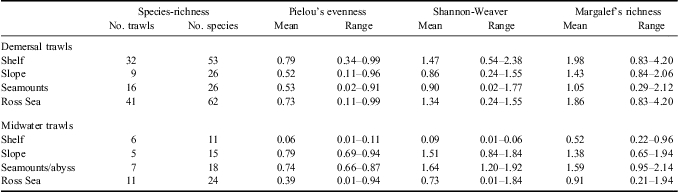
Species-richness at the alpha level ranged from 1–13 for the midwater trawls and 1–20 for the demersal trawls (Tables S1 & S2, which will be found at http://dx.doi.org/10.1017/S0954102012001265). The highest richness for demersal fish occurred at two stations on the shelf in 350–450 m, and in general declined northwards from the shelf to the northern seamounts (Fig. 2, Table IV). In contrast, species-richness for pelagic fish was greatest in the northern seamounts/abyssal stations and declined southwards to the shelf.
Spatial distribution of species-richness for demersal fish from demersal tows (left) and for all fish from midwater tows (right). Circle size proportional to species-richness with a maximum of 20 species for demersal trawls and 13 species for midwater trawls. Depth contours at 200, 400, 600, 1200, and 2000 m.
Summary of species-richness, and mean and range of Pielou's evenness, Shannon-Weaver diversity, and Margalef's richness diversity indices at the regional level and the Ross Sea (shelf and slope combined) for demersal and midwater trawls separately.
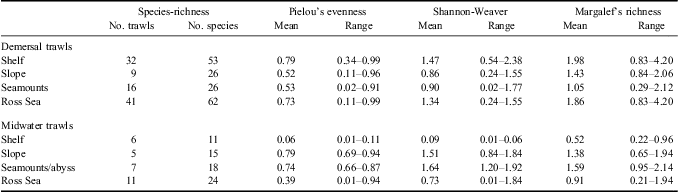
The species-richness at the gamma level for demersal trawls was highest on the shelf with 53 species whilst the slope and seamounts each had 26 species (Table IV). However, the cumulative species-richness curves for the demersal fish species for the regions were not yet asymptotic, indicating that the richness was not fully sampled and more trawls were made on the shelf than in the other two regions (Fig. 3). A more valid comparison of gamma diversity can be obtained by comparing species-richness between regions for a given number of trawls. Based on a sample of ten trawls gamma diversity was highest on the shelf, intermediate on the slope and lowest on the seamounts (Fig. 3). The Shannon-Weaver and Margalef diversity indices showed very similar patterns, with the mean value for seamounts being c. 50–60% of the mean value for the shelf (Table IV). The Pielou's statistic suggested that catches were more even on the shelf than on the slope and seamounts where catches were sometimes dominated by large catches of L. squamifrons or Macrourus spp. A fitted curve estimated the asymptotic richness at 77 demersal species for the Ross Sea (shelf and slope) as a whole.
Number of tows and the cumulative number of demersal fish species sampled by the demersal trawl on the shelf, slope, seamounts, and the Ross Sea (shelf and slope combined). The asymptote for the Ross Sea was 77 species.
The species-richness at the gamma level for midwater trawls was highest on the seamounts/abyss with 18 species, followed by the slope with 15 species and the shelf with 11 species (Table IV). However, the cumulative species-richness curves again indicated that the richness was not fully sampled (Fig. 4). Based on a sample of five trawls gamma diversity was similar for the seamounts/abyss and slope and lowest on the shelf (Fig. 4). The Shannon-Weaver and Margalef diversity indices showed similar patterns, with the seamount/abyss having slightly higher diversity and richness than the slope (Table IV). However, the values for the Shannon-Weaver and Pielous evenness statistics on the shelf were very low reflecting the dominance of P. antarctica at these stations. A fitted curve estimated the asymptotic richness at 35 pelagic species for the Ross Sea as a whole.
Number of tows and the cumulative number of fish species sampled by the midwater trawl for the shelf, slope, seamounts, and the Ross Sea (shelf and slope combined). The asymptote for the Ross Sea was 35 species.
Catch rates and biomass
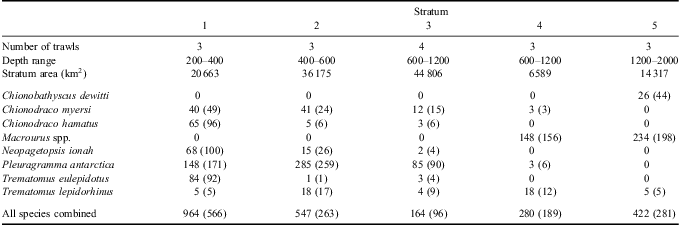
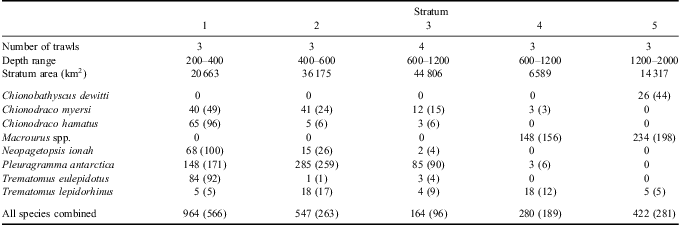
The spatial distribution of the nine most abundant species caught by demersal trawl was highly variable (Fig. 5). Lepidonotothen squamifrons was most abundant in depths of 100–400 m on the seamounts with the highest catch rates from around the Balleny Islands. They were virtually absent from the Ross Sea, and so mean catch rates and biomass for the shelf and slope strata are not presented. The highest catch rates of Macrourus spp. came from the two slope strata at depths of 600–2000 m (Table V, Fig. 5). They were caught in lower numbers from the seamounts and were absent from deeper waters of the shelf south of the shelf break. Mean catch rates of P. antarctica were highest at 400–600 m, but they were caught from throughout the shelf region extending in low numbers to the upper slope and the northern seamounts. The highest catch rates of T. lepidorhinus were made at 200–600 m from near Cape Adare (Fig. 5), whilst catch rates further south in the shelf stratum and on the slope were much lower and they were absent from the seamounts. In contrast, catch rates of T. eulepidotus were highest at 200–400 m on the Ross Sea shelf (Table V) and seamounts (Fig. 5) and lower in deeper water elsewhere. Catch rates of C. hamatus and N. ionah were highest in the 200–400 m strata on the Ross Sea shelf (Table V), with generally lower catch rates in deeper waters of the shelf and the slope (Fig. 5). However, the highest catch of the former was from the upper slope off Cape Adare at 630 m. Although N. ionah was recorded from a demersal trawl at 1600 m depth it is possible that they were caught in midwater whilst the net was ascending or descending. Catch rates of C. myersi were highest in the 200–600 m depth strata (Table V) and they had a more southern distribution (Fig. 5). All three species were absent from catches on the seamounts. In contrast, C. dewitti was confined to the deeper waters of the slope and seamounts (Table V, Fig. 5).
Spatial distribution of catch rates (kg km-2) for NOK, Lepidonotothen squamifrons; GRV, Macrourus spp.; ANS, Pleuragramma antarctica; TRD, Trematomus lepidorhinus; TIC, Chionodraco hamatus; TEP, Trematomus eulepidotus; JIC, Neopagetopsis ionah; CMY, Chionodraco myersi; CHW, Chionobathyscus dewitti. Circle area proportional to catch rate with maximum catch rate shown for each species.
Stratum details, and mean catch rates (and standard deviations) in kg km-2 by stratum for the eight most abundant species and for all fish species combined.
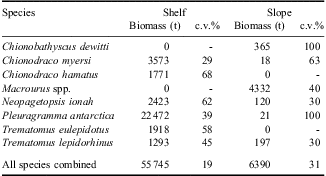
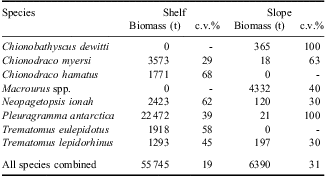
The total biomass in the shelf strata was 55 745 t (coefficient of variation 19%), whilst the total biomass on the slope strata was 6390 t (coefficient of variation 31%). The species with the highest biomass in the shelf strata was P. antarctica, which contributed to over 40% of the total biomass (Table VI). The icefish C. myersi and N. ionah were the two next most abundant species. In contrast, Macrourus spp. had the highest biomass in the slope strata, contributing to over 65% of the total biomass (Table VI). Most of the individual species’ coefficients of variation were greater than 30% indicating the estimates were very uncertain.
Relative biomass estimates and coefficients of variation (c.v.%) of the eight most abundant fish species, and for all fish species combined, caught from demersal trawl stations in the shelf and slope strata.
Discussion
New species and locality records
As noted by Eastman & Hubold (Reference Eastman and Hubold1999) our knowledge of the fish fauna of the Ross Sea and adjacent waters is still incomplete. In the current study we have extended that knowledge further by sampling depths and areas that have never previously been sampled. Demersal trawls were deployed to almost 2000 m on the Ross Sea slope and beam trawls to almost 3500 m on the abyssal plain. The Balleny Islands and Scott and Admiralty seamounts were sampled for the first time, and many new location records were obtained from the wide-ranging toothfish fishery.
During the sampling and subsequent analysis six undescribed species were found in four families: Etmopteridae, Rajidae, Macrouridae, and Zoarcidae, as well as 18 newly described species in the family Liparidae (Table III). Two undescribed species in the Families Serrivomeridae and Moridae were found from the rest of the Ross Sea region. In addition we recorded 19 new locality records for the Ross Sea and 23 new locality records for species in the rest of the region, as well as a number of new depth records, maximum lengths etc. Many of the new species and records (particularly of the zoarcids and liparids) came from the two deepest demersal trawls on the slope. Although this study has added to the knowledge of the fish fauna in these regions, there are still uncertainties surrounding the identity of some of the species in this study which could add further to the list. The groups that are not known or completely diagnosed include the Muraenolepididae (eel cods) and Zoarcidae (eelpouts).
The more common families of demersal and benthic species are discussed below.
Rajidae and Arhynchobatidae
Four skate species are known to exist in the Ross Sea region including Amblyraja georgiana, Bathyraja maccaini, B. n. sp. cf. eatonii, and B. n. sp. (dwarf) (Smith et al. Reference Smith, Steinke, McVeagh, Stewart, Struthers and Roberts2008, Reference Smith, Steinke, Dettai, McMillan, Welsford, Stewart and Ward2012), and all were caught during the two surveys. The record of Bathyraja meridionalis from the Ross Sea by Stehmann & Bürkel (Reference Stehmann and Bürkel1990) is not supported by voucher material despite extensive collecting by observers over the last decade and should probably be discounted. Amblyraja georgiana was only taken from the Balleny Islands at 520–1395 m depth during the surveys, but has been collected from the Ross Sea slope and from throughout the wider region in the fishery. All three species of Bathyraja were caught off Cape Adare in low numbers during both surveys in 230–1420 m depth and have also been taken on the shelf and slope in the fishery.
Muraenolepididae
Chiu & Markle (Reference Chiu and Markle1990) listed four species in the genus Muraenolepis for the Southern Ocean. Subsequently descriptions of five new species, and a reallocation of an earlier species into a new genus, were published by Russian researchers (e.g. Balushkin & Prirodina Reference Balushkin and Prirodina2010a, Reference Balushkin and Prirodina2010b). Eight specimens were collected on the BioRoss survey and 13 on the IPY survey across a range of depths (456–1200 m) and areas. A total of 160 specimens have been returned by observers caught from within the Ross Sea and a further 76 from the rest of the Ross Sea region. Re-examination of the IPY-CAML material resulted in identification of all of the specimens as M. evseenkoi. Following Balushkin & Prirodina (Reference Balushkin and Prirodina2010b), we have assumed that earlier records of M. microps from the Ross Sea were M. evseenkoi.
Macrouridae
Iwamoto (Reference Iwamoto1990) recorded 11 species in four genera from the Southern Ocean. The most abundant and commonly caught species in the Ross Sea region was previously thought to be Macrourus whitsoni (Hanchet et al. Reference Hanchet, Stevenson, Horn and Blackwell2003). However, as discussed earlier, after the IPY-CAML survey was completed genetic analysis showed that specimens originally identified as M. whitsoni comprised two species: M. whitsoni and a new sympatric species M. caml (McMillan et al. Reference McMillan, Iwamoto, Stewart and Smith2012). Both species were caught from the Ross Sea and northern seamounts in the survey in depths of 400–2000 m but the full extent of their distributions have yet to be established. Both M. holotrachys and M. carinatus have been taken in the fishery north of 65°S (McMillan et al. Reference McMillan, Iwamoto, Stewart and Smith2012).
The cosmopolitan Coryphaenoides armatus was collected at 66°39′S by observers, but was not taken on either BioRoss or IPY-CAML surveys. Coryphaenoides ferrieri and C. lecointei were taken during the IPY-CAML survey off the Scott Seamounts at over 3200 m depth, and a single specimen of the latter caught at c. 3500 m depth in the Brenke Sled. The more pelagic Cynomacrurus piriei was also taken from the Ross Sea and northern seamounts during both surveys.
Moridae
Morid cods are widespread in the deep ocean, but poorly represented from the Southern Ocean and had not been previously reported from the Ross Sea. Antimora rostrata was collected during both surveys from the northern seamounts in 700–1450 m depth. It has also been widely collected by observers from throughout the Ross Sea region including from the shelf and slope of the Ross Sea (off Franklin Island and from the Iselin Bank respectively). Halargyreus johnsonii was collected during both surveys from the Balleny Islands and north Scott Seamount in 850–1200 m depth. Observers have returned 17 specimens of Lepidion n. sp.cf. schmidti, 310–990 mm SL, taken in the fishery north of 64°06′S, which represents a new record for the Southern Ocean. A single specimen of L. sp.?ensiferus was also collected by observers on the Pacific-Antarctic Rise. The genus Lepidion is in need of a global revision.
Liparidae
At least thirteen species of liparid had previously been reported from the Ross Sea (e.g. Eastman & Hubold Reference Eastman and Hubold1999). Only one liparid was caught during the BioRoss survey but an additional 26 specimens were captured during the IPY-CAML survey predominantly deeper than 1200 m, whilst other specimens have been directly taken on hooks or recovered from stomachs of toothfish caught by the fishery on the Ross Sea slope. Stein (Reference Stein2012) revised the Liparidae of the Ross Sea and wider Ross Sea region, describing 18 new species and three new records, making a total of 35 species in all. The two deepest demersal trawls yielded the greatest number of new species in this family.
Zoarcidae
Four zoarcids were reported from the Ross Sea by Eastman & Hubold (Reference Eastman and Hubold1999), with an additional species reported by Struthers & Møller (Reference Struthers and Møller2009) and other species being described from north of the region (Møller & Stewart Reference Møller and Stewart2006). A total of 23 and 18 specimens were collected during the BioRoss and IPY-CAML surveys respectively. Three putative new species and one new genus were taken during the IPY-CAML survey and are currently under investigation by P. Møller (Zoological Museum, University of Copenhagen) and E. Anderson (South African Institute for Aquatic Biodiversity). In addition, range extensions were made for Melanostigma vitiazi, Seleniolycus laevifasciatus, and Lycenchelys antarctica. The highly speciose genus Pachycara is currently being revised by Møller, with a number of new species to be described.
Nototheniidae
A total of 18 species of notothenid had previously been reported for the Ross Sea (Eastman & Hubold Reference Eastman and Hubold1999) with an additional six species from other published sources. The two surveys caught 16 species in the Ross Sea and an additional species from the northern seamounts. The distribution and relative abundance of the four most common species L. squamifrons, P. antarctica, T. eulepidotus, and T. lepidorhinus were outlined above. Most of the remaining specimens were in the genus Trematomus, and included most of the species reported from the region by earlier papers. Trematomus bernacchii was only caught around Cape Adare and the Balleny Islands at shallow to intermediate depths (70–740 m). Trematomus hansoni was only taken once on each survey and T. tokarevi was only caught off Cape Adare. Trematomus newnesi was sampled in shallow water around Cape Adare and the Balleny Islands (75–325 m) but only taken twice on the Mawson Bank on the IPY-CAML survey. Trematomus pennellii was only taken once on the IPY-CAML survey on the Mawson Bank, but was well represented on BioRoss around Cape Adare and the Balleny Islands at shallow to intermediate depths (63–675 m). Trematomus scotti was well represented in both surveys and was a frequent prey item in the stomachs of toothfishes.
Lepidonotothen larseni was only found at the Balleny Islands in depths of < 600 m. Seven Aethotaxis mitopteryx were caught during both BioRoss and IPY-CAML across a wide range of depths and areas. Small numbers of D. mawsoni (75–180 cm total length) were collected from the Ross Sea shelf, slope and seamounts during both surveys, and one D. eleginoides was collected from the Balleny Islands. Dissostichus mawsoni has been widely taken in the fishery, extending from the continent north to 60°S (Hanchet et al. Reference Hanchet, Mormede and Dunn2010). Although D. eleginoides is most commonly caught north of 62°S, specimens have been caught on the slope of the Ross Sea at c. 72°S.
Artedidraconidae
The two surveys caught 11 of the 18 species of artedraconid listed for the Ross Sea by Eastman & Hubold (Reference Eastman and Hubold1999). Artedidraco loennbergi, A. orianae, A. shackletoni and A. skottsbergi were commonly taken at nearshore stations on BioRoss using the demersal trawl, beam trawl and the epibenthic sled at 85–506 m depth, often shallower than 300 m. Dolloidraco longedorsalis and Histiodraco velifer were only taken by IPY-CAML inside the Ross Sea, often concurrently, at depths of 447–926 and 447–530 m respectively.
The problems of identification of the most specious genus Pogonophryne have been well articulated (see Eakin et al. Reference Eakin, Eastman and Near2009). Distribution of the genus in the Ross Sea region appears to be restricted to the Ross Sea from inshore to 2000 m depth as no specimens were taken from the seamounts. The most abundant species taken on both surveys was P. scotti which was taken from throughout the Ross Sea at 191–752 m, most often deeper than 400 m. Three other species were infrequently taken in 365–752 m: P. barsukovi, P. marmorata, and P. mentella. Sampling the lower slope using the demersal trawl caught three specimens of the rare P. immaculata (see Eakin et al. Reference Eakin, Eastman and Near2009), and the paucity of sampling in this depth throughout the Southern Ocean is reflected by the low number of specimens in collections.
Bathydraconidae
The two surveys caught all ten species of bathdraconid which had previously been reported for the Ross Sea by Eastman & Hubold (Reference Eastman and Hubold1999). In addition, the IPY-CAML survey provided the first record for Bathydraco antarcticus from the lower slope of the Ross Sea (1620–1990 m) on the north-west Mawson Bank. Bathydraco marri was the most commonly caught representative, with 96 specimens, and comprised over 50% of the total number of bathydraconids (187) taken by the two surveys. Bathydraco marri was taken from throughout the western Ross Sea at intermediate depths (320–980 m). Within the Ross Sea, a number of specimens of species listed as rare in Eastman & Hubold (Reference Eastman and Hubold1999) were also collected. Bathydraco scotiae was collected in deep water (1954–2283 m) on the north-west edge of the Mawson Bank. Prionodraco evansii was commonly caught but restricted to 191–375 m in the western Ross Sea. Only one species of bathydraconid (Gymnodraco acuticeps) was taken outside of the Ross Sea with six specimens from the Balleny Islands at 125–295 m depth and one specimen from the Admiralty Seamount at 566–920 m.
Channichthyidae
The two surveys caught all eight species of channichthyids previously reported for the Ross Sea by Eastman & Hubold (Reference Eastman and Hubold1999) as well as C. atkinsoni and C. dewitti. The distribution and relative abundance of the commonest species C. dewitti, N. ionah, C. myersi, and C. hamatus were outlined previously. Most species were restricted to the shelf and slope of the Ross Sea but Pagetopsis maculatus, N. ionah, and C. dewitti were also recorded from the seamounts. Cryodraco antarcticus, C. atkinsoni, and Pagetopsis macropterus were all confined to shallow waters (50–675 m) of the shelf. The IPY-CAML survey caught both greater numbers of specimens and a wider range of species including Dacodraco hunteri, previously considered a rare species. Generally, channichthyids were caught at shallow to intermediate depths (50–864 m), the exception being C. dewitti which was taken in deeper water (to 1990 m) on the slope as well as on the Scott and Admiralty seamounts.
Faunal comparisons of species-richness and diversity
Based on presence/absence data from the two surveys considered here, Clark et al. (Reference Clark, Dunn, McMillan, Pinkerton, Stewart and Hanchet2010) identified three broad demersal fish assemblages in the southern Ross Sea (south of 74°S), central–northern Ross Sea (between latitudes 71° and 74°S), and the seamounts further north (65°–68°S). In the present study we found marked differences in patterns of diversity in demersal fish along the same latitudinal gradient. The highest species-richness and evenness indices were recorded from the shelf and the lowest recorded from the seamounts. The reduced evenness and diversity indices on the slope and north can be attributed to the local abundance of L. squamifrons and Macrourus spp., with several relatively large catches each exceeding 100 kg.The values for the various diversity indices calculated for the current study generally encompass the range for those calculated for the western Ross Sea by Eastman & Hubold (Reference Eastman and Hubold1999) and for the eastern Ross Sea by Donnelly et al. (Reference Donnelly, Torres, Sutton and Simoniello2004). The mean values for the Shannon-Weaver index of 1.88 and 1.79 reported by Eastman & Hubold (Reference Eastman and Hubold1999) for the Ross and Weddell Seas respectively were substantially higher than our comparable value of 1.47 for the Ross Sea shelf. In contrast, the Margalef values in the current study (0.83–4.20) were generally higher than those reported by Causse et al. (Reference Causse, Ozouf-Costaz, Koubbi, Lamy, Eléaume, Dettai, Duhamel, Busson, Pruvost, Beaman and Riddle2011) (0.00–2.16) for the Dumont d'Urville Sea covering a similar depth range to the current study.
A total of 53 demersal species was found during the two surveys from the Ross Sea shelf, a slight increase on the 47 species found by Eastman & Hubold (Reference Eastman and Hubold1999). An additional nine species were recorded from the Ross Sea slope, and the extrapolated species-richness for the Ross Sea (shelf and slope) as a whole was 77 species. However, when the data from sources were combined, including the large number of previously undescribed species of liparid, the total number of species equalled 117. This is considerably larger than the Weddell Sea demersal fish fauna which includes 83 species in 14 families (in Eastman & Hubold (Reference Eastman and Hubold1999)). The large increase in the number of fish recorded in the Ross Sea reflects the greater depths and wider range of sampling gear used in the current study as well as the discovery of cryptic species in several families in the intervening period including Liparidae, Zoarcidae, Muraenolepidae etc.
The pelagic species showed quite different patterns of diversity to the demersal species. The highest richness and evenness indices were recorded from the seamounts and abyssal stations and the lowest recorded from the shelf. The reduced evenness and diversity indices on the shelf can be attributed to the local abundance of P. antarctica, which were caught in large numbers at almost all the shelf stations. The marked change in species assemblage from a myctophid dominated assemblage over the continental slope and the open ocean to a P. antarctica dominated assemblage on the shelf has been recorded in all previous studies around Antarctica (De Witt Reference DeWitt1970, Hubold & Ekau Reference Hubold and Ekau1987, Donnelly et al. Reference Donnelly, Torres, Sutton and Simoniello2004). However, the number of pelagic species in each assemblage has varied considerably between studies. The 24 pelagic species reported in the present study was the same as that reported by Hubold & Ekau (Reference Hubold and Ekau1987) from the Weddell Sea, but much higher than the nine species reported by Donnelly et al. (Reference Donnelly, Torres, Sutton and Simoniello2004) in the eastern Ross Sea. The extrapolated asymptotic richness estimated to be 35 species suggests other species would be found with additional sampling. Apart from counts of species-richness we could find no published studies which have investigated other measures of pelagic fish diversity around Antarctica.
Based on the material collected in this study, combined with previous published material, the total fish species count for the Ross Sea region is now 175 of which 135 species were recorded from the Ross Sea shelf and slope.
Catch rates and biomass
Mean catch rates of all species for the Ross Sea shelf and slope strata were < 1000 kg km-2 indicating relatively low densities throughout the area. However, these low catch rates are consistent with catch rates from previous studies around the Antarctic continent. Eastman & Hubold (Reference Eastman and Hubold1999) reported catch rates of 90 and 438 kg km-2 for two stations on the Ross shelf, whilst Donnelly et al. (Reference Donnelly, Torres, Sutton and Simoniello2004) reported catch rates of 700–3500 kg km-2 from the eastern Ross Sea, and Ekau (Reference Ekau1990) reported catch rates of 100–3400 kg km-2 for the Weddell Sea. Catch rates in the current study were highest in 200–400 m, whereas in the eastern Ross Sea and Weddell Sea they were highest on the shelf edge in 450–700 m.
A major objective of the IPY-CAML survey was to estimate the biomass of demersal fish species taken as bycatch of the toothfish fishery. Although the survey area was severely restricted due to the ice conditions, we were able to obtain biomass estimates of demersal fish for parts of the shelf and slope for the first time. We note that these biomass estimates and coefficients of variation should be treated with caution because they assume that all fish in the path of the wings of the trawl are caught and make no allowance for the herding effect of the otter boards or for the escapement of fish through the meshes of the net, under the ground gear or above the head line. The latter is particular relevant to the Ross Sea where many species have a bentho-pelagic or pelagic lifestyle (Vacchi et al. Reference Vacchi, La Mesa and Greco2000).
Conversely, despite it generally being considered as a pelagic species, P. antarctica was the most abundant species (by number and by weight) in the demersal trawl catches on the shelf and formed 40% of the biomass in the shelf strata. The biomass estimate from the trawl survey was about 10% of that from the acoustic survey of the area by O'Driscoll et al. (Reference O'Driscoll, Macaulay, Gauthier, Pinkerton and Hanchet2011). Indeed, there is growing evidence that P. antarctica should be classed as a bentho-pelagic species (Causse et al. Reference Causse, Ozouf-Costaz, Koubbi, Lamy, Eléaume, Dettai, Duhamel, Busson, Pruvost, Beaman and Riddle2011). O'Driscoll et al. (Reference O'Driscoll, Macaulay, Gauthier, Pinkerton and Hanchet2011) noted that P. antarctica often occurred in acoustic layers close to the bottom, whilst Causse et al. (Reference Causse, Ozouf-Costaz, Koubbi, Lamy, Eléaume, Dettai, Duhamel, Busson, Pruvost, Beaman and Riddle2011) noted that it was present close to the bottom in photographs and videos. During the present expedition it was also recorded on 15 separate occasions on videos within 2–3 m of the seabed.
The three icefish species C. hamatus, C. myersi, and N. ionah together contributed to about 15% of the biomass in the shelf strata. All three species were caught in the midwater trawl, and in the case of N. ionah sometimes in the upper surface water, and so the survey undoubtedly also underestimated the abundance of these species. The two most commonly occurring nototheniids made up 6% of the biomass.
The estimates of biomass in the slope strata may be more reliable. The biomass was dominated by Macrourus spp., which contributed to 65% of the total biomass on the slope. Macrourus spp. are also the main bycatch in the toothfish fishery on the slope contributing to 5–10% of the total fish catch, whilst species such as C. dewitti, A. rostrata, and Muraenolepis spp. contribute to < 1% (Hanchet et al. Reference Hanchet, Stevenson, Horn and Blackwell2003). The preliminary estimates of Macrourus spp. biomass from the survey have also been used to provide advice on setting precautionary catch limits for Macrourus spp. in the fishery (SC-CAMLR 2011).
Collections from the two surveys and the additional samples collected from the toothfish fishery have contributed to a substantial increase in the number of species recorded for the Ross Sea and wider Ross Sea region. However, the distribution of smaller fishes in areas of the slope in the eastern Ross Sea is still poorly known. The lower slope region in the Ross Sea was of greatest interest in terms of new taxonomic discoveries but the encroaching ice and lowering temperatures meant that the planned sampling had to be cut short. The collections that were made contained the greatest number of new records and new species, indicating that the lower slope contains many more species of fishes and invertebrates yet to be discovered. The costs and logistics of working in the Ross Sea mean that a collaborative international survey would be the best chance of finishing this work.
Acknowledgements
A large number of people were involved in the planning, preparation, mobilization, and conduct of the two surveys considered here. They are too numerous to name, but in particular the officers and crew of RV Tangaroa, and the scientific staff during the surveys, are acknowledged. We also thank the scientific observers and fishing companies for returning specimens from the toothfish fishery. We are grateful to Joe Eastman, Tom Near, David Stein, and Peter Møller for verifying at-sea fish identifications and also to Peter Smith for crosschecking identifications using DNA barcoding. This research was funded by the New Zealand Government under the New Zealand International Polar Year-Census of Antarctic Marine Life Project (Phase 1: So001IPY, Phase 2: IPY2007-01). We gratefully acknowledge project governance by the Ministry of Fisheries Science Team and the Ocean Survey 20/20 CAML Advisory Group (Land Information New Zealand, Ministry of Fisheries, Antarctica New Zealand, Ministry of Foreign Affairs and Trade, and National Institute of Water and Atmospheric Research Ltd). We are also grateful to the reviewers for their constructive comments.
Supplemental material
Two supplemental tables will be found at http://dx.doi.org/10.1017/S0954102012001265.