During the last two decades economic historians have paid a good deal of attention to the estimation of the per capita real product of different countries and the analysis of what happened to the gap between the leaders and followers since the Industrial Revolution. With the exception perhaps of a small number of countries, however, estimates for per capita GDP for the period before 1870 are difficult to construct and not sufficiently reliable. Moreover, it has not been possible to construct detailed estimates for most of the developing countries for the period before 1913 or even 1950.
This article focuses on a region, the study of whose modern economic growth performance has been conspicuously lagging behind. I bring together and analyze data from a variety of sources to provide, for the first time, an overview of the growth record of the Middle East since 1820 and then insert these estimates into a comparative framework. I offer GDP per capita estimates for individual countries in the region for the benchmark years of 1913, 1870, and 1820.
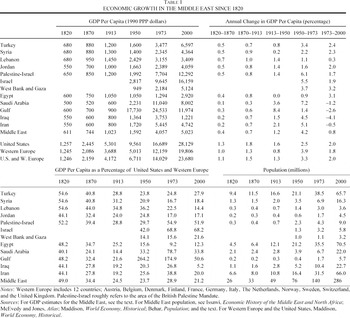
The estimates indicate that although there were significant differences in the subperiods, the cumulative growth experience of the Middle East during the last two centuries was not very different from that of other regions of the periphery. The Middle East began to participate in modern economic growth during the nineteenth century. Yet, differences in per capita incomes between it and the high income regions of the world (United States and western Europe) widened considerably until World War I. In the twentieth century, the most important single factor contributing to increases in per capita incomes in the region was oil. Despite the sharp rise in oil production and revenues, however, the gap between the Middle East and the high income regions of the world is roughly the same today as it was in 1913 (Figures 1 and 2). In fact, the contribution of oil to economic growth in the region is rather ambiguous. In the half century since 1950, non-oil countries of the region actually experienced greater increases in per capita incomes than the oil exporters, as I will show.

FIGURE 1 ANNUAL RATES OF GROWTH OF PER CAPITA GDP, 1820–2000

FIGURE 2 GDP PER CAPITA AS A PERCENTAGE OF UNITED STATES AND WESTERN EUROPE, 1820–2000
METHODOLOGY AND DATA
In principle, a country's per capita is estimated by adopting a Kuznetsian approach and constructing sector by sector accounts from the available data. GDP per capita thus obtained in individual currencies are then converted into a common denominator. The construction of Kuznetsian national income accounts is not always possible for the earlier periods, however, due to the limitations of data. Moreover, as the International Comparison Project has shown, there are serious problems in converting per capita GDPs by utilizing the current exchange rates. For this reason I will begin with per capita GDPs calculated in purchasing power parity terms for the most recent benchmark year. I will then move backwards on the basis of the annual changes in the per capita real product of individual countries.2
Summers and Heston, “Penn World Table”; and Heston, Summers, and Aten, “Penn World Tables.”
Maddison, World Economy: Historical.
No country in the Middle East (Turkey, Syria, Lebanon, Jordan, Palestine-Israel, Egypt, Saudi Arabia, Gulf states, Iraq, and Iran) had an official income accounting system in place before World War I. Agricultural production series began for Egypt in the 1880s and for the Ottoman Empire in 1897. Output series for other sectors are not available until after World War I. For the earlier period, only tax assessment and collection series and foreign trade statistics are available. National income accounting systems were established either during the Interwar period or mostly after 1950. For some countries such as Turkey, Egypt, and Palestine-Israel, researchers have pieced together evidence from a variety of sources to construct national income accounts for the years before World War I or some years of the interwar period. In some other cases, there are estimates of the rate of change in per capita national income for different time intervals. Some attempts have also been made to compare the per capita income of two or more of the countries in these regions at different points in time. Because most of this region was part of the Ottoman Empire until 1918, fiscal, production, and trade data from Ottoman sources including per capita GDP estimates for the years immediately before World War I can be employed for making cross sectional and intertemporal comparisons.
DERIVING THE ESTIMATES
I begin with the Maddison per capita GDP estimates for the individual countries of the Middle East for the benchmark year 1950 except those for Egypt and Syria. These estimates have been obtained by working backwards from the most recent estimates of per capita GDP.4
The Maddison GDP per capita series for Syria for 1950–2000 provides rates of growth which are consistent with the ICP series but their level is unacceptably high throughout the period (Maddison, World Economy: Historical). I have adjusted them downwards by 45 percent to bring them in line with the ICP series, World Bank estimates and other evidence considered in this study. For the ICP series for Syria see, Heston et al., “Penn World Tables”; and for evidence on the Syrian economy during the interwar years, see Himadeh, Economic Organization. Similarly, for Egypt, the Maddison rates of growth for 1950–2000 are consistent with the ICP series but the GDP per capita levels were rather low. As explained in footnote 9, the estimate for 1950 was adjusted upwards by 15 percent.
In the first stage of the reconstruction procedure, I work backwards to 1913 using the available evidence on rates of change in per capita GDP as well as other estimates on per capita GDP levels for those countries of the region for which estimates or income series are available, most importantly Turkey and Egypt. The first stage enables me to carry the GDP per capita estimates expressed in 1990 international dollars back to 1913 at least for parts of the region.
For Turkey, national income accounts now go back to 1923. We have linked these series to the Ottoman period making use of a detailed study on this issue with comparisons of agricultural output, manufacturing, and foreign trade on a per capita basis for those areas of the Ottoman Empire that were included in Turkey after 1923. That study reached the conclusion that per capita GDP in Turkey declined by as much as 50 percent or more during World War I and returned to its 1913 levels only in 1929.5
Ozel, “Economy”; Ozel and Pamuk, “Osmanlidan Cumhuriyete”; for the GDP series for Turkey for 1923–1948, Bulutay, Tezel and Yildirim, Turkiye Milli Geliri.
In the absence of national income accounts for Egypt, the most important piece of evidence we have regarding changes in per capita production and income levels in the period before 1950 are the two related studies by Bent Hansen and Michael Wattleworth on per capita agricultural output and consumption of foodstuffs based on production and trade statistics. Most importantly for our present purposes, these studies indicate that per capita income levels in 1950 were about the same as those in 1913. A more recent study by Tarik Yousef that makes use of changes in monetary variables to derive estimates of per capita income reaches the same conclusion that per capita income in Egypt was at the same level in 1950 as it was in 1913.6
Hansen and Wattleworth, “Agricultural Output”; Hansen, “Income”; and Yousef, “Egypt's Growth.”
Metzer, Divided Economy. The Metzer series are for 1922–1947, for Arabs and Jews separately. After correpondence with the author, I have assumed that there was a slight decline in GDP per capita from 1913 to 1922 and a larger decline from 1947 to 1950.
In the second stage, I make use of detailed data to develop per capita GDP estimates for different parts of the region in 1913. Vedat Eldem had constructed per capita GDP estimates for the Ottoman Empire for the years before World War I utilizing fiscal data and a series of censuses on population, agriculture, and industry as well as statistics on foreign trade. These estimates, given in current Ottoman gold liras, included a regional breakdown for the European and Asian provinces of the empire.8
Eldem, Osmanli, pp. 277–309.
There were considerable regional differences in per capita income levels within the Ottoman Empire and, in all likelihood, these differences were growing in the decades before World War I. In terms of the later nation-state boundaries, the area of the Ottoman Empire with highest per capita incomes on the eve of World War I was Lebanon followed by Syria and Palestine. While the Istanbul region and European areas of the Ottoman Empire had per capita incomes higher than those of Syria and Lebanon, the area comprising modern Turkey had per capita income levels 10 to 15 percent below those of Lebanon and Syria. Per capita GDP estimates for the Balkan countries, Greece, Romania and Bulgaria in 1913 presented in Table 1 with levels higher than those for Turkey and Syria but close to those for Lebanon are thus consistent with the regional distribution of per capita income inside the Ottoman Empire as reflected in the Ottoman fiscal and production data. At the other end of the spectrum in terms of per capita income in 1913, were regions of the Middle East located around the Gulf. Iraq, Iran, the Arabian peninsula, and the Gulf economies lagged considerably behind regions around the eastern Mediterranean. Both Ottoman data and existing estimates leave no doubt about this divide on the eve of World War I.

One important question in this reconstruction procedure is to determine how per capita income levels in Egypt, one of the largest countries in the region during the twentieth century, compared with those of the other countries or areas in 1913. Available evidence leads me to conclude that on the eve of World War I per capita income levels in Egypt were distinctly lower than those of Syria and Lebanon and also below those of Turkey but above those of Iraq, Iran, and Arabia. We know that on the eve of World War I, many of the wealthiest individuals in the Middle East including many Europeans lived in Egypt. At the same time, however, there is strong evidence that incomes in Egypt were more unequally distributed than in other parts of the Middle East due primarily to the unequal distribution of landownership.9
In earlier volumes Maddison had projected much lower per capita income levels for Egypt for the year 1950, and by implication for 1913. He has since raised the 1913 per capita GDP estimates for 1950 from 500 constant 1990 purchasing power parity dollars in the 1995 edition to 700 dollars in the 2001 volume and most recently to 900 dollars. Compare Maddison, Monitoring, p. 206, World Economy, A Millennial, p. 323, and World Economy: Historical, p. 219. The earlier estimates would have made Egypt the poorest country in the region in 1913, which is not tenable. Maddison's recent revisions point towards more realistic estimates and they fit much better the comparative picture I have outlined for the region on the eve of World War I. In view of the per capita GDP estimates by Hansen, Yousef, and others given in constant 1913 Egyptian pounds for the years 1913 and 1950, I find it more realistic to raise the estimates for per capita GDP for Egypt in 1950 and in 1913 even further to 1,050 dollars. This evidence is summarized in Table 2. Also see United Nations, Economic Developments.
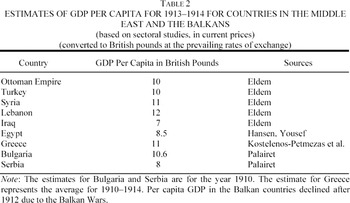
Table 2 presents the existing estimates of per capita GDP for different countries of the Middle East in 1913 based on sectoral studies including those by Eldem. These estimates were all originally expressed in the current monetary unit of the country they belonged to, and I have converted them to British pounds sterling at the prevailing rates of exchange. Because the countries represented in Table 2 had per capita GDP levels close to each other, we should expect their aggregate price levels to be close as well. As a result, we should expect the purchasing power parity adjusted per capita GDP levels of these countries to be ranked in the same order as their per capita GDP expressed in current domestic prices. The ordering of the countries in the region in terms of per capita GDP given in Table 2 and those given in Table 1 are very similar, if not identical. This comparison should increase our confidence in the purchasing power parity adjusted estimates provided in Table 1 for the year 1913.

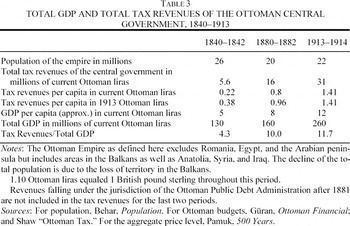
In the third and last stage, I utilize the Ottoman evidence from fiscal sources and all other evidence on tax revenues, output, and trade to derive long-term rates of change in per capita GDP for the periods 1870–1913 and 1820–1870. However, whereas Eldem and later Osman Okyar accepted increases in per capita tax collections of the central government as a proxy for increases in per capita income, I am reluctant to do so.10
Eldem, Osmanli, p. 308; and Okyar, “New Look.”
Guran, Agricultural Statistics and First Statistical Yearbook.
For example, Akarli, “Agriculture.”

A variety of evidence including production, foreign trade, and urban wages point to slightly higher rates of growth for Syria, Lebanon, and Palestine from 1880 until World War I. These rates were comparable to those experienced by Greece for this period, the only Balkan country for which sector-based GDP series are available for the period before 1913. In comparison, rates of growth were distinctly lower in Iraq, the Arabian peninsula and Iran (Table 1).13
The most recent study on per capita GDP for Greece since 1830 reaches the conclusion that there were significant increases in per capita growth in Greece during the nineteenth century but that the gap between Greece and the high income countries continued to widen. This study estimates that per capita GDP in Greece increased at close to 0.5 percent per annum before 1870, and at rates below 1.0 percent per annum during 1870–1913. Kostelenos et al., Gross Domestic Product. In a recent study Lains, “Southern European,” reaches a similar conclusion for the Balkans during 1870–1913. In contrast, Palairet, Balkan Economies has argued that the period of early independence in the Balkans was characterized not by sustained increases in per capita income but by economic stagnation due to urban decline and increasing self sufficiency of agriculture in the aftermath of land reforms.
For Egypt, supported by inflows of capital and rapid expansion of cotton cultivation and exports, the decades before World War I were also a period of economic growth. The recent study by Yousef reaches the conclusion that per capita GDP increased by a total of more than 80 percent between 1886/87 and 1913, implying an average annual rate of about 2 percent. This is a rather high estimate not supported by the Hansen and Wattleworth per capita output, consumption, and income indices. The latter point to a total increase of 40 percent in per capita food consumption and income for the same period. Moreover, higher rates of growth for the decades before World War I imply unusually low per capita GDP levels for the 1880s and earlier. I prefer to follow the Hansen and Wattleworth estimates for income growth in Egypt during the decades before World War I.14
Hansen and Wattleworth, “Agricultural Output”; Hansen, “Income”; and Yousef, “Egypt's Growth.”
The 1870s was an unusually difficult decade, with political, fiscal, and economic crises for most of the Middle East and the Balkans. There was a severe famine in central Anatolia during 1873/74. The Ottoman Empire entered a war with Russia during 1877/78, which involved the Balkans. After the spread of the financial crisis of 1873 in the European financial markets, the Ottoman and Egyptian governments were forced to declare a moratorium on their outstanding debt during 1875/76. Incomes were rising in the early part of the decade and there was recovery at the end. For the decade as a whole, I estimate that per capita GDP declined by 4 percent for Turkey and Egypt. In other parts of the region, the impact of these events was more limited and I estimate that income levels had recovered by the end of the decade to their levels at the beginning.
As the last step of the reconstruction attempt, I extrapolate the benchmark year estimates for 1870 towards 1820 employing different rates of growth of per capita GDP for different parts of the region with the help of the insights offered by the available fiscal data, foreign trade data, and studies by various scholars, most notably those by Issawi.15
Issawi, Economic History of the Middle East and North Africa, pp. 103–07, and “Egypt.”
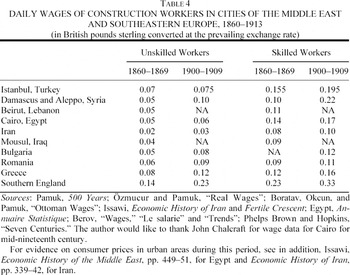
An alternative approach for studying levels of per capita income or the standards of living where reliable estimates of per capita GDP are lacking has been to compare real wages of specific occupations, most often of skilled and unskilled construction workers in urban areas. Real wage data are of far better quality than per capita GDP estimates, especially for the period before World War I for all of the developing countries. At the same time, however, real wage series are open to valid objections. In most of the Middle East urban wages was a small category during the nineteenth century. The linkage between urban wages and agricultural productivity was not always strong. Even if we accept wages as an adequate proxy for the annual per capita earnings of labor, this does not mean that it should be a good proxy for income per capita.
With these qualifications, I present in Table 4 evidence compiled from many sources on nominal daily wage rates for urban construction workers in the Middle East and the Balkan countries during the half century before World War I. Although price levels may vary to some extent between countries, it is clear there is a close correlation between my per capita estimates for 1913 and the nominal wage rates in different parts of the region on the eve of World War I. There is a close correlation between nominal daily wages and the available per capita income estimates for the three Balkan countries as well. When the evidence for nominal wage rates is examined together with evidence on prices, one can conclude that urban wages rose faster than prices around the Middle East during the half century before World War I. On the whole, the urban wage evidence supports the per capita GDP pattern within the Middle East region as outlined in Table 1 for 1913. This evidence for total increases in the nominal and real wages for the half century until World War I is also consistent with rates of increase in per capita incomes for different parts of the region as presented in Table 1. I believe that changes in the wages of unskilled workers should be considered a better measure of changes in per capita GDP because the numbers of urban skilled construction workers was a very small category during this period.

CHECKING THE ESTIMATES
A number of economic historians have used input and output prices to measure long-term changes in productivity. It has been shown that this dual approach to growth accounting is equivalent to the one using quantities. Peter Temin employed this approach and used trade data to assess the rate and breadth of productivity increases during the British industrial revolution. More recently, Pol Antras and Hans-Joachim Voth have used changes in factor prices to develop an alternative measure of British total factor productivity growth for the same period.16
Temin, “Two Views”; and Antras and Voth, “Factor Prices.”
Pamuk, Ottoman Empire, pp. 172–75.
Another method for assessing my results would be to conduct simple sensitivity tests for the growth rate estimates. Because it is possible to go back to GDP per capita levels for 1913 mostly on the basis of existing series and because my estimates for GDP per capita for different countries of the region are consistent with a large body of other evidence, I will focus here on the period before 1913. I will consider growth rates below and above the rates I have estimated for the region for the period 1820–1913. I will then calculate what these alternative growth rates imply for levels of GDP per capita in 1820. This exercise should help assess the fragility of my estimates and establish a range within which growth rates need to fall.
I have estimated the long-term rate of increase of per capita GDP for 1820–1913 for the region as a whole at 0.56 percent per annum (Table 1). If we adopt a significantly higher rate of increase, such as 1 percent per year for this period, we arrive at a GDP per capita level of 405 dollars for 1820. This level is simply too low because 400 dollars (1990 and PPP adjusted) represents the subsistence minimum in the Maddison framework. Conversely, if we adopt an average rate of increase of 0 percent for 1820–1913, we arrive at a GDP per capita level of 1,023 dollars for the region in 1820. This level appears too high, as it is equal or above the existing estimates for GDP per capita levels for Southern Europe as a whole and well above those for Eastern Europe at this date.18
Estimates for other regions are based on Maddison, World Economy: Historical.
This simple exercise has established that the rate of growth of per capita GDP for the Middle East was between 0 and 1 percent per annum during century before World War I. It can easily be extended to the individual countries to show that the growth rate of most if not all countries of the region for this period need to fall in the same range especially because intercountry differences within the region were limited until 1913.
INTERPRETING THE RESULTS
The estimates indicate that the Middle East began to participate in the global process of modern economic growth during the nineteenth century. Long-term rates of per capita income growth for the region as a whole increased as the century progressed but remained below 1 percent per annum. During the nineteenth century there also emerged inside the Middle East an important divergence between those parts of the region that were linked to world trade through ports around the eastern Mediterranean and those linked to trade through the Gulf and Red Sea. Those parts of the Middle East that were connected to world trade through the eastern Mediterranean enjoyed faster growth in trade and attracted more foreign direct investment. In the Ottoman Empire and to some extent in Egypt there were significant institutional changes during this period, in law and property rights as well as trade policy. These institutional changes called the Tanzimat reforms in the Ottoman Empire combined with the expansion of trade and direct foreign investment to lead to considerable differences in per capita income levels between the two parts of the region by 1913.
This pattern of rising long-term rates of growth of per capita GDP for the nineteenth century is consistent with the experience of many other regions of the world, most notably Europe, North and South America, and to a lesser extent Africa. Per capita GDP was also rising in South and East Asia during the period 1870–1913.19
Maddison, World Economy: Historical.
In Figures 1 and 2 I use the estimates provided in Maddison, World Economy, A Millennial and World Economy: Historical for per capita GDP levels of other regions. The Maddison estimates may tend to understate the levels of per capita income for the regions of the periphery in 1820.
The Middle East experienced major political changes after 1914. The end of the Ottoman Empire, incorporation of large parts of the region into the British and French colonial empires, and the subsequent creation of new nation-states led to the erection of tariff barriers and a variety of other obstacles to the largely free movement of goods and labor within the region. In addition, the two world wars, especially the first, and the world depression caused serious dislocations.21
Owen and Pamuk, History, pp. 3–90.
On the other hand, parts of the region benefited from a new development during this period. Production of oil in the region began, with the exception of very small amounts in Iran, after 1914. By 1950 Iran, Saudi Arabia, Iraq, the Gulf countries, and Iraq, in that order, were producing and exporting significant quantities of oil. Even though the multinational oil companies kept a large share of the profits during this early period, per capita GDP almost doubled in Iraq, more than doubled in Iran, and increased almost threefold in Saudi Arabia during 1913–1950. The largest increases in per capita GDP occurred, however, in Kuwait and the other Gulf states where large amounts of oil revenue accrued to a very small population (Table 1).
Some of the non-oil countries of the region also enjoyed significant increases in per capita GDP during this period. The fastest increases were experienced in Mandate Palestine largely due to the arrival of Jewish immigrants and significant inflows of capital. Turkey was the only country in the region to experience a significant degree of industrialization during the interwar period. The shift to protectionism and the adoption of a strategy of state-led industrialization after 1929 provided a model that would be influential elsewhere in the region after World War II. In Egypt, on the other hand, the exhaustion of new land and the decline in yields combined with the great depression to end the long boom based on cotton. It is estimated that per capita GDP in Egypt did not change between 1913 and 1950.
The pace of economic growth picked up during the second half of the twentieth century. GDP per capita for the region as a whole increased at an annual rate of 2.3 percent per annum or by more than twofold from around 1,600 dollars in 1950 to more than 5,000 dollars in 2000, both in 1990 PPP adjusted dollars. These aggregate figures actually hide a good deal of intertemporal and intraregional differentiation. The Middle East economies did much better until 1973 or 1980. Per capita GDP for the region as a whole increased at above 4 percent per annum in this earlier period. The rate of increase of per capita GDP for the region as a whole was less than 1 percent per annum after 1973 or 1980.
Dividing the countries of the region into two groups, oil exporters and non-oil exporters provides additional insights into the differing performances of the Middle East economies during the second half of the twentieth century. For the oil-exporting countries of the region (Saudi Arabia, the Gulf states, Iraq, and Iran), the contrasts between the period before and after 1973 or 1980 is dramatic. GDP per capita in these countries increased at an annual rate of 5.3 percent during 1950–1973. As a result, differences within the region between higher income oil exporters and the lower income non-exporters widened until 1973 or 1980. In sharp contrast, due to the decline in the relative price of oil as well as the wars that some of these countries were engaged in, GDP per capita for the oil exporters as a whole actually fell by one-fourth between 1973 or 1980 and 2000. We may thus conclude that the important contribution of oil to increases in per capita incomes in the region occurred early, in the interwar period and until the 1970s.
The growth performance of the non-oil countries of the region (Turkey, Syria, Lebanon, Jordan, Palestine-Israel, and Egypt) was more stable. GDP per capita increased at 2.9 percent per annum during 1950–1973 and at 2.4 percent per annum during 1973–2000 for these countries as a whole. Import-substituting industrialization became the leading strategy of economic development during the 1960s especially amongst the larger non-oil countries of the region such as Turkey, Egypt, and Syria. The decline in the rate of growth after 1973 and especially after 1980 was due both to the slowdown of the world economy and the decline in the per capita incomes of the oil exporters of the region because there existed strong economic linkages between these two groups of countries in the form of trade, capital flows, and more importantly, labor and remittance flows. It is also striking that non-oil countries actually experienced higher average rates of growth during the half century after 1950 (2.6 percent per annum) then the oil exporters of the region (1.9 percent per annum). This pattern also holds if the economies of North Africa (Libya, Algeria, Tunis, and Morocco) are included in the comparison.22
Based on the GDP per capita series in Maddison, World Economy: Historical.
Despite large oil revenues, increases in per capita GDP for the Middle East as a whole since 1913 have been roughly comparable to increases in the two other regions of the periphery, Latin America and South and East Asia. As emphasized earlier, the Middle East did better than these regions until the 1970s but has lagged behind since. The gap in per capita incomes between the Middle East as a whole and high income economies of the United States and Western Europe was roughly the same in 2000 as it was in 1913. In other words, after experiencing significant divergence in the nineteenth century, the Middle East did not exhibit any tendency for convergence in the twentieth century. (Figures 1 and 2)
Growth accounting studies, which are available only for recent decades, indicate that increases in per capita GDP in the region have been mostly due to the accumulation of physical capital. By contrast, increases in human capital formation and total factor productivity have been rather slow. These results underline that the region has been better at mobilizing resources and acquiring new technology than utilizing the existing resources efficiently.23
Yousef, “Development,” pp. 96–97.
An earlier and longer version of this article was presented at the 12th Annual Meeting of the Economic Research Forum at Cairo in December 2005. The author would like to thank the Forum for support, Subidey Togan and other participants for helpful comments. The author also acknowledges the comments and suggestions by Alexander Apostolides, Roger Owen, Peter Temin, the editor of this journal, and anonymous referees. This study was also supported by the Academy of Sciences of Turkey and Boğaziçi University Research Projects Fund through project number 101Z05.