Introduction
The global demand for data storage is growing ever faster in the present “information age.” Silicon-based flash memories, which have dominated the nonvolatile storage market so far, seem to have reached their performance and scalability limits, and massive efforts are underway to develop new memory materials. Among these, phase-change random-access memory (PRAM) based on phase-change materials (PCMs) shows great promise:Reference Wuttig and Yamada1–Reference Elliott4 If superior PCMs materials could be identified, a universal deviceReference Lankhorst, Ketelaars and Wolters5 could be realized that could potentially replace magnetic hard drives, flash memories, and dynamic random-access memory.
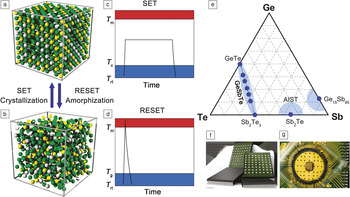
The storage concept of PCMs is sketched in Figure 1. At room temperature, these materials have at least two metastable phases, amorphous and crystalline, with pronounced contrast in optical reflectivity and electrical resistance; this represents the two logic states “0” (amorphous) and “1” (crystalline). Upon application of a long, medium-intensity voltage or laser pulse, the amorphous region is locally annealed and crystallized (“SET”). Using a short, high-intensity voltage or laser pulse, the focused region is instead heated above its melting temperature; subsequent rapid cooling yields a disordered amorphous mark (“RESET”). To read out information, a small current pulse or laser beam is used that does not alter the state of the bit.Reference Wuttig and Yamada1,Reference Raoux, Xiong, Wuttig and Pop3
(a–d) Working principle of phase-change material- (PCM-) based devices. The heating process is induced either by a laser or by a voltage pulse. Cubic rock salt and amorphous Ge2Sb2Te5 are used as the typical examples of the crystalline and amorphous state in (a) and (b). Ge, Sb, and Te atoms are rendered with gray, yellow, and green spheres. T m, T c, T g, and T rt in (c) and (d) indicate the melting temperature, crystallization temperature, glass-transition temperature, and room temperature. (e) The germanium–antimony–tellurium ternary phase diagram, in which many PCMs are located (blue). (f) A commercial PCM chip developed for cell phones by Micron in 2012. © 2012 Micron Technology, Inc. (g) A newly designed PCM-based memory card presented by IBM in 2014, which has been demonstrated to operate much faster than the current flash-based solid-state hard drives. © 2014 IBM.

The most successful candidates for phase-change technology have been identified in the ternary germanium–antimony–tellurium systemReference Wuttig and Yamada1,Reference Raoux, Xiong, Wuttig and Pop3 (Figure 1e). There are three main families: tellurides along the quasibinary GeTe–Sb2Te3 tie line (denoted as GST in the following); alloyed or, in the community’s jargon, “doped” Sb2Te (prominently, silver–indium–antimony–tellurium [Ag–In–Sb–Te; AIST] alloys); and derivatives of elemental antimony such as Ge15Sb85. Some emerging electronic data-storage and memory products that employ PCMs are shown in Figure 1f (a commercial PCM chip developed for cell phones) and Figure 1g (a PCM-based memory card).
Computer simulation plays a key role in modern materials science. Simulations have been supplementing experiments for many years and are now revealing truly predictive power. Density-functional-based electronic-structure theoryReference Martin6 (DFT) and molecular dynamicsReference Marx and Hutter7 (DFMD) simulations can predict characteristics of “real” materials with quantum-mechanical accuracy. Thanks to the exponential growth of supercomputing power, state-of-the-art simulations can now access the time and length scales of the physical processes in phase-change memory cells.
In this overview article, we summarize DFT-guided advances in the materials science of PCMs and in PRAM technology. The article is structured as a list of questions that, in our opinion, address several crucial issues regarding PCMs. Some of the questions have been resolved, and some are still being pursued. Answering them will also inspire important advances beyond the field of PCMs.
What makes crystalline and amorphous PCMs so different?
The first and quick answer is “structure.” Although atomic structure is very important, there is even more. The different properties of the two phases are caused by very complex aspects on the atomic scale that have recently been reviewed.Reference Deringer, Dronskowski and Wuttig8 Even though current research is focusing on electronic memories, the most important consumer products based on PCMs so far have been optical discs (e.g., rewriteable Blu-ray discs); naturally, many studies have been devoted to the optical property contrast of PCMs. Based on experimentsReference Shportko, Kremers, Woda, Lencer, Robertson and Wuttig9 and later corroborated by theory,Reference Lencer, Salinga, Grabowski, Hickel, Neugebauer and Wuttig10,Reference Huang and Robertson11 it was suggested that crystalline PCMs are characterized by a generic bonding mechanism, namely, resonance bonding, that originates from the resonance between different bonding configurations. This mechanism leads to electron delocalization and high dielectric constants. The misalignment of directional p bonds weakens resonance bonding and, thus, lowers the dielectric constant and changes the optical matrix elements significantly.Reference Huang and Robertson11 As angular disorder in p-bonding prevails in amorphous PCMs,Reference Caravati, Bernasconi and Parrinello12 the origin of the optical contrast is thus identified. It is such microscopic understanding that paves the way to discover new PCMs with optimal properties.Reference Lencer, Salinga, Grabowski, Hickel, Neugebauer and Wuttig10
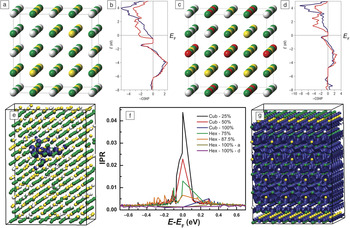
Metastable GST alloys form rock-salt-type structures upon fast crystallization, with a fully occupied tellurium sublattice and an interpenetrating one in which germanium, antimony, and vacancies are randomly arranged.Reference Yamada13,Reference Matsunaga and Yamada14 Why is this stoichiometric amount of vacancies formed in the first place? This question was addressed using DFTReference Wuttig, Lusebrink, Wamwangi, Welnic, Gillessen and Dronskowski15—first, computing energies and then dissecting the electronic structures with the help of a quantum-chemical bonding indicator, dubbed crystal orbital Hamilton population (COHP)Reference Dronskowski and Blöchl16 analysis. Starting from a hypothetical rock-salt Ge2Sb2Te4 alloy, germanium atoms were gradually removed from the model structure, until the experimentally observed composition of Ge1Sb2Te4 was reached (Figure 2a and 2c). Large negative formation energies were found, suggesting that the presence of vacancies is favorable, but a full understanding came from bonding theory (Figure 2b and 2d). The hypothetical, fully occupied lattice of Ge2Sb2Te4 exhibits significant antibonding interactions (–COHP < 0) at the Fermi level E F that decrease when germanium atoms are removed; this is because the cationic atoms donate electrons to the host structure. Nonetheless, a certain amount of occupied, antibonding levels remains in Ge1Sb2Te4, and similar observations were made for the binary parent compounds GeTeReference Waghmare, Spaldin, Kandpal and Seshadri17 and Sb2Te3.Reference Stoffel, Deringer, Simon, Hermann and Dronskowski18
Structural and electronic properties of crystalline GeSbTe compounds, illustrating (a–d) why the stoichiometric vacancies form, and (e–g) how they influence the electronic nature by causing disorder-induced localization. Tellurium, germanium, and antimony atoms and vacancies are rendered as green, gray, yellow, and red spheres, respectively. (a,c) Idealized crystal structures of rock-salt-type (a) Ge2Sb2Te4 and (c) Ge1Sb2Te4, with (b,d) corresponding crystal orbital Hamilton population (COHP) curves, where the blue and red curves represent germanium–tellurium and antimony–tellurium interactions, respectively. (e,g) Real-space isosurfaces (blue surfaces) enclosing the highest occupied electronic levels (i.e., at the Fermi level E F) in (e) disordered and (g) ordered Ge1Sb2Te4. (f) Inverse participation ratio (IPR) curves of various disordered and ordered cubic rock salt and (pseudo-) hexagonal GST models. The percentage stands for the occupation of vacancies of three (out of 12) cation layers. IPR serves as a measure of the regular or irregular distribution of electronic density; high IPR values indicate localization, while low IPR values, close to 0.001 in this case, stand for delocalization. In an infinite system, the IPR of a fully delocalized state is zero. Adapted with permission from References Reference Wuttig, Lusebrink, Wamwangi, Welnic, Gillessen and Dronskowski15 and Reference Zhang, Thiess, Zalden, Zeller, Dederichs, Raty, Wuttig, Blügel and Mazzarello23. © 2007, 2012 Nature Publishing Group.

What causes the electronic contrast?
Both amorphous and cubic GST are semiconducting, with bandgaps of 0.5–1.0 eV. Nevertheless, at room temperature, the electrical resistance values of the two metastable phases differ by more than three orders of magnitude.Reference Siegrist, Jost, Volker, Woda, Merkelbach, Schlockermann and Wuttig19 This contrast stems from the interplay between disorder strength and carrier concentration. In the amorphous state, E F is pinned in the middle of the bandgap as a result of disorder, and the carrier concentration is low. Rock-salt GST and related materials, on the other hand, exhibit so-called self-doping and p-type conductivity. DFT-based studiesReference Edwards, Pineda, Schultz, Martin, Thompson, Hjalmarson and Umrigar20,Reference Caravati, Bernasconi, Kühne, Krack and Parrinello21 traced this behavior back to the presence of excess vacancies on germanium/antimony sites (i.e., beyond those stoichiometric vacancies shown in Figure 2c). Consequently, E F is shifted to the valence band, and large concentrations of hole carriers arise.Reference Siegrist, Jost, Volker, Woda, Merkelbach, Schlockermann and Wuttig19
Interestingly, upon further thermal annealing of crystalline GST, the electrical resistance decreases by another three orders of magnitude at room temperature.Reference Siegrist, Jost, Volker, Woda, Merkelbach, Schlockermann and Wuttig19 Low-temperature transport measurements also revealed exciting phenomena: namely, disorder-induced electron localization and metal–insulator transitions.Reference Siegrist, Jost, Volker, Woda, Merkelbach, Schlockermann and Wuttig19,Reference Volker, Jost and Wuttig22 Zhang et al. elucidated the microscopic origins of these phenomena through large-scale DFT simulations.Reference Zhang, Thiess, Zalden, Zeller, Dederichs, Raty, Wuttig, Blügel and Mazzarello23 Rock-salt-type and pseudohexagonal structural models of GST containing up to 3584 atoms were subjected to DFT analysis. Anderson (disorder-induced) localization of electron wave functions was observed in the disordered models (Figure 2f): Through computations of the atomic projections of the electronic density of states, the inverse participation ratio (a parameter that characterizes the degree of localization of a wave function), and the spatial distribution of electronic wave functions, it was shown that the states near E F are exponentially localized inside vacancy-rich regions. The simulations also indicated that vacancy clusters (not voids) become ordered into vacancy planes upon progressive thermal annealing, driving the structural transition from cubic to layered structures and, independently, leading to extended electronic states and metallic behavior in Ge1Sb2Te4 (Figure 2e and 2g).
How does one simulate an amorphous material?
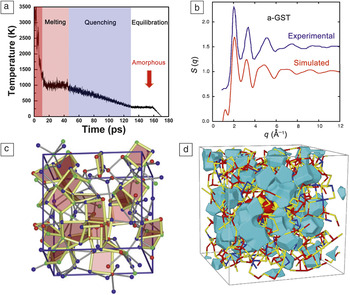
Given that crystalline PCMs are already complex, the same is even more so for their amorphous (glassy) counterparts. The first DFMD simulations of amorphous PCMs were reported independently by Caravati et al.Reference Caravati, Bernasconi, Kühne, Krack and Parrinello24 and Akola and JonesReference Akola and Jones25 in 2007. Amorphous (a-) Ge2Sb2Te5, as well as a-Ge2Sb2Te5 and a-GeTe, respectively, were produced by a melt-quench scheme, in which a simulation cell is loaded with atoms, randomized at very high temperature, and then rapidly cooled to achieve an amorphous structure (Figure 3a). The x-ray scattering factor S(q) was calculated based on the trajectory of a-Ge2Sb2Te5 at room temperature and compared to experimentsReference Caravati, Bernasconi, Kühne, Krack and Parrinello24 (Figure 3b). Clearly, the overall shape and primary peak positions of S(q) were well-recovered by the calculations. DFMD simulations also allow for the determination of quantities that are not easily accessible experimentally. The analysis of primitive rings, a typical indicator for medium-range order, revealed that fourfold rings dominate over the others and that most rings are planar with ABAB patterns (A, germanium/antimony; B, tellurium)Reference Caravati, Bernasconi, Kühne, Krack and Parrinello24–Reference Hegedüs and Elliott26 (Figure 3c). In addition, vacancy voids are abundant in amorphous PCMsReference Akola and Jones25,Reference Akola and Jones27,Reference Xu, Cheng, Wang, Sheng, Meng, Yang, Han and Ma28 (Figure 3d). Both observations were suggested to be linked to the materials’ ability to crystallize rapidly.
(a) Melt–quench scheme, illustrated by the time course of simulation temperature during a “real-life” density-functional molecular dynamics simulation. (b) Comparisons of experimental and simulated x-ray scattering factors S(q) for amorphous Ge2Sb2Te5. Adapted with permission from Reference Reference Caravati, Bernasconi, Kühne, Krack and Parrinello24. © 2007 American Institute of Physics. (c) Planar fourfold ABAB rings (A, germanium/antimony; B, tellurium) in amorphous Ge2Sb2Te5. Adapted with permission from Reference Reference Hegedüs and Elliott26. © 2008 Nature Publishing Group. (d) Amorphous Ge8Sb2Te11 with isosurfaces enclosing atomic vacancy voids. Adapted with permission from Reference Reference Akola and Jones27. © 2009 American Physical Society.

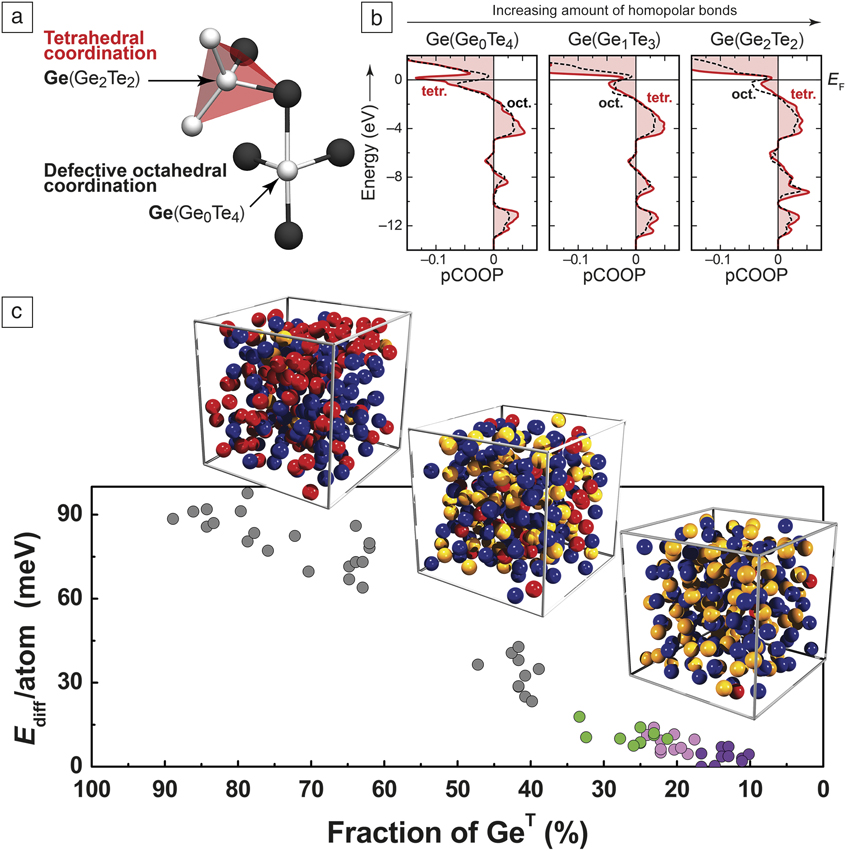
Local structural motifs in amorphous PCMs have been under very active study since a seminal work by Kolobov et al.Reference Kolobov, Fons, Frenkel, Ankudinov, Tominaga and Uruga29 in 2004. On the basis of extended x-ray absorption fine-structure spectroscopy (EXAFS) and x-ray absorption near-edge structure spectra of amorphous and recrystallized GST, the authors proposed an umbrella-flip model in which germanium atoms switch back and forth between octahedral and interstitial tetrahedral sites. This model provided an intuitive picture of the phase transitions; nevertheless, the real processes turned out to be far more complex from recent experiments and simulations (as discussed in the next section). In DFMD simulations of melt–quenched a-GST,Reference Caravati, Bernasconi, Kühne, Krack and Parrinello24,Reference Akola and Jones25 only roughly one-third of germanium atoms were found in tetrahedral environments (denoted GeT), whereas the residual germanium atoms were found in defective octahedral configurations (GeO; Figure 4a), as were all antimony and tellurium atoms. Coordination numbers and nearest-neighbor bond lengths were extracted independently from EXAFS measurements and DFMD simulations: The results agreed fairly well, except that the simulated germanium–tellurium bond length was about 6% larger than the experimental value. Unfortunately, an ultimate verdict based on either EXAFS (which involves indirect observations) or DFT (which might have intrinsic shortcomings) is very difficult, especially when it comes to small structural variations. In particular, the aforementioned bond-length deviation, the existence of GeT, and the nature of bonding have been under debate for more than a decade.Reference Xu, Cheng, Sheng and Ma30–Reference Mitrofanov, Kolobov, Fons, Wang, Tominaga, Tamenori, Uruga, Ciocchini and Ielmini39
(a) GeT and GeO motifs in a-GeTe. (b) Projected crystal orbital overlap population (pCOOP) analysis of local stability for GeT and GeO units having different amounts of homopolar germanium–germanium bonds. Adapted with permission from Reference Reference Deringer, Zhang, Lumeij, Maintz, Wuttig, Mazzarello and Dronskowski40. © 2014 Wiley-VCH. (c) Energy hierarchy of a-GeTe with respect to the fraction of GeT. Green points represent melt–quench a-GeTe, whereas other points were obtained by substituting germanium or tellurium atoms from a-SnTe (violet), a-GeSe (light magenta), and a-SiTe (gray). Three typical atomic images of a-GeTe are shown. GeT, GeO, and tellurium atoms are rendered as red, orange, and blue spheres, respectively. Adapted with permission from Reference Reference Raty, Zhang, Luckas, Chen, Bichara, Mazzarello and Wuttig43. © 2015 Nature Publishing Group.

Indeed, the observation of GeT in a-GeTe and a-GST is puzzling, as such a motif cannot be found in any crystalline (i.e., stable) form of the compounds: Exclusively octahedral-like coordination prevails. Furthermore, most GeT atoms in the amorphous phase are predicted to form at least one homopolar germanium–germanium bond,Reference Caravati, Bernasconi, Kühne, Krack and Parrinello24 again, at variance with the crystalline phases. In a 2014 report, a new theoretical chemical approach was employed to study the local nature of these different structural fragments.Reference Deringer, Zhang, Lumeij, Maintz, Wuttig, Mazzarello and Dronskowski40 This tool is conceptually similar to previous COHP analyses (Figure 2), but different in detail, in that it extracts the local chemical information from numerically efficient plane-wave basis sets,Reference Deringer, Tchougréeff and Dronskowski41,Reference Maintz, Deringer, Tchougréeff and Dronskowski42 which are routinely used in DFMD simulations of PCMs and other amorphous materials. As a result, the importance of homopolar bonds in stabilizing GeT fragments could be addressed and quantified. Figure 4b compares projected crystal orbital overlap populations for various GeT and GeO units in a-GeTe. Obviously, GeT units exhibit antibonding interactions at E F, but these interactions drop significantly with the onset of homopolar germanium–germanium bonding, whereas there is no pronounced change in the bonding nature of GeO. Because the heat of formation of GeTe is small, homopolar bonds are present in the molten state, and upon subnanosecond quenching, these bonds are frozen in and give rise to a fraction of GeT units.Reference Raty, Zhang, Luckas, Chen, Bichara, Mazzarello and Wuttig43 Hence, GeT is ultimately transient in nature, as discussed further in the text.
Resistance drift (i.e., an increase in resistance over time) in amorphous PCMsReference Wong, Raoux, Kim, Liang, Reifenberg, Rajendran, Asheghi and Goodson44,Reference Ielmini, Lacaita and Mantegazza45 is an outstanding problem for both fundamental research and memory technology, as it hinders multilevel storage applications. Because this drift occurs on time scales of seconds, minutes, or days, it is inaccessible to “brute-force” DFMD simulations. Nonetheless, other approaches are possible, and recently, Raty et al.Reference Raty, Zhang, Luckas, Chen, Bichara, Mazzarello and Wuttig43 were able to identify the microscopic origin of the resistance drift in a-GeTe, based on DFT simulations. Employing the chemical substitution method,Reference Cho, Im, Park, Son, Kim, Horii, Ihm and Han33,Reference Micoulaut, Kachmar and Charpentier37 the authors generated structural models of a-GeTe, in which the fraction of GeT ranged from 10–90% (Figure 4c). The models with the lowest amount of GeT yielded the lowest energy (violet points); importantly, they were more stable than “standard” melt-quenched a-GeTe models (green points). Thus, a-GeTe should evolve toward a network with less GeT. This lowers the energy and stress of the system, and it removes localized midgap electronic states. It was also shown that, concomitantly, the Peierls distortion (a local distortion towards more asymmetric environments, consisting of short and long bonds, which lowers the total energy) gets more pronounced in the aged amorphous network.Reference Raty, Zhang, Luckas, Chen, Bichara, Mazzarello and Wuttig43 As a result, the optical bandgap rises, and, thus, so does the resistance, whereas the dielectric constant is lowered.Reference Fantini, Brazzelli, Cazzini and Mani46,Reference Krebs, Bachmann, Jonnalagadda, Dellmann and Raoux47
What can DFT tell us about switching kinetics—and what can it not tell us?
The crystallization speed of PCMs spans over 17 orders of magnitude: At room temperature, the amorphous phases are metastable for decades, whereas at elevated temperatures (600–700 K), they crystallize within nanoseconds. This property is critical for data storage. Current supercomputers have made DFMD simulations of ∼1,000-atom models feasible, with runs over nanoseconds;Reference Kalikka, Akola and Jones48,Reference Zhang, Ronneberger, Zalden, Xu, Salinga, Wuttig and Mazzarello49 in other words, the crystallization process at high temperature can be directly simulated.
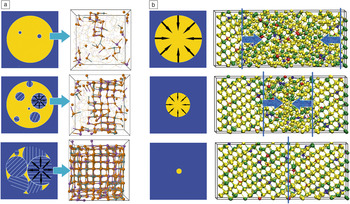
Two different crystallization stages have been identified in PCMs,Reference Meinders, Mijiritskii, van Pieterson and Wuttig50 namely, nucleation and growth, as sketched in Figure 5. In 2008, Hegedüs and ElliottReference Hegedüs and Elliott26 achieved the first DFMD crystallization simulation of a nucleation-dominated PCM, Ge2Sb2Te5, using system sizes of 63–90 atoms. Later, the same groupReference Lee and Elliott51 crystallized a larger 180-atom model, which enabled a reasonable estimate of the critical nucleus size (24–44 atoms) and growth rate (∼5 m/s). The fast crystallization was attributed to the high density of planar fourfold ABAB rings. This point was partly challenged by Kalikka and co-workers,Reference Kalikka, Akola and Jones48,Reference Kalikka, Akola, Larrucea and Jones52 who reported that the ABAB squares can break and re-form during crystallization as a result of the diffusive nature of the germanium, antimony, and tellurium motions at high temperatures and that this high atomic mobility is a prerequisite for fast growth. Their simulations comprised 460–648 atoms, and representative snapshots of the crystallization trajectory are shown in Figure 5a.
Crystallization kinetics of phase-change materials. The sketch plots (left columns in [a] and [b]) were inspired by Reference Reference Meinders, Mijiritskii, van Pieterson and Wuttig50. (a, left) The crystallization kinetics of GeSbTe compounds is nucleation-dominated, and the amorphous state crystallizes into a polycrystalline state (the grains were marked with white lines). The growth process is developed from the center of each grain, as marked with black arrows. (a, right) Density-functional molecular dynamics (DFMD) crystallization simulations of Ge2Sb2Te5 at 600 K. Germanium, antimony, and tellurium atoms are rendered as green, purple, and orange spheres, respectively. The nucleation and subsequent growth process represent the crystallization of one grain of amorphous Ge2Sb2Te5, as indicated by the cyan arrow. Adapted with permission from Reference Reference Kalikka, Akola and Jones48. © 2014 American Physical Society. (b, left) In growth-dominated phase-change materials, such as AgInSbTe compounds, the crystallization proceeds at the crystal–amorphous boundaries. The growth direction is from the boundary toward the center, as marked with black arrows. (b, right) DFMD crystallization simulations of AgInSbTe at 585 K. Silver, indium, antimony, and tellurium atoms are rendered as blue, red, yellow, and green spheres, respectively. The two-dimensional amorphous–crystalline boundaries are marked with blue vertical lines, and the growth directions are indicated by the blue arrows. Adapted with permission from Reference Reference Zhang, Ronneberger, Zalden, Xu, Salinga, Wuttig and Mazzarello49. © 2014 Nature Publishing Group.

In early 2015, Ronneberger et al.Reference Ronneberger, Zhang, Eshet and Mazzarello53 employed metadynamics,Reference Laio and Parrinello54 an enhanced sampling technique, to accelerate the formation of critical nuclei. Within a 460-atom supercell, quasispherical crystal clusters of ≤100 atoms were found to be stable. Crystal growth at the interface was studied as well, and the estimated growth speed of ∼1 m/s agreed reasonably with recent experiments.Reference Sebastian, Le Gallo and Krebs55–Reference Jeyasingh, Fong, Lee, Li, Chang, Mantegazza, Asheghi, Goodson and Wong57 All of these simulations have shown that the pronounced disorder in metastable rock-salt GST is a consequence of fast crystallization. The atoms near the crystal surface have very limited time to arrange themselves to impinge on the crystalline interface, so a highly disordered structure results. Based on DFT total-energy calculations, Sun et al.Reference Sun, Zhou and Ahuja58 and Da Silva et al.Reference Da Silva, Walsh and Lee59 proposed an ordered rock-salt GST with regular atomic and vacancy layers. Given sufficient time to guarantee a smooth crystal-growth process, such a phase could also be produced, for example, by using molecular beam epitaxy techniques.Reference Pauly, Liebmann, Giussani, Kellner, Just, Sánchez-Barriga, Rienks, Rader, Calarco, Bihlmayer and Morgenstern60
Another study showed that the crystallization time limit of GST can be further reduced by applying a constant low voltage during the crystallization process.Reference Loke, Lee, Wang, Shi, Zhao, Yeo, Chong and Elliott61 DFMD simulations indicated that this reduction stems from structural preordering induced by voltage.Reference Loke, Lee, Wang, Shi, Zhao, Yeo, Chong and Elliott61 To further increase the accessible system size, Sosso et al.Reference Sosso, Miceli, Caravati, Behler and Bernasconi62 developed a DFT-trained neural-network potential obtained by fitting the GeTe hypersurface that afforded new atomistic insight into the atomic-scale processes during crystallization of this compound.Reference Sosso, Miceli, Caravati, Giberti, Behler and Bernasconi63,Reference Sosso, Colombo, Behler, Del Gado and Bernasconi64
As mentioned in the introduction, a silver-/indium-substituted Sb2Te alloy (AIST) is a powerful material for data storage. In contrast to the nucleation process in GST, the dominant crystallization mechanism in AIST is growth from the amorphous–crystalline interface (Figure 5b). In 2014, Zhang et al. performed DFMD simulations of AIST crystallization, using up to 810-atom systems.Reference Zhang, Ronneberger, Zalden, Xu, Salinga, Wuttig and Mazzarello49 Because AIST crystallizes in the stacked layer structure,Reference Matsunaga, Akola, Kohara, Honma, Kobayashi, Ikenaga, Jones, Yamada, Takata and Kojima65 two adjacent crystalline layers along [0001] were fixed during the melt–quench run, creating two amorphous–crystalline boundaries. Upon heating at 585 K, the system quickly crystallized, and smooth growth along the boundary was observed (Figure 5b); the thus-obtained growth rate and recrystallized structure agreed with recent experiments.Reference Matsunaga, Akola, Kohara, Honma, Kobayashi, Ikenaga, Jones, Yamada, Takata and Kojima65,Reference Salinga, Carria, Kaldenbach, Bornhofft, Benke, Mayer and Wuttig66 The fast growth was explained by the high atomic mobility near the very thin interface, together with a very effective sticking process.Reference Zhang, Ronneberger, Zalden, Xu, Salinga, Wuttig and Mazzarello49
Despite these successes, DFMD simulations encounter a serious problem at lower temperatures in the range of 450–500 K, where the obtained growth speeds are orders of magnitude larger than experimental values.Reference Zhang, Ronneberger, Zalden, Xu, Salinga, Wuttig and Mazzarello49 This problem is attributed to the ultrahigh fragility of AISTReference Salinga, Carria, Kaldenbach, Bornhofft, Benke, Mayer and Wuttig66 and the too-high quenching rates employed in DFMD simulations, which are typically 100–1000 times higher than experimental rates (because of the very high computational costs). The potential energy landscape of fragile systems is very complex,Reference Debenedetti and Stillinger67 and high quenching rates lead to insufficient exploration of phase space.Reference Zhang, Ronneberger, Zalden, Xu, Salinga, Wuttig and Mazzarello49 Therefore, at low temperatures, the simulated crystal growth is much faster than in reality.Reference Salinga, Carria, Kaldenbach, Bornhofft, Benke, Mayer and Wuttig66
As such, simulating the crystallization dynamics at lower temperatures still remains an open question. An understanding of fragility is crucial for phase-change data storage: High fragility guarantees a dramatic change in the temperature dependence of the growth velocity, which makes the crystallization process ultrafast at high temperature, but extremely slow at room temperature.Reference Zhang, Ronneberger, Zalden, Xu, Salinga, Wuttig and Mazzarello49,Reference Orava, Greer, Gholipour, Hewak and Smith56,Reference Jeyasingh, Fong, Lee, Li, Chang, Mantegazza, Asheghi, Goodson and Wong57,Reference Salinga, Carria, Kaldenbach, Bornhofft, Benke, Mayer and Wuttig66
What challenges and opportunities lie ahead?
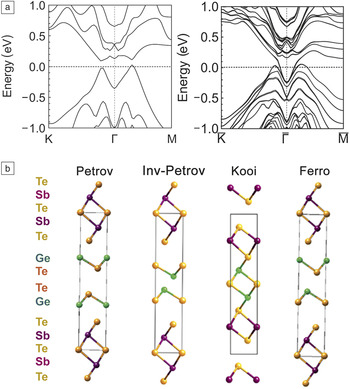
DFT has made a major difference in our current understanding of PCMs. In the following, we briefly outline a few other examples where DFT is being attempted as we speak and where DFT for PCM is heading in the near term. The structural parent compound Sb2Te3 is among the best-known topological insulators (TIs),Reference Zhang, Liu, Qi, Dai, Fang and Zhang68,Reference Hasan and Kane69 which represent a new class of electronic materials with an insulating bulk state and a topologically protected conducting surface state (due to time-reversal symmetry and strong spin–orbit coupling).Reference Hasan and Kane69 Interestingly, layered Ge2Sb2Te5 with the Petrov sequence, -Te-Sb-Te-Ge-Te-Te-Ge-Te-Sb-(Te-) (the bracket indicates the periodic image), has been predicted to be a TI.Reference Kim, Kim and Jhi70 The DFT band structure of the bulk phase has a finite bandgap, whereas the surface states display metallic behavior and form a Dirac cone at the Γ point (Figure 6a).
(a) Density-functional-theory-simulated electronic band structures of the bulk and surface states of hexagonal Ge2Sb2Te5 in the Petrov sequence. Adapted with permission from Reference Reference Kim, Kim and Jhi70. © 2010 American Physical Society. (b) Possible (transient) stacking sequence of interfacial phase-change memory Ge2Sb2Te5, namely, Petrov, inverted Petrov, Kooi, and Ferro GeTe. The corresponding atomic sequences are -Te-Sb-Te-Ge-Te-Te-Ge-Te-Sb-(Te-), -Te-Sb-Te-Te-Ge-Ge-Te-Te-Sb-(Te-), -Te-Ge-Te-Sb-Te-Te-Sb-Te-Ge-(Te-), and -Te-Sb-Te-Ge-Te-Ge-Te-Te-Sb-(Te-). The bracket indicates the periodic image. Adapted with permission from Reference Reference Tominaga, Kolobov, Fons, Nakano and Murakami72. © 2014 Wiley-VCH.

Recently, Simpson et al. as well as Tominaga and co-workersReference Simpson, Fons, Kolobov, Fukaya, Krbal, Yagi and Tominaga71,Reference Tominaga, Kolobov, Fons, Nakano and Murakami72 designed a new storage scheme that exploits fast and reversible transitions occurring in crystalline Ge2Sb2Te5 superlattices. This concept, dubbed interfacial phase-change memory (iPCM), could lead to significantly lower power consumption.Reference Simpson, Fons, Kolobov, Fukaya, Krbal, Yagi and Tominaga71 Although the switching mechanism is not fully understood, it is believed to be due to transitions between different stacking sequences (Figure 6b). The contrast in electrical resistance could originate from the different topological properties of the relevant phases.Reference Kim, Kim and Jhi70,Reference Tominaga, Kolobov, Fons, Nakano and Murakami72,Reference Sa, Zhou, Sun, Tominaga and Ahuja73 For this reason, iPCMs are also referred to as topological-switching random-access memories. Therefore, a DFT-based understanding of the topological properties of GST compounds is not only theoretically interesting, but also of practical value.
The properties of PCMs can be enhanced and expanded by doping with small amounts of adatoms: The exploration and design of suitable dopants offer intriguing possibilities for experimental–theoretical collaboration. For example, Prasai et al.,Reference Prasai, Kordesch, Drabold and Chen74 Skelton et al.,Reference Skelton, Pallipurath, Lee and Elliott75 and Zhu et al.Reference Zhu, Xia, Rao, Li, Wu, Ji, Lv, Song, Feng, Sun and Zhang76 showed that additions of silver, bismuth, and titanium, respectively, can improve the crystallization kinetics of GST and Sb2Te3 at high temperatures. It was reported by Song et al.Reference Song, Shi, Miao and Chong77 that Fe-doped GST is ferromagnetic in both phases, which, however, display pronounced contrast in saturation magnetization (∼30%). Hence, doping with transition-metal atoms might lead to magnetic switching in PCMs. Design rules on dopant selection for magnetic PCMs were recently proposed based on DFT simulations.Reference Ding, Bai, Song, Shi, Zhao, Ji, Sullivan and Wu78–Reference Skelton and Elliott80
What might other materials-science fields learn from these examples?
Before closing, we note that the experience gained and lessons learned from employing DFT calculations in the thriving field of PCMs and memories, through both successful and failed attempts, could be instructive to the materials science community at large. The specific examples discussed in this article are illustrative of the power of DFT-based approaches: systematic simulations to construct design rules to find better-performance compounds; large-scale DFT simulations to uncover new physics, such as disorder-induced phenomena and crystallization kinetics of complex systems (ternary, quaternary, etc.); enhanced sampling techniques for rare events such as nucleation; DFT-trained neural-network potentials to reduce computational costs; quenching-time issues in the kinetic properties of fragile systems; electronic-level understanding of the nature of chemical bonding in highly disordered amorphous materials; the use of chemical substitution methods to describe relaxation mechanisms in the amorphous state; detection of unusual electronic properties of topological phases and the switching processes between them; tailoring of materials performance through doping; and manipulation of magnetic properties with phase-change cycles. These DFT simulations revealed atomistic mechanisms on the electronic structure level, and as such, supplement laboratory experiments in explaining the observed properties. Whenever possible, the DFT predictions should be checked against experimental findings to bridge the gap between a “real-life” device and a quantum-mechanical approximant to it.
We believe that other materials-science fields would benefit from similar tactics. For instance, extending our analysis of the crystallization of PCM glass discussed earlier, large-scale DFMD simulations might unravel the atomistics of crystallization kinetics (propagation speed of the crystal front) in elemental metallic glasses,Reference Greer81 which have so far remained unexplainable using all current models and MD simulations. State-of-the-art DFT calculations are also instrumental in uncovering the unprecedented impact of defects on the electronic structure of two-dimensional materials.Reference Novoselov, Fal’ko, Colombo, Gellert, Schwab and Kim82,Reference Wang, Kalantar-Zadeh, Kis, Coleman and Strano83 Ab initio design rules can be developed in many fields, including engineering materials such as steels.Reference Hickel, Dick, Grabowski, Körmann and Neugebauer84 Local bonding analysis methods should shed light on other complex amorphous materials.Reference Nomura, Ohta, Takagi, Kamiya, Hirano and Hosono85 Incidentally, in this endeavor, PRAM-equipped supercomputers could very well turn out to be the enabling vehicle that makes these developments feasible in the near future.
Acknowledgments
W.Z., V.L.D., R.D., R.M., and M.W. gratefully acknowledge funding from Deutsche Forschungsgemeinschaft (DFG) within SFB 917 (“Nanoswitches”). W.Z. and M.W. acknowledge ERC Advanced Grant Disorder Control. W.Z. gratefully thanks the Young Talent Support Plan of Xi’an Jiaotong University. E.M. acknowledges support from US DoE-BES-DMSE, DE-FG02-13ER46056.

Wei Zhang is an associate professor and a distinguished research fellow of materials science and engineering at Xi’an Jiaotong University, Xi’an, China, where he is supported by the university’s Young Talent Support Plan. He received bachelor’s and master’s degrees in physics from Zhejiang University, Hangzhou China, and a PhD degree from RWTH Aachen University, Aachen, Germany, under the guidance of Riccardo Mazzarello and Matthias Wuttig. His current research interests include electronic and memory materials, first-principles materials design, and materials behavior at the nanoscale. Zhang can be reached by email at wzhang0@mail.xjtu.edu.cn.

Volker L. Deringer is a postdoctoral researcher at RWTH Aachen University, Aachen, Germany, as of this writing, and will start a postdoc at the University of Cambridge, UK, in October 2015. He obtained his diploma in 2010 and doctorate in 2014, both under the guidance of Richard Dronskowski at RWTH. He has been awarded fellowships from the German National Academic Foundation and, recently, from the Alexander von Humboldt Foundation. His research interests concern the chemical-bonding nature of solids, including surfaces, defects, and amorphous materials. Deringer can be reached by email at volker.deringer@ac.rwth-aachen.de.

Richard Dronskowski is a full professor of chemistry at RWTH Aachen University, Aachen, Germany, where he holds the Chair of Solid-State and Quantum Chemistry. He obtained his doctorate under the guidance of Arndt Simon at Stuttgart University, Stuttgart, Germany, and worked with Roald Hoffmann at Cornell University (Ithaca, N.Y.) as a visiting scientist. After receiving his habilitation in 1995, he joined RWTH, where he was elected Distinguished Professor in 2014. His research interests comprise synthetic solid-state chemistry (carbodiimides, guanidinates, and nitrides), neutron diffraction, and condensed-matter theory (electronic structure, chemical bonding, and thermochemistry). Dronskowski can be reached by email at drons@HAL9000.ac.rwth-aachen.de.

Riccardo Mazzarello is a junior professor in theoretical nanoelectronics at RWTH Aachen University, Aachen, Germany, where he has been since December 2009. He is a computational physicist working in the field of condensed-matter physics, mesoscopic physics, and materials science. His main research interests include phase-change materials, graphene nanostructures, and self-assembled monolayers of organic molecules deposited on metallic substrates, which he investigates using ab initio methods based on density functional theory. Mazzarello can be reached by email at mazzarello@physik.rwth-aachen.de.

Evan Ma is a full professor of materials science and engineering at Johns Hopkins University (JHU), Baltimore, Md. He also holds an adjunct professorship at Xi’an Jiaotong University, Xi’an, China. He did his undergraduate and graduate studies at Tsinghua University, Beijing, China, and California Institute of Technology (Pasadena, Calif.) and postdoctoral work at Massachusetts Institute of Technology (Cambridge, Mass.). Prior to JHU, he was an assistant and associate professor at Louisiana State University. He has published ∼300 papers and presented ∼110 invited talks at international conferences. His current research interests include metallic glasses, chalcogenide phase-change alloys, nanostructured metals, plasticity mechanisms, and in situ TEM of small-volume materials. He is an elected Fellow of ASM, APS, and MRS. Ma can be reached by email at ema@jhu.edu.

Matthias Wuttig is a full professor of physics at RWTH Aachen University, Aachen, Germany, where his research focus is the understanding and tailoring of materials with unique optical and electrical properties. He received a diploma in physics from the University of Cologne, Köln, Germany, and a PhD degree from Forschungszentrum Jülich/RWTH Aachen. He is speaker on the Strategy Board of RWTH Aachen and has served as Dean of the faculty of science, mathematics, and computer sciences. He is the coordinator of the Collaborative Research Centre “Nanoswitches.” His awards include an ERC Advanced Grant in 2013. Wuttig can be reached by email at wuttig@physik.rwth-aachen.de.