

1. Introduction
The recent finding of mesaxonic tridactyl footprints referable to a theropod dinosaur (see Citton et al. Reference Citton, Nicosia, Nicolosi, Carluccio and Romano2015), preserving a well-marked and complete trace of the right and left metatarsus, gave the chance to perform a morphometric and quantitative analysis in order to establish the best fit between the analysed tracks and well-known non-avian theropod pes morphologies.
Elongated traces are well reported in the dinosaurian ichnological record. Metatarsal impressions have been ascribed to theropod dinosaurs (Gierliński Reference Gierliński1994, Reference Gierliński and Morales1996; Romero-Molina et al. Reference Romero-Molina, Sarjeant, Pérez-Lorente, Lopez and Requeta2003; Farlow et al. Reference Farlow, Bates, Bonem, Dattilo, Falkingham, Gildner, Jacen, Kuban, Martin, O'Brien, Whitcraft and Noto2015; ichnogenera Kayentapus, Eubrontes, Gigandipus in Lockley, Matsukawa & Li, Reference Lockley, Matsukawa and LI2003); tentatively to a theropod (Lockley et al. Reference Lockley, Hunt, Meyer, Rainforth and Schultz1998); ornithischian dinosaurs (i.e. ichnogenus Anomoepus in Avanzini, Gierliński & Leonardi, Reference Avanzini, Gierliński and Leonardi2001); Oviraptorosauria (Nicosia et al. Reference Nicosia, Petti, Perugini, D'Orazi porchetti, Sacchi, Conti, Mariotti and Zarattini2007); a small theropod (Milàn, Loope & Bromley, Reference Milán, Loope and Bromley2008); a quadruped small non-theropod with a theropod-like pes (i.e. Silesaurus in Gierliński, Lockley & Niedzwiedzki, Reference Gierliński, Lockley and Niedzwiedzki2009); a ceratosaurian theropod (Gierliński Lockley & Niedzwiedzki, Reference Gierliński, Lockley and Niedzwiedzki2009); a large Dilophosaurus-like theropod (Milner et al. Reference Milner, Harris, Lockley, Kirkland and Matthews2009); a basal ornithischian (Wilson, Marsicano & Smith, Reference White2009); and an ?ornithomimosaur (Farlow et al. Reference Farlow, Bates, Bonem, Dattilo, Falkingham, Gildner, Jacen, Kuban, Martin, O'Brien, Whitcraft and Noto2015).
The studied footprints were identified on a calcareous block in the pier of Porto Canale-Riomartino, a small harbour located a few kilometres southeast of Latina (Latium, Central Italy, see Citton et al. Reference Citton, Nicosia, Nicolosi, Carluccio and Romano2015, fig. 1, p. 2). The track-bearing block comes from the Ausoni Mountains, which are part of the Volsci Range (Centamore, Di Manna & Rossi, Reference Centamore, Di Manna and Rossi2007), the innermost portion of the ‘Apenninic Carbonate Platform’ (i.e. the Latium-Abruzzi and Campania Carbonate Platforms considered as a unitary domain – sensu Mostardini & Merlini, Reference Mostardini and Merlini1986; Pescatore et al. Reference Pescatore, Renda, Schiattarella and Tramutoli1999; Cosentino et al. Reference Cosentino, Cipollari, Di Donato, Sgrosso and Sgrosso2002). In this domain, the typical sedimentary succession includes neritic carbonate sediments of a shelf environment (Accordi et al. Reference Accordi, Carbone, Civitelli, Corda, De Rita, Esu, Funiciello, Kotsakis, Mariotti and Sposato1988) undergoing short emersion events (Chiocchini et al. Reference Chiocchini, Farinacci, Mancinelli, Molinari and Potetti1994; Chiocchini, Pampaloni & Pichezzi, Reference Chiocchini, Pampaloni and Pichezzi2012).
The rock on which the footprints are preserved is made of hazel mudstone–wackestone with evidence of surface emersion at the time of dinosaur trampling. The microfaunal assemblage, characterized by the occurrence of Cuneolina sliteri Arnaud Vanneau & Premoli Silva, Reference Arnaud Vanneau, Premoli Silva, Haggerty, Premoli Silva, Rack and McNutt1995 (Chiocchini, Pampaloni & Pichezzi, Reference Chiocchini, Pampaloni and Pichezzi2012), suggests a late Aptian – ?early Albian age. The faunal composition also includes Nezzazata isabellae and Arenobulimina gr. cochleata, shell fragments, subordinate ostracods and very rare oncoids (Citton et al. Reference Citton, Nicosia, Nicolosi, Carluccio and Romano2015).
The studied tracks were attributed to a medium-sized, non-avian theropod on the basis of the features characterizing the metatarsal impressions and, in general, for the relative proportions of the preserved anatomical elements, more resembling the osteological structure of theropods rather than that of ornithopods (Citton et al. Reference Citton, Nicosia, Nicolosi, Carluccio and Romano2015). The footprint F3 (following the subdivision in Citton et al. Reference Citton, Nicosia, Nicolosi, Carluccio and Romano2015), which was qualified as a true track (sensu Lockley, Reference Lockley1991; Marty, Strasser & Meyer, Reference Marty, Strasser and Meyer2009), preserves several anatomical details that can be used as topographical reference points for the identification of the osteological elements that have left the impressions.
On the basis of the available evidence, two different hypothetical pes morphologies were reconstructed, and the lengths obtained in the two models were analysed morphometrically. In the study, several pedal morphologies of avian and non-avian theropods were included. Analyses comparing footprints and theropod autopods using PCA (principal component analysis) or other morphometric methods are not new in tetrapod ichnology and are all focused on the phalangeal portion of the digit and, in some cases, on the metatarsals (e.g. Farlow & Lockley, Reference Farlow and Lockley1993; Dalla Vecchia & Tarlao, Reference Dalla vecchia and Tarlao2000; Smith & Farlow, Reference Smith, Farlow, LeTourneau and Olsen2003; Farlow et al. Reference Farlow, Holtz, Worthy, Chapman, Parrish, Molnar, Currie and Koppelhaus2013, Reference Falkingham and Gatesy2014; Castanera et al. Reference Castanera, Colmenar, Sauqué and Canudo2015). Given the preservation of mirrored anatomical details, the material considered in the present study allows us to tentatively match the footprints with elongated metatarsal traces to the theropod pedal morphologies morphometrically.
A more refined attribution to a putative trackmaker will allow a better appraisal of dinosaurian diversity in the carbonate platforms of the central Mediterranean area, with implications for macroevolutionary models and palaeobiogeography.
2. Material and methods
The footprint F3 (Fig. 1) was selected as the reference track. Starting from the impression, two hypothetical foot structures and anatomical constraints derived from the type of impression were reconstructed.
Riomartino tracks. (a) Footprints F1, F2 and F3. Scale in the photograph = 15 cm; (b) Shaded coloured photogrammetric model of the track-bearing block with superimposed interpretative drawing (drawn on the actual track-bearing block). Slightly modified from Citton et al. (Reference Citton, Nicosia, Nicolosi, Carluccio and Romano2015).

The first anatomical constraint, considered the most solid for the morphometric analysis, is the proximal termination of the metatarsus impression. In this portion, the footprint is countersunk, reaching its maximum width at the proximal edge (this structure is clearly visible in the footprint F2, Fig. 1).
This structure corresponds to the area of articulation between the metatarsus and distal tarsal and can be considered in all probability as the proximal limit of the metatarsals. Distally, the second probable constraint is the terminal tip of the three digits. In vivo experiments (i.e. Homo sapiens and Gallus gallus, pers. obs.) show that the proximal and distal extremities anatomically related to a footprint (imprinted in the first moment of touchdown and in the last moment of the kick-off phase) remain largely unchanged in position on a cohesive substrate, during locomotion and, more reasonably, during a resting phase. This might not be the case in loose and granular media, as experimentally shown by Falkingham & Gatesy (Reference Falkingham and Gatesy2014) for a guinea fowl walking through dry and granular material. However, in the studied material we do not deal with loose sediment at the time of track formation but with a cohesive carbonate mud; both these conditions represent two of the many possible surface layer and substrate conditions on which a fossil footprint can be made, and are differently preserved, in the fossil record. In this specific case, and taking into account that footprint F3 is a ‘true track’ not showing relevant extra morphological substrate-related features, the two identified areas can be used as quite stable biometric constraints and homologous points. In contrast, the footprint width seems to shows a greater amount of variation, which can be ascribed both to the development of expulsion rims and/or the collapse of sediments under waterlogged conditions.
The choice of homologous reference points with regards to the position of the joint between the metatarsus and the proximal phalanges is a more subjective approach. In particular, the variability affecting the distal arrangement of the metatarsus in different theropod groups must be carefully taken into account. In this regard, two general patterns were identified. In the first, from here on referred to as Type I, the terminations of the third and fourth metatarsal coincide more or less distally, while the second is shorter, with a more proximal termination. This morphology can be observed, for example, in Struthiomimus altus, Tochisaurus nemegtensis and Ornitholestes hermanni (see Holtz, Reference Holtz1994, fig. 1, p. 481). The second arrangement (Type II) is characterized by a longer, distally more developed third metatarsal, while metatarsals II and IV are shorter and more or less equal in length (thus ending approximately at the same point distally, a condition considered typical of primitive theropods in Holtz, Reference Holtz1994). This more widespread condition is observed in a large number of theropods, including Albertosaurus libratus, Elmisaurus rarus, Avimimus portentosus, Coelophysis bauri, Dilophosaurus wetherilli, Ceratosaurus nasicornis, Allosaurus fragilis, Chilantaisaurus tashuikouensis, Elaphrosaurus bambergi and Deinonychus antirrhopus (see Holtz, Reference Holtz1994, fig. 1, p. 481). The two recognized patterns (Type I and Type II) were used to identify the homologous points for measurements, as reported in Figure 2.
Homologous points chosen for the measurements in the footprints and autopods. (a) Type I interpretation; (b) Type II interpretation; (c) foot in Chirostenotes pergracilis redrawn from Weishampel, Dodson & Osmólska (Reference Weishampel, Dodson and Osmólska1990, fig. 3.11, p. 63, fig. 9.2, p. 247). MTL – metatarsus length; LII – digit II length; LIII – digit III length; LIV – digit IV length.
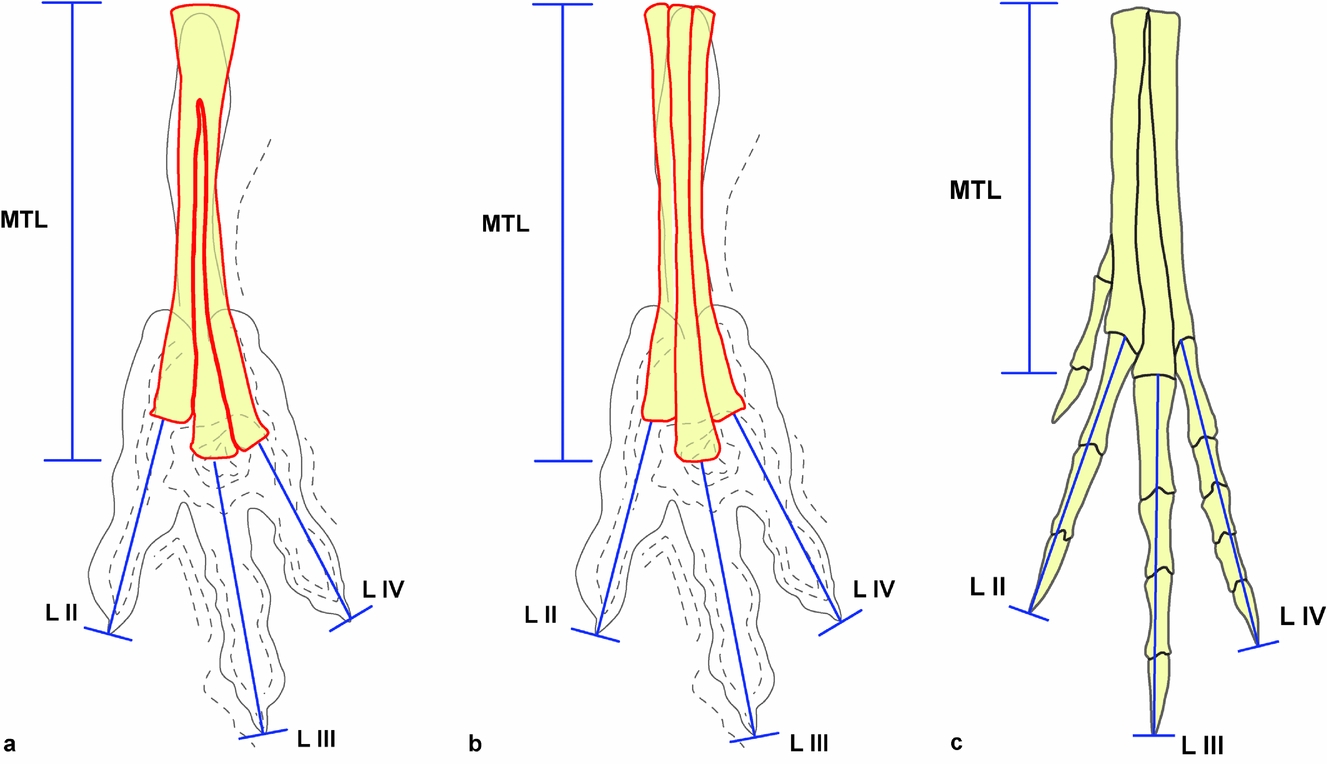
In order to take the measurements, the metatarso-phalangeal joints of digits III and IV for Type I, and that of digit III for Type II, were considered coincident with the deepest footprint portion, subcircular in shape, which is located proximally to the hypex between digits III and IV. The measurements selected for the morphometric analysis are the total length of the metatarsus (measured along the metatarsal III (MTL)) and the lengths of the phalangeal portions of digits II–IV.
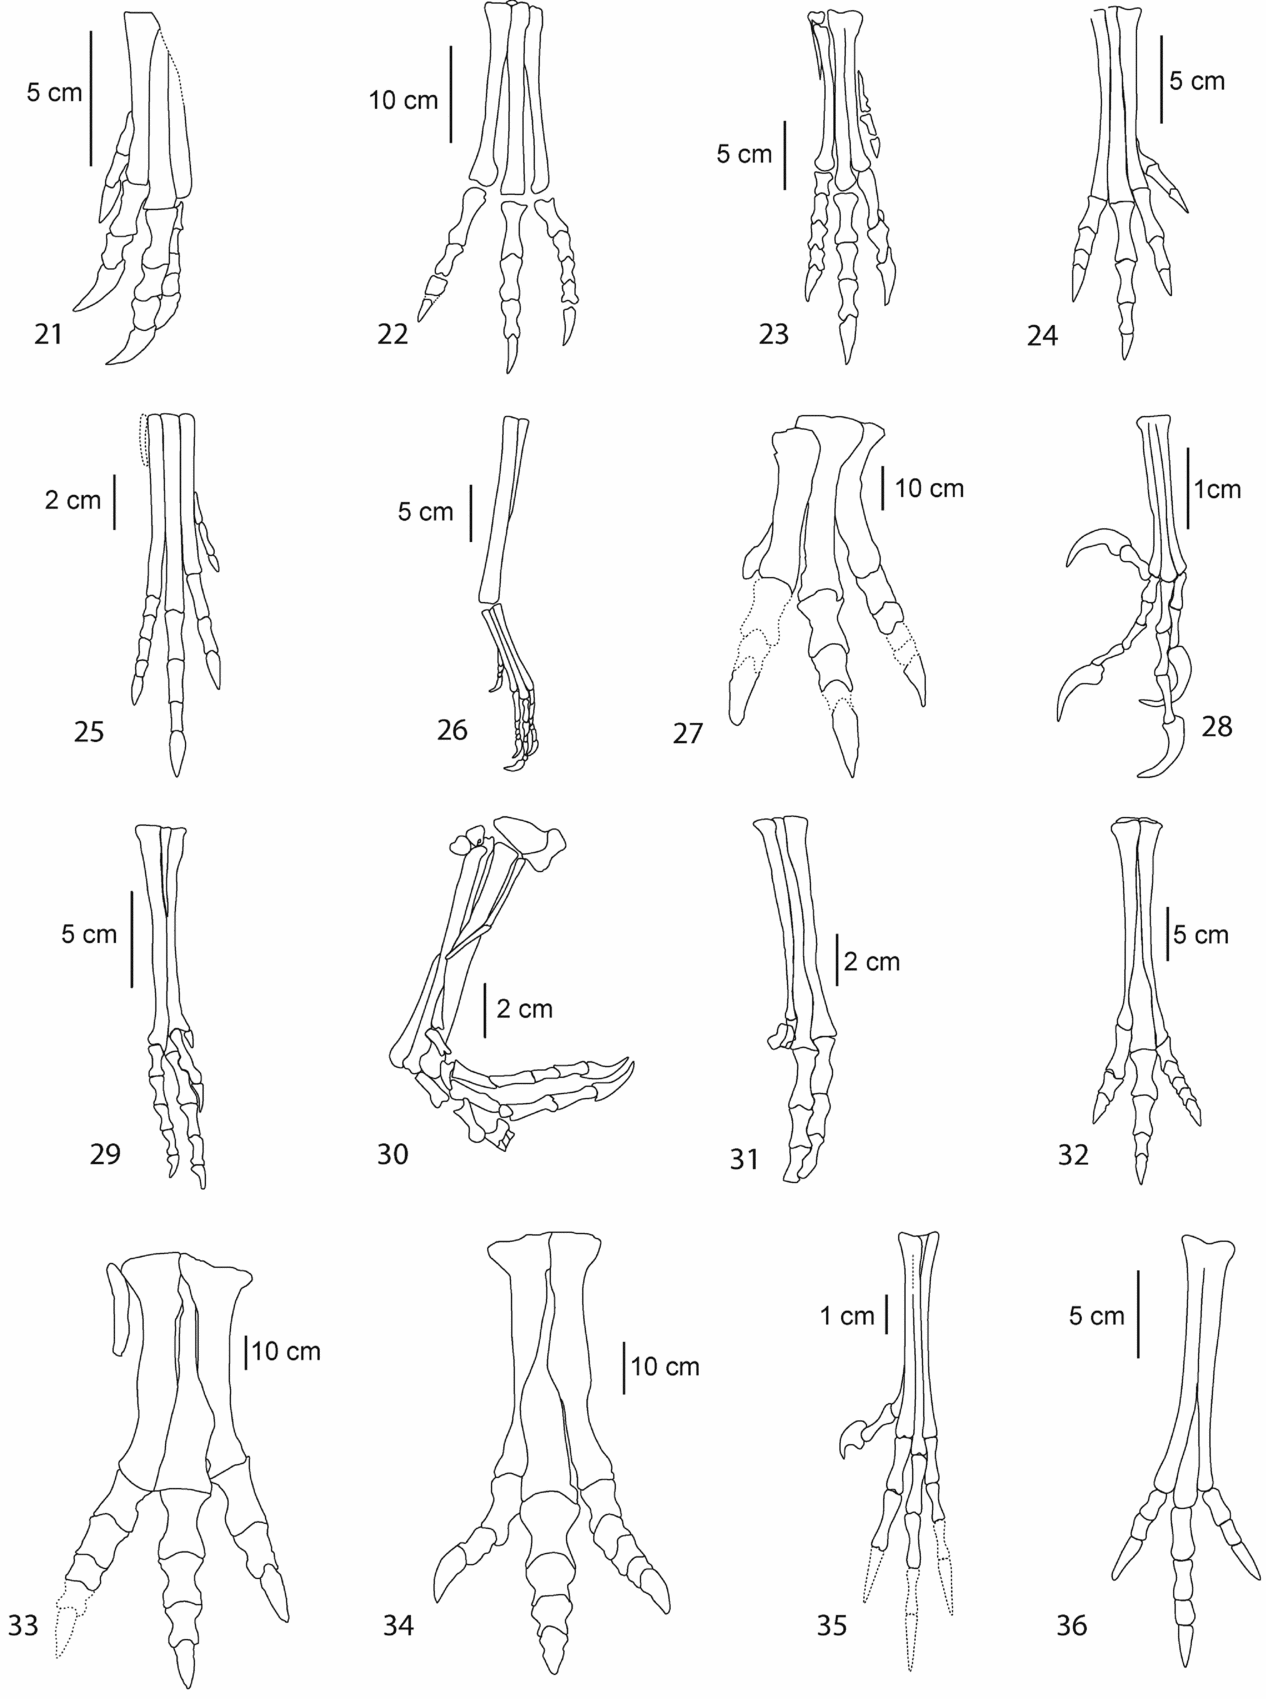
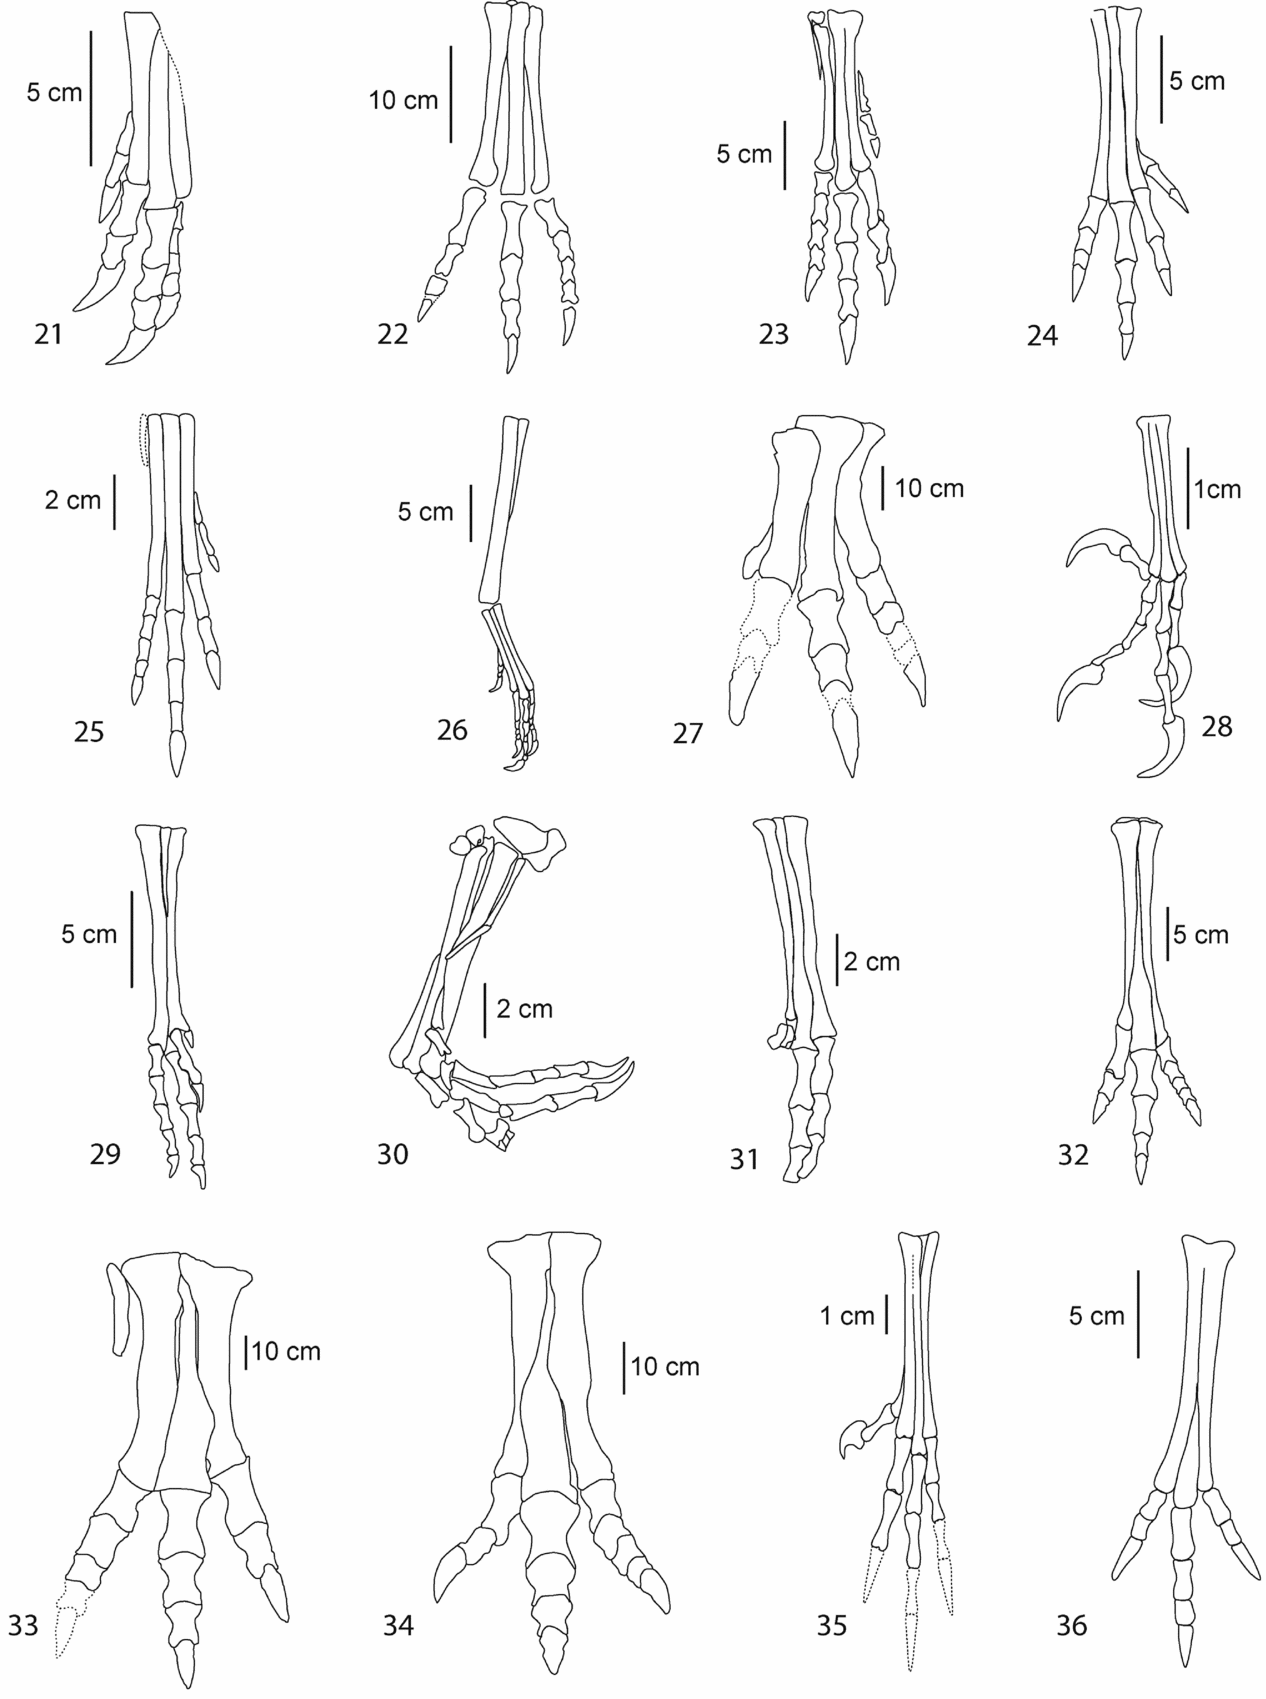
Osteological reference material for body fossils was taken and measured from published photographs and drawings (Fig. 3). Thirty-seven theropod taxa were selected, representing Abelisauridae, Allosauridae, Avialae, Coelophysoidea, Coelurosauria incertae sedis, Deinonychosauria, Neoceratosauria, Ornithomimosauria, Oviraptorosauria and Tyrannosauridae (see Table 1).
Foot outlines of the selected theropod taxa. 1 – Ajancingenia; 2 – Allosaurus; 3 – Anchiornis; 4 – Archaeopteryx; 5 – Aucasaurus; 6 – Aurornis; 7 – Deinocheirus; 8 – Bambiraptor; 9 – Changchengornis; 10 – Chirostenotes; 11 – Citipati; 12 – Coelophysis; 13 – Compsognathus; 14 – Confuciusornis; 15 – Daspletosaurus; 16, –Deinonychus; 17 – Dilophosaurus; 18 – Elmisaurus; 19 – Gallimimus; 20 – Harpymimus.

Foot outlines of the selected theropod taxa. 21 – Khaan; 22 – Liliensternus; 23 – Syntarsus; 24 – Nedcolbertia; 25 – Procompsognathus; 26 – Protarchaeopteryx; 27 – Saurophaganax; 28 – Sinornis; 29 – Sinornithoides; 30 – Sinornithosaurus; 31 – Sinovenator; 32 – Struthiomimus; 33 – Tyrannosaurus; 34 – Tarbosaurus; 35 – Wellnhoferia; 36 – Avimimus; T1 – Type I; T2 – Type II. Specimens redrawn from the original figures reported in Table 1.
List, measurements and references for the theropod taxa selected for the present study

The second digit in Daspletosaurus and Sinovenator is little known and incomplete, so this was coded with a question mark. In contrast, the ungual phalanx in digit III in Aucasaurus is not preserved distally, but the reconstruction provided by Coria, Chiappe & Dingus (Reference Coria, Chiappe and Dingus2002, fig. 4, p. 464) was considered sufficiently accurate for inclusion here. In Harpymimus digits III and IV are incomplete, but we tentatively consider the reconstruction provided by Makovicky, Kobayashi & Currie (Reference Makovicky, Kobayashi, Currie, Weishampel, Dodson and Osmólska2004, fig. 6.5, p. 145) as realistic. In Gallimimus the ungual phalanx of digit II was reconstructed using average dimensions of the ungual phalanges in digits III and IV. The second phalanx of digit II in Ajancingenia yanshini (‘Ingenia’ in Weishampel, Dodson & Osmólska, Reference Weishampel, Dodson and Osmólska2004) was reconstructed using the length of the second phalanx in digit III of the same taxon. The length of these two phalanges is comparable and more or less equal in a wide range of theropods, including Allosaurus, Coelophysis, Compsognathus, Dilophosaurus, Majungasaurus, Megapnosaurus and Tyrannosaurus. In Tyrannosaurus rex, a cast of FMNH PR 2081 was used for reference; in this specimen the penultimate and ungual phalanges are missing and have been reconstructed. For the foot in Saurophaganax we considered the holotype OMNH 01307, which is partly reconstructed (first and second phalanges of digit II; third phalanx of digit III; third and fourth phalanges of digit IV). The ungual phalanx in digit II of Sinornithosaurus millenii was reconstructed using the average dimensions of the ungual phalanges of digits III and IV in Xu, Wang & Wu (Reference XU, Wang and WU1999, fig. 4, p. 265). Because the software used replaces question marks with values derived from an algorithm applied to the whole dataset, we chose instead to reconstruct missing parts using the available osteological data and the wide-ranging phalangeal formulae for the three phalanges for digit II.
(a) Bivariate scatter plot of the first two principal components; (b) loadings of component I; (c) loadings of component II. 1 – Changchengornis; 2 – Sinornis; 3 – Confuciusornis; 4 – Aurornis; 5 – Anchiornis; 6 – Wellnhoferia; 7 – Archaeopteryx; 8 – Compsognathus; 9 – Procompsognathus; 10 – Elmisaurus; 11 – Khaan; 12 – Sinovenator; 13 – Protarchaeopteryx; 14 – Sinornithosaurus; 15 – Sinornithoides; 16 – Bambiraptor; 17 – Nedcolbertia; 18 – Avimimus; 19 – Gallimimus; 20 – Ajancingenia; 21 – Coelophysis; 22 – Syntarsus; 23 – Struthiomimus; 24 – Harpymimus; 25 – Deinonychus; 26 – Chirostenotes; 27 – Liliensternus; 28 – Citipati; 29 – Dilophosaurus; 30 – Daspletosaurus; 31 – Aucasaurus; 32 – Allosaurus; 33 – Saurophaganax; 34 – Tarbosaurus; 35 – Deinocheirus; 36 – Tyrannosaurus; T1 – Type I; T2 – Type II.

The Deinonychosauria (sensu Senter, Reference Senter2007) Bambiraptor, Deinonychus, Sinornithoides and Sinovenator are characterized by the classic modified raptorial digit II, which is retractable and characterized by a hypertrophied sickle-shaped claw. It follows that such taxa could be excluded a priori as the putative trackmaker of the footprints studied in the present work, since they were made by a trackmaker with three functional digits during locomotion. Didactyl footprints referred to Deinonychosauria are well known and described in the literature (Sarjeant, Reference Sarjeant1971; Zhen et al. Reference Zhen, LI, Zhang, Chen and Zhu1995; Lockley et al. Reference Lockley, White, Kirkland and Santucci2004; Li & Lockley, Reference LI and Lockley2005; Li et al. Reference LI, Azuma, Fujita, Lee and Arakawa2006; Kim et al. Reference Kim, Kim, Lockley, Yang, Seo, Choi and Lim2008, Reference Kim, Lockley, Woo and Kim2012; Li et al. Reference LI, Lockley, Makovicky, Matsukawa, Norell, Harris and Liu2008; Mudroch et al. Reference Mudroch, Richter, Joger, Kosma, Idé and Maga2011). A wide range of taxa was considered in the morphometric analysis, including morphotypes that are incompatible with the Italian material, in order to provide a more comprehensive overview of the pedal type morphospace occupied by major groups of theropods. The selected lengths are shown in Figure 2 and total measurements are reported in Table 1.
The values obtained from the footprints (Type I and II) and from the osteological record were subjected to PCA using the software Paleontological Statistics 3.06 (PAST, Hammer, Reference Hammer2015). The raw data were log-transformed in order to fit linear models and for the correspondence of the log-transform to an isometric null hypothesis (see Chinnery, Reference Chinnery2004; Cheng et al. Reference Cheng, Holmes, WU and Alfonso2009; Romano & Citton, Reference Romano and Citton2015). Finally, a hierarchical cluster analysis was performed, again via the software PAST 3.06 using the pair-group algorithm (UPGMA) and the Euclidean Similarity index. The results of the analysis are discussed in the following sections.
2.a. Institutional abbreviations
FMNH – Field Museum of Natural History, Chicago, Illinois; OMNH – Oklahoma Museum of Natural History, Norman, Oklahoma.
3. Results
A first PCA was conducted on the total dataset. The analysis, conducted on a correlation matrix, showed that 97.2% of the variance was resolved into the first principal component and 1.45% into the second one. Thus, the first two principal components account for about 98.65% of the variance for the considered dataset. In Figure 4a the bivariate scatter plot of the first two principal components is shown. The second and third principal components account together only for 1.31% of the total variance. For this reason scatter plots of components 2 and 3 were not considered significant for the present study and are simply given for completeness in the online Supplementary Material available at http://journals.cambridge.org/geo. The taxa are connected via convex hulls according to the particular group they belong to. The analysis of the loadings for the first principal component (Fig. 4b) shows that the four variables considered are all positively correlated with comparable loads.
This indicates, in all probability, that the first principal component largely indicates the absolute size and substantial isometric growth (see Hammer & Harper, Reference Hammer and Harper2006). The distribution in the scatter plot along the first principal component describes the differences in size, from very small autopods as in the Avialae Changchengornis and Sinornis (metatarsus length about 2 cm) to giant pedal proportions as in Tyrannosaurus rex (metatarsus length about 78 cm). In the central position we find taxa of intermediate size such as Gallimimus, Harpymimus, Coelophysis and Avimimus. On the basis of the loadings (Fig. 4c), the second component is essentially a linear inverse combination between the length of the metatarsal and the length of the second digit (conventionally regarded as informative loading greater than 0.3 and smaller than −0.3). This means that, as the metatarsal length increases, the second digit (responding to the great part of the variance for principal component II) decreases and vice versa. On the basis of loading, the lengths of the third and fourth digit are not significant when it comes to detecting the variance and for the discrimination of morphometric patterns from the analysed dataset.
Members of Avialae form a fairly circumscribed cluster in the left portion of the graph (therefore small absolute size). The convex hull for Coelophysoidea shows an area of existence developed essentially along the principal component I, while definitely restricted along the second component. This indicates that the group is conservative with regard to the general arrangement and morphometric ratios of the feet, however, with a relatively broad range of dimensions, ranging from the smallest Compsognathus (metatarsus 53 mm in length) to the largest Dilophosaurus at the right end of the convex hull (metatarsus about 302 mm in length).
The convex hulls in Deinonychosauria, Ornithomimosauria and Oviraptorosauria show considerable areal extent along both components I and II. This suggests that, in addition to covering a considerable range of absolute size, taxa within these three groups are also characterized by consistent morphometric differences in pedal anatomy (in particular in the inverse relationship between the length of the metatarsus and the length of the second digit). The convex hulls in these groups (also including Coelophysoidea) are widely overlapping in the central portion of the graph.
Therefore, this area of morphospace is largely occupied by non-avian theropods. In the right portion of the scatter plot the convex hull is occupied by large members of Tyrannosauroidea. The extension along component I is very limited, and is shaped by taxa of comparably large dimensions.
When considering morphometric features (component II), Tyrannosaurus and Tarbosaurus are close, and share a common and consistent structural pattern. The tyrannosaurid Daspletosaurus, however, is far removed when component II is considered, revealing a distinctive and autapomorphic character within the group. It is worth noting, however, that the pes in Daspletosaurus it is not complete and digit II was coded with a question mark (this can affect the position of the taxon in the scatter plot, considering that digit II is crucial for the description of the total variance observed).
The two hypotheses based on the footprints studied in this paper fall very close to each other (Fig. 4). This indicates that, even when two alternative arrangements for the termination of the metatarsals and for the metatarsal–phalangeal articular region (Type I and II) are considered, the morpho-structural pattern remains consistent and solid. The two hypotheses fall within the convex hull area (Ornithomimosauria) and especially close to Struthiomimus. Using the software option ‘Min. span tree’ (linking morphometrically close taxa), the two hypotheses are connected to each other and in turn connect to both Struthiomimus and to Harpymimus, thus emphasizing a great affinity with Ornithomimosauria.
To further test this hypothesis a hierarchical cluster analysis was performed. The dendrogram obtained through the pair-group algorithm and the Euclidean Similarity measure is shown in Figure 5.
Cluster analysis dendrogram obtained using the pair-group algorithm and the Euclidean Similarity. The two hypotheses obtained from the footprints (Type I and II) are properly combined in a sister group relationship and are connected by a pectinate arrangement to Struthiomimus and Harpymimus.
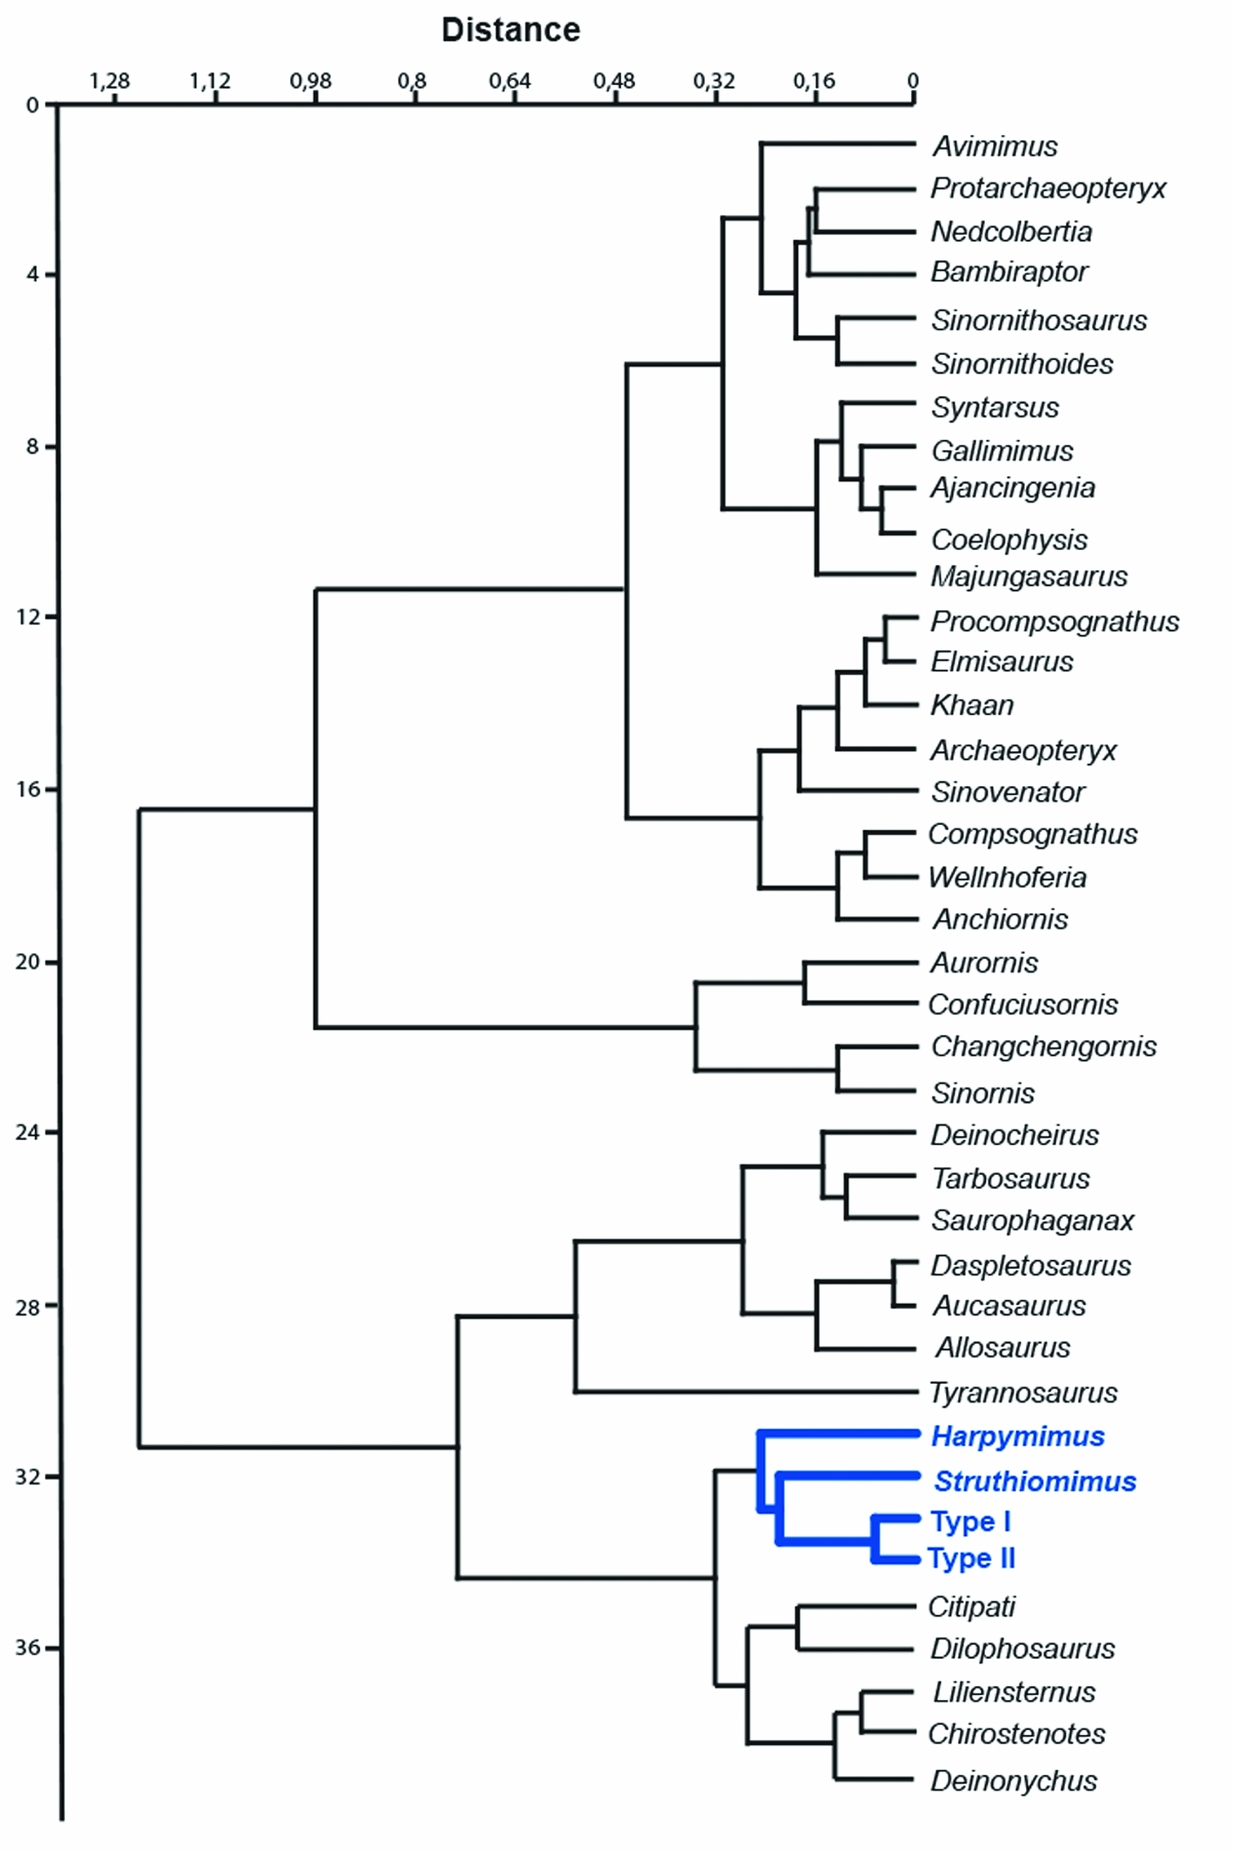
The two hypotheses are combined in a sister group relationship and are connected by a pectinate arrangement to Struthiomimus and Harpymimus, recovering the Harpymimus + Struthiomimus + Type I + Type II cluster and indicating an affinity of the Italian footprints to Ornithomimosauria. Based on these empirical results, the foot of Struthiomimus (taxon resulted as sister group of the footprints in the cluster analysis) was superimposed on the new footprints to test the match.
3.a. Matching the foot of Struthiomimus with the analysed footprints
When comparing foot morphology to the footprint, the arthral interpretation was preferred, so that the plantar pads and interphalangeal articulations are arranged accurately. This arrangement has recently been supported by Cuesta et al. (Reference Cuesta, Díaz-Martínez, Ortega and Sanz2015), describing the preserved podotheca (scales covering the foot in extant birds) in Concavenator corcovatus as the basal condition in Tetanurae. Here, this configuration is tentatively applied to Ornithomimosauria, specifically to the foot of Struthiomimus. In Figure 6 the pes is statically superimposed on the footprint, while the formation of a footprint necessarily implies a dynamic conception of the impression-making process (Baird, Reference Baird and Jacobs1980; Thulborn, Reference Thulborn2013; Romano, Citton & Nicosia, Reference Romano, Citton and Nicosia2016).
Static superimposition of the foot of Struthiomimus on analysed footprint. Corneous ungual sheath were assumed and shown in the illustration.

During this process, different parts of the foot contact the substrate in different and diachronic ways and many observed structures result from the interference of movements (with complex multiphasic download of body weight) at different stages of locomotion (see Thulborn & Wade, Reference Thulborn, Wade, Gillette and Lockley1989; Avanzini, Reference Avanzini1998; Gatesy et al. Reference Gatesy, Middleton, Jenkins and Shubin1999; Falkingham & Gatesy, Reference Falkingham and Gatesy2014; Romano, Citton & Nicosia, Reference Romano, Citton and Nicosia2016).
The foot of Struthiomimus matches the reference footprint rather well, with a close correspondence between the anatomical constraints and the shape and differential depth of impressions in the footprint (Fig. 6). Minor differences and discrepancies are likely a consequence of missing soft tissue regions (e.g. skin) and corneous ungual sheaths; these parts contribute to the impression but did not fossilize (except in rare cases, see below). According to Cuesta et al. (Reference Cuesta, Díaz-Martínez, Ortega and Sanz2015), in Concavenator corcovatus the impressions of corneous ungual sheaths extend beyond the tip of the ungual phalanx by 41.27% and 31.78% of the total claw length in relation to digits III and IV.
These percentages differ from those seen in extant birds (see Manning et al. Reference Manning, Margetts, Johnson, Withers, Sellers, Falkingham, Mummery, Barrett and Raymont2009 and discussion in Cuesta et al. Reference Cuesta, Díaz-Martínez, Ortega and Sanz2015) and are on average lower in extinct avian theropods, where they range from 12% to 30% (Pu et al. Reference PU, Chang, LÜ, WU, XU, Zhang and Jia2013; Cuesta et al. Reference Cuesta, Díaz-Martínez, Ortega and Sanz2015). Cuesta et al. (Reference Cuesta, Díaz-Martínez, Ortega and Sanz2015) suggested the higher percentage observed in Concavenator is caused by a taphonomic displacement of the skin and sheath with respect to their original anatomical position.
An additional character that makes the new Italian footprints compatible with a struthiomimid-like trackmaker is the complete absence of a hallux impression. Considering that the metatarsals were completely laid on the ground with an approximately horizontal final position (the depth of the straight portion of the metatarsal traces is fairly constant), the impression of the first digit might be expected, as observed in several published records (e.g. Lockley, Meyer & Faria dos Santos, Reference Lockley, Hunt, Meyer, Rainforth and Schultz1998; Lockley, Matsukawa & Li, Reference Lockley, Matsukawa and LI2003; Conti et al. Reference Conti, Morsilli, Nicosia, Sacchi, Savino, Wagensommer, Di maggio and Gianolla2005; Nicosia et al. Reference Nicosia, Petti, Perugini, D'Orazi porchetti, Sacchi, Conti, Mariotti and Zarattini2007; Gierliński, Lockley & Niedzwiedzki, Reference Gierliński, Lockley and Niedzwiedzki2009). Within Ornithomimosauria, Struthiomimus is characterized by the derived absence of the first toe in the foot. In particular, the derived group within Ornithomimosauria formed by Anserimimus, Archaeornithomimus, Gallimimus, Struthiomimus and Ornithomimus (constituting the Ornithomimidae sensu Makovicky, Kobayashi & Currie, Reference Makovicky, Kobayashi, Currie, Weishampel, Dodson and Osmólska2004) are identified by the loss of the first pedal digit, an unambiguous synapomorphy, in addition to a proximally reduced metatarsal III (Makovicky, Kobayashi & Currie, Reference Makovicky, Kobayashi, Currie, Weishampel, Dodson and Osmólska2004). In the same way, the absence of the imprint of the first digit in footprints with metatarsal traces led Farlow et al. (Reference Farlow, Bates, Bonem, Dattilo, Falkingham, Gildner, Jacen, Kuban, Martin, O'Brien, Whitcraft and Noto2015) to ascribe to ornithomimosaurs some elongated tracks from the classic Paluxy River site (Farlow et al. Reference Farlow, Bates, Bonem, Dattilo, Falkingham, Gildner, Jacen, Kuban, Martin, O'Brien, Whitcraft and Noto2015, p. 21, figs 5D and 5E).
Other morphological features of the metatarsus in the Ornithomimosauria are worth mentioning. In Garudimimus and Harpymimus metatarsal III separates metatarsals II and IV for the entire length of the metapodium; in ornithomimids metatarsals II and IV exclude metatarsal III in cranial view (along the extensor surface of the proximal portion) resulting in complete contact proximally (Makovicky, Kobayashi & Currie, Reference Makovicky, Kobayashi, Currie, Weishampel, Dodson and Osmólska2004). Such a configuration results in a proportionally very narrow metatarsal (typical condition of arctometatarsalia, see Holtz, Reference Holtz1994), compatible with the long and narrow traces of the metatarsals in the Italian specimens. Based on the dimensions of a complete skeleton of Struthiomimus altus figured in Longrich (Reference Longrich2008, fig. 6, p. 985) the putative trackmaker would have had a hip height of about 1.06 m and a total body length of about 2.8 m.
4. Discussion
The new Italian footprints allow a morphometric–quantitative approach to test the correspondence and compatibility between theropod tracks with metatarsal impressions and the osteological structures of autopods in the principal groups of theropods.
The preliminary results of the PCA indicate that the relative length of the second digit can be a useful diagnostic character within theropods, with repercussions for the study of body fossils and the interpretation of the ichnological record. The third digit appears to be less variable (loading equal to −0.1899, therefore not significant for the variance), with a more stable relationship with the metatarsus, even with a substantial increase in size. This could be related to the strictly mesaxonic functionality in both large and small theropods (at least in the weight-bearing phase). In this interpretation, the more functional structures, with a crucial role in locomotion, are less variable and more conservative.
In a cluster analysis dendrogram Avialae are combined in one group, demonstrating a stable and compact morphometric pattern for the foot in that clade, with the exception of Wellnhoferia and Anchiornis, which may have acquired a pes structure more similar to that of Compsognathus. The large theropods Tyrannosaurus, Tarbosaurus, Daspletosaurus, Allosaurus, Saurophaganax and Deinocheirus are gathered in a cluster, hinting at a similar pedal structure. Similar results have been also obtained by Farlow et al. (Reference Farlow, Holtz, Worthy, Chapman, Parrish, Molnar, Currie and Koppelhaus2013) and Farlow et al. (Reference Farlow, Schachner, Sarrazin, Klein and Currie2014). These authors used different homologous measures (particularly the length and width of pedal phalanges) in their cluster analyses, obtaining a gathering of the genera Tyrannosaurus, Allosaurus and Daspletosaurus in the same group on a morphometric basis (Farlow et al. Reference Farlow, Holtz, Worthy, Chapman, Parrish, Molnar, Currie and Koppelhaus2013, p. 117, fig. 5.18), as well as Allosaurus, Gorgosaurus and Tyrannosaurus (Farlow et al. Reference Farlow, Schachner, Sarrazin, Klein and Currie2014, p. 1035, fig. 9). Considering that all these taxa reached very large body sizes, the result of the cluster analysis might highlight a common convergence of the pes reflecting the need to support a large body during locomotion and in the resting phase (see also Farlow et al. Reference Farlow, Holtz, Worthy, Chapman, Parrish, Molnar, Currie and Koppelhaus2013). New and ongoing morphometric studies consider RMA slopes, Landmark and finite elements analysis in major non-avian theropods in an attempt to identify possible allometric trends with increasing absolute size; these efforts will likely shed light on these issues.
Both in the PCA and in the cluster analysis the two morphological hypotheses (e.g. Type I and Type II) fall very close to each other, indicating a well-defined and stable general structure, despite the two different interpretations for the metatarsus distal end. However, based on the differential depth analysis of the footprints, and in particular the identification of the medio-laterally moved metatarsal–phalangeal pad of digits III and IV, the Type I hypothesis results are decidedly more plausible. This model includes a shorter second metatarsal with the third and fourth metatarsal more or less coincident and more developed distally, thus similar to the foot structure of Struthiomimus that is characterized by a shorter metatarsal II.
The analysis suggests that the putative trackmaker is a member of Ornithomimosauria, with a greater morphometric affinity with Struthiomimus and Harpymimus. Considering the lack of a hallux track, and the arctometatarsalian structure of the metatarsal, the putative trackmaker is very likely a member of the Ornithomimidae (sensu Makovicky, Kobayashi & Currie, Reference Makovicky, Kobayashi, Currie, Weishampel, Dodson and Osmólska2004) with noteworthy affinities with Struthiomimus.
This present ichnological study also sheds light on the behaviour of the putative trackmaker. Ornithomimosaurs are a group of lightly built theropods, medium to large in size. Because of the particular conformation of the hindlimb (well developed, with proportionately long distal elements) in this group, they have been considered among the most cursorial of theropods (e.g. Holtz, Reference Holtz1994; Makovicky, Kobayashi & Currie, Reference Makovicky, Kobayashi, Currie, Weishampel, Dodson and Osmólska2004). According to Makovicky, Kobayashi & Currie (Reference Makovicky, Kobayashi, Currie, Weishampel, Dodson and Osmólska2004) ornithomimids were characterized by a well-developed sense of balance and had to be fast runners. Thulborn (Reference Thulborn1990) has estimated a maximum running speed for ornithomimosaurs of 35 to 60 km hr−1. The recently re-described heavily built Deinocheirus mirificus (Lee et al. Reference Lee, Barsbold, Currie, Kobayashi, Lee, Godefroit, Escuillie and Chinzorig2014) departs from this trend. It is the largest member of the Ornithomimosauria and has been interpreted as a non-cursorial theropod.
Our work focused on ‘crouching’ postures in ornithomimosaurs (for a discussion of the meaning of ‘crouching’ see Citton et al. Reference Citton, Nicosia, Nicolosi, Carluccio and Romano2015). This particular behaviour may be related to a resting position during a locomotor cycle, or squatting for foraging. Prey stalking or careful walking during locomotion on unstable or waterlogged substrates has also been suggested in the literature (see Kuban, Reference Kuban, Gillette and Lockley1989; Romero-Molina et al. Reference Romero-Molina, Sarjeant, Pérez-Lorente, Lopez and Requeta2003; Nicosia et al. Reference Nicosia, Petti, Perugini, D'Orazi porchetti, Sacchi, Conti, Mariotti and Zarattini2007; Petti et al. Reference Petti, Conti, D'orazi Porchetti, Morsilli, Nicosia and Gianolla2008).
It is not known if theropods substantially modified their locomotion pattern when walking on different substrates. Wilson, Marsicano & Smith (Reference Wilson, Marsicano and Smith2009) suggested that basal theropods did not change their mode of locomotion substantially on different sediment and substrate conditions, unlike ornithopods for example. In extant taxa, Milàn (Reference Milàn2006) described and figured long metatarsal tracks from the large cursorial taxon Dromaius novaehollandiae, which were left by the animal during feeding on the ground. In this case, the metatarsus made complete contact with the substrate. In the new Italian ichnofossils it is worth noting that in this ‘crouching’ position, traces of the manus are not preserved, in contrast to other similar finds (see Milner et al. Reference Milner, Harris, Lockley, Kirkland and Matthews2009 and references therein). According to Makovicky, Kobayashi & Currie (Reference Makovicky, Kobayashi, Currie, Weishampel, Dodson and Osmólska2004), Struthiomimus is peculiar in having the proportionally longest hand among ornithomimosaurs. With this configuration, once the theropod was crouching on the metatarsals, the front limb would have likely interacted with the substrate. Therefore, it is possible that the Italian trackmaker, although having affinities with Struthiomimus in the pedal skeleton, differed in the length and overall osteology of the forelimb. The main movements made by the trackmaker, involving a resting phase in a ‘crouched’ position followed by squatted walking and final rising up, are shown in Figure 7.
Main phases of the movement made by the Riomartino trackmaker. (a) Resting phase in ‘crouched’ position; (b) the trackmaker walks in a ‘crouched position’, while the right footprint is being definitively impressed; (c) initial rising up and definitive impression of the second left footprint; (d) final kick-off. Artwork created by Davide Bonadonna (http://www.davidebonadonna.it).

Regarding the age, there is a good match between the identified taxonomic group and the age of the trampled block. The block can be attributed a late Aptian – ?early Albian age. Ornithomimosauria have a late Barremian to late Maastrichtian distribution; Harpymimus is known from upper Albian deposits while Struthiomimus has a temporal range from the late Campanian to the early Maastrichtian (Makovicky, Kobayashi & Currie, Reference Makovicky, Kobayashi, Currie, Weishampel, Dodson and Osmólska2004). Elongated tracks of metatarsals in theropod footprints from central Italy (Sezze ichnosite, Cenomanian) and southern Italy (Borgo Celano, late Hauterivian – early Barremian) have been considered compatible with an Ornithomimosauria and Oviraptorosauria trackmaker (Nicosia et al. Reference Nicosia, Petti, Perugini, D'Orazi porchetti, Sacchi, Conti, Mariotti and Zarattini2007; Petti et al. Reference Petti, Conti, D'orazi Porchetti, Morsilli, Nicosia and Gianolla2008). At the Sezze ichnosite, the authors considered the second trackmaker more likely, based on the narrow trace of a claw, which appears to be more compatible with the laterally compressed ungual phalanges in oviraptorosaurs. The large theropod tracks from Witt Ranch (Dakota Group, Union County, New Mexico) preserve an elongated posterior impression, doubtfully referable to the metatarsals, and were assigned by Lockley, Matsukawa & Witt (Reference Lockley, Matsukawa and Witt2006) to an ornithomimid or struthiomimid theropod, such as the most common Dakota Group theropod ichnotaxon Magnoavipes; according to the authors such attribution is corroborated and supported by the complete absence of a hallux trace.
The attribution of tracks to a struthiomimid-like theropod requires some palaeobiogeographical considerations, in the light of the current discussion about the palaeogeography of the central Mediterranean area. The Riomartino tracks can be easily included in the second association of the dinosaur track record of Italy (late Tithonian – late Cenomanian), recently discussed by Citton, Nicosia & Sacchi (Reference Citton, Nicosia and Sacchi2015). According to these authors, during the late Tithonian – late Cenomanian time interval a northern origin of the dinosaurian fauna making up this association can be discarded owing to the existence of a large oceanic area called the Vardar Ocean (Channel & Kozur, Reference Channel and Kozur1997); similarly, a provenance from the east can be excluded because of the presence of the Ionian trough (Aubouin, Reference Aubouin1959) separating the Italian carbonate platforms from the Dinaric region, and in addition, migration from western areas (Iberian region, Canudo et al. Reference Canudo, Barco, Pereda-Suberbiola, Ruiz-Omeñaca, Salgado, Fernández- Baldor and Gasulla2009) can be rejected since the Umbro-Marchean succession was sedimented in a wide and deep depositional basin, most likely not allowing any passage. Back to the putative trackmaker, Ornithomimosaurs are predominantly known from Central Asia, North America (e.g. Shenzhousaurus, Harpymimus, Garudimimus) and Spain (i.e. Pelecanimimus) (Makovicky, Kobayashi & Currie, Reference Makovicky, Kobayashi, Currie, Weishampel, Dodson and Osmólska2004). Thus, taking into account the palaeogeographic framework of the peri- Mediterranean area in Middle Cretaceous time (Aptian, Fig. 8), dinosaurs could have reached the ‘Apenninic Carbonate Platform’ through migration routes from Gondwana via Adria (Sacchi et al. Reference Sacchi, Conti, D'Orazi Porchetti, Logoluso, Nicosia, Perugini and Petti2009; Zarcone et al. Reference Zarcone, Petti, Cillari, Di stefano, Guzzetta and Nicosia2010). Apart from skeletal remains referred to Nqwebasaurus thwazi from the Kirkwood Formation (Lower Cretaceous) of South Africa, regarded as the basalmost known ornithomimosaur (Choiniere, Forster & de Klerk, Reference Choiniere, Forster and de Klerk2012), these theropods have never been further reported from southern continents.
Palaeogeographic map of the peri-Mediterranean region during the Aptian (from Turco et al. Reference Turco, Schettino, Nicosia, Santantonio, Di stefano, Iannace, Cannata, Conti, Deiana, D'Orazi Porchetti, Felici, Liotta, Mariotti, Milia, Petti, Pierantoni, Sacchi, Sbrescia, Tommasetti, Valentini, Zamparelli and Zarcone2007, redrawn and modified). Ad – Adriatic–Dinaric Carbonate Platform; ACP – Apenninic Carbonate Platform; Ap – Apulian Platform; AT – Alpine Tethys Ocean; Au – Australpine; Ba – Bagnolo Carbonate Platform; Br – Briançonnais; Cl – Calabria; Ga-Tr – Gavrovo-Tripoliza; Io-t – Ionian trough; Ib – Iberia; Im – Imerese Basin; LB – Lombard Basin; Li – Ligure-Piemontese Ocean; Lg – Lagonegro Basin; NCA – Northern Calcareous Alps; Pa – Panormide Carbonate Platform; Pel – Pelagonian; Pi – Pindos; Si – Sicanian Basin; U-M – Umbria-Marche Basin; Val – Valais Ocean. White footprint highlights the location of the Apenninic Carbonate Platform, from which the tracks in study come from.

5. Conclusions
Our work highlights the great potential of morphometric methods to describe specific characters of a given taxonomic group (both in body fossils and in footprints) more objectively, as already convincingly pointed out recently in the literature (Castanera et al. Reference Castanera, Colmenar, Sauqué and Canudo2015).
These approaches integrate morphometric analysis with footprint morphology and differential impression depth (‘footprint holomorphy’ sensu Romano, Citton & Nicosia, Reference Romano, Citton and Nicosia2016), and may shed light on taxonomically relevant characters but also on the biomechanical properties and importance of selected anatomical regions. The latter, cross-checked and plotted on a phylogenetic analysis, can be pivotal for understanding in which particular node and branch a specific morphology, or even a particular behavioural trait, has been acquired. Such integrative approaches also shed light on the dispersal of different clades and different palaeobiogeographical models. In this study, we consider it likely that dinosaurs could reach the Apenninic Carbonate Platform only through migration routes from Gondwana through the Adria region. The identification of a struthiomimid-like theropod as the putative trackmaker of the new Italian material further supports that putative Ornithomimosauria were present in Gondwana, as previously suggested by other Italian tracks and skeletal material from South Africa. Ichnological data proved to be once again a crucial source of evidence, especially in cases where the body-fossil record results are virtually absent. As we have experienced in recent years, ichnology has passed, in all respects, from a mere curiosity or corollary of vertebrate palaeontology, to a critical mass of ‘pawing’ often unique evidences and inferences.
Acknowledgements
Kenneth Angielczyk of the Field Museum of Natural History (Il, USA) and Kyle Davis of the Sam Noble Museum of Natural History (Ok, USA) are warmly thanked for providing useful photographic material of Tyrannosaurus and Saurophaganax. Umberto Nicosia is specially thanked for discussions during the study and the preparation of the manuscript. We are also grateful to Nizar Ibrahim, for his suggestions and correction of an early version of this manuscript, and to Simone Maganuco, for important tips on the final version. The artist Davide Bonadonna (http://www.davidebonadonna.it) is warmly thanked for having created the artworks. We further thank Peter Falkingham, an anonymous reviewer and the Executive Editor Paul Upchurch for suggestions and comments that greatly improved the manuscript. This work was made possible by financial support to MR from the Alexander von Humboldt-Foundation (Sofja Kovalevskaja-Award to Jörg Fröbisch ‘Early Evolution and Diversification of Synapsida’ of the German Federal Ministry of Education and Research). This study was conducted within the ‘PalaeoWorks’ Project (https://www.facebook.com/pages/PalaeoWorks/1444856609165872).
Supplementary material
To view supplementary material for this article, please visit http://dx.doi.org/10.1017/S0016756816000546.